Friday Midday Color - Dow's 5th Loss, Energy Breadth, Utes, Social Negatives

Here's what's piquing my interest approaching a long holiday weekend and buyers seemingly anxious to hold.
Losing
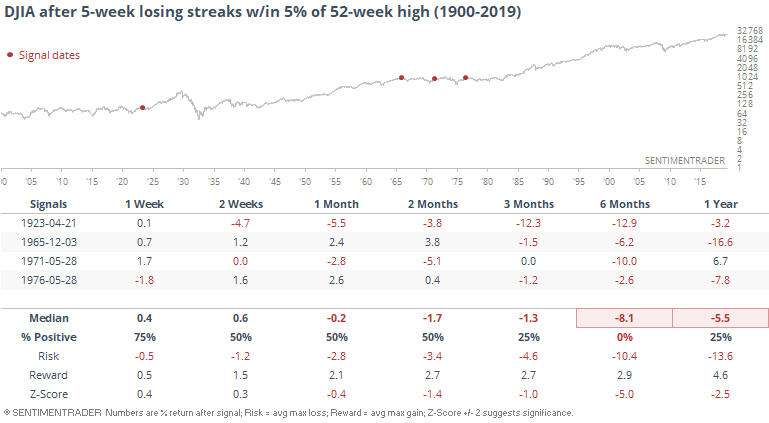
If the Dow continues to slide and closes out its 5th-straight week with a loss, it will be the first time in 40 years it's lost so consistently while still hovering within 5% of its 52-week high.
The others were not very encouraging.
It's hard to read much into a sample size of 4, so if we relax the parameters and look at 4-week losing streaks, returns improve considerably, especially over the past 40 years.
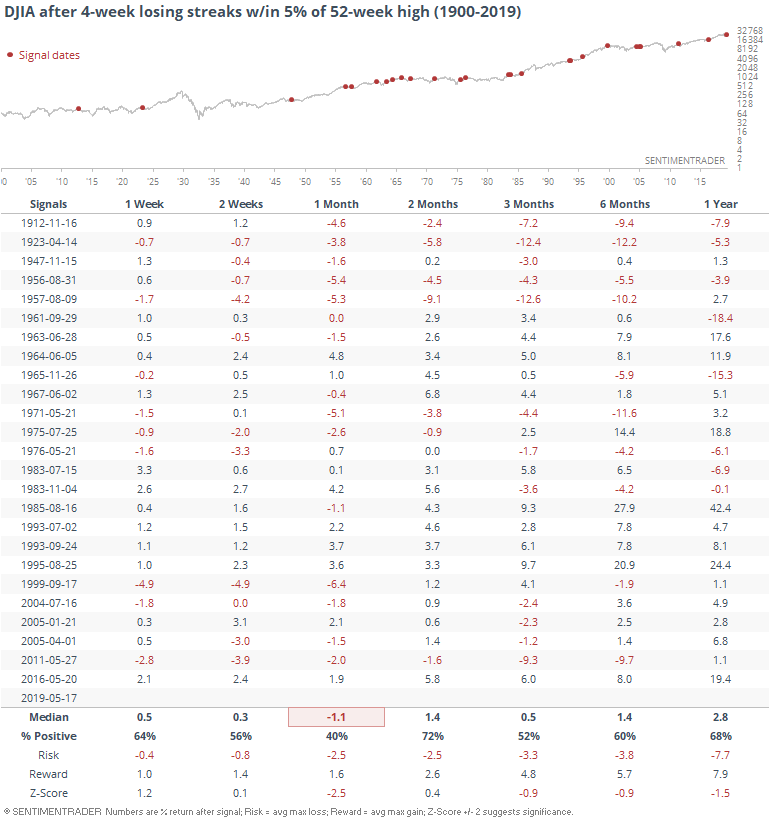
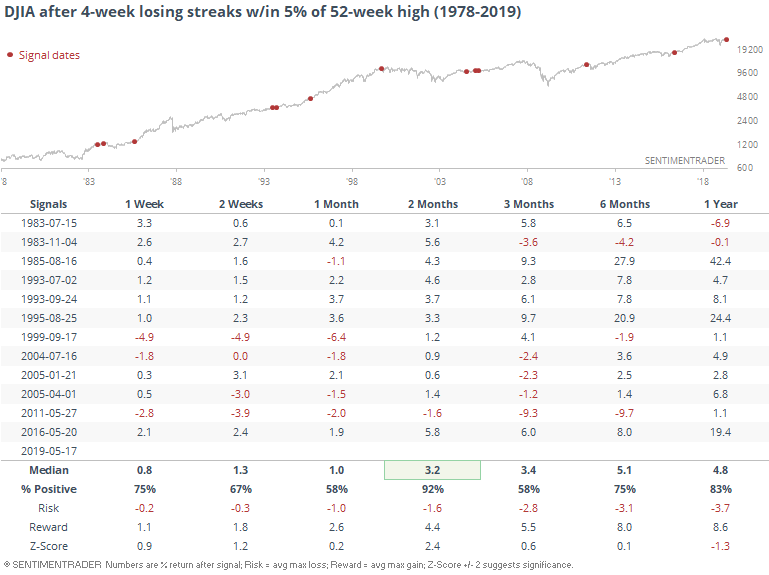
If we just look at the last 40 years, we can see how much better the returns become.
Breadth Review
With the destruction in oil over the past couple of sessions and coincident selling in energy shares, it's not a big surprise that there were some extremes generated in that sector. There was a jump in the number of energy stocks trading below their volatility bands, hitting at least multi-month lows, and trading below their moving averages.
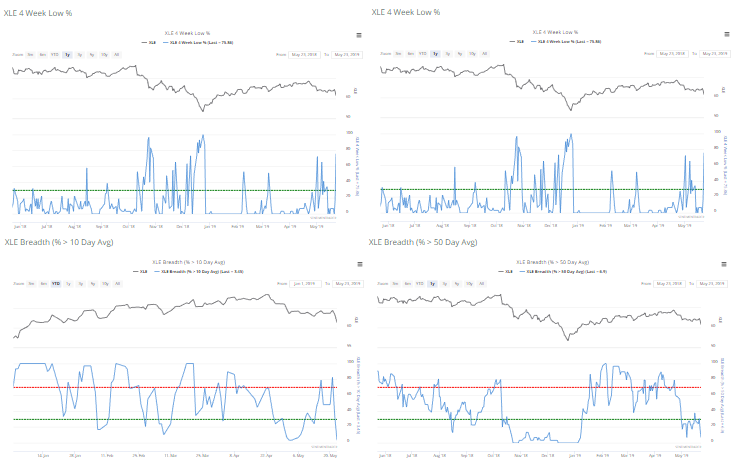
We can combine a bunch of these "oversold" types of indicators into a single composite and see just how much of a broad-based breadth extreme we're seeing. And it's pretty extreme right now.
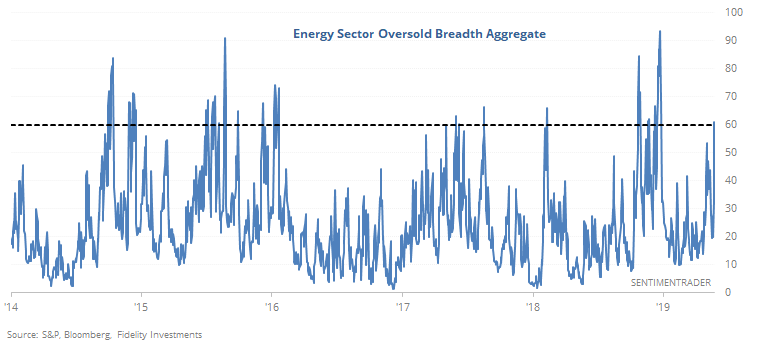
It has been quite a bit higher, and it turns out that we'd need to see a higher reading to have much confidence that the sector has most likely already seen exhaustive selling pressure. As it stands right now, it's not enough to precede consistently positive returns.
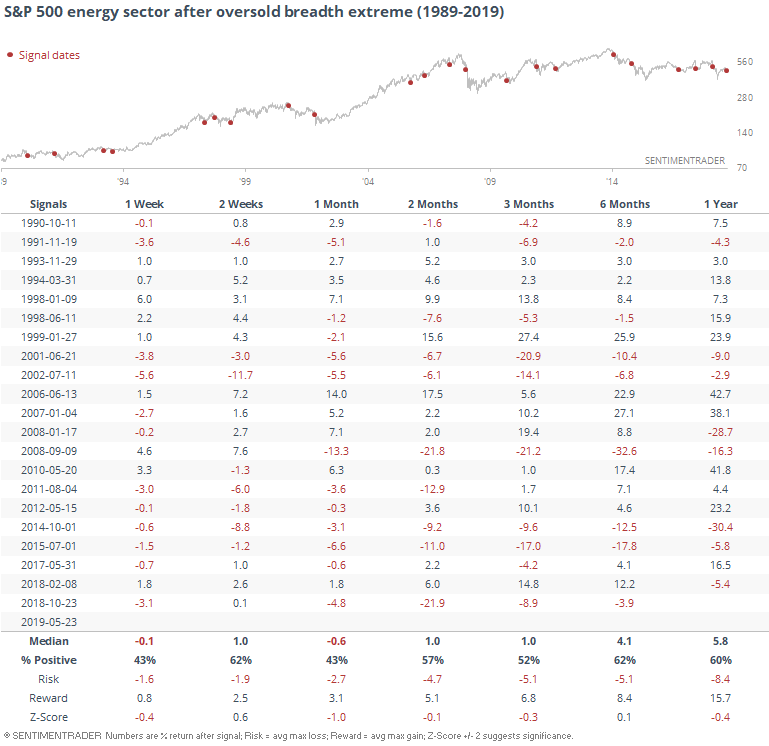
Risk in the months ahead was too high relative to reward, and a month later there were more losses than gains, especially since the financial crisis.
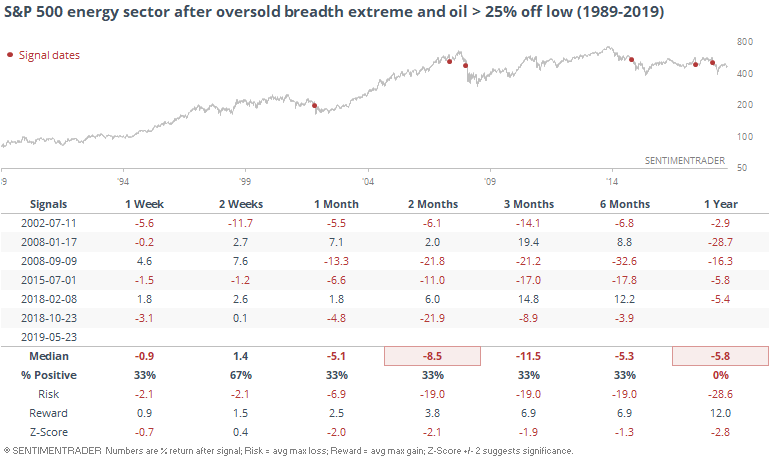
What's also concerning is that oil stocks are getting hit this hard while crude oil futures are still well off their lowest prices of the past year. Even after the recent losses, oil is still more than 35% higher than its 52-week low. Other times energy sector breadth got this bad when oil was at least 25% above its low, the stocks did not perform well.
Some overseas markets have also been hit hard, like the Hang Seng. That market is starting to see some extremes, like more than a third of the stocks in that index reaching oversold levels in the RSI.
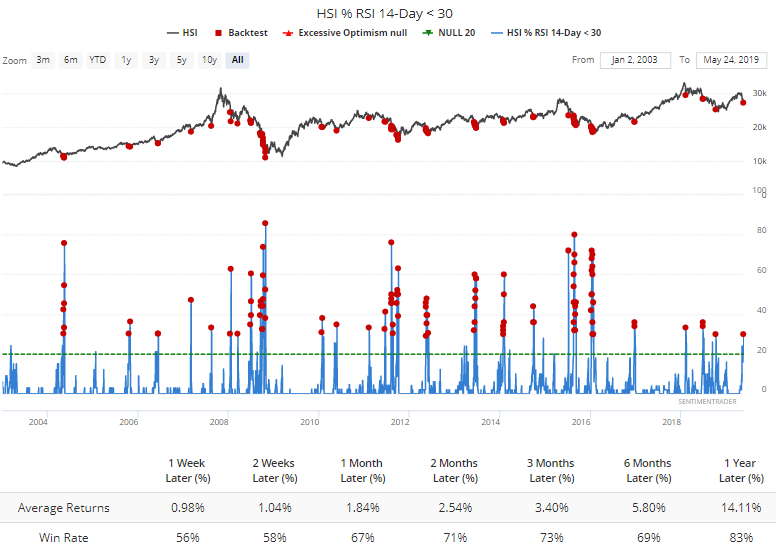
More than 45% of them have also slid to a multi-month low.
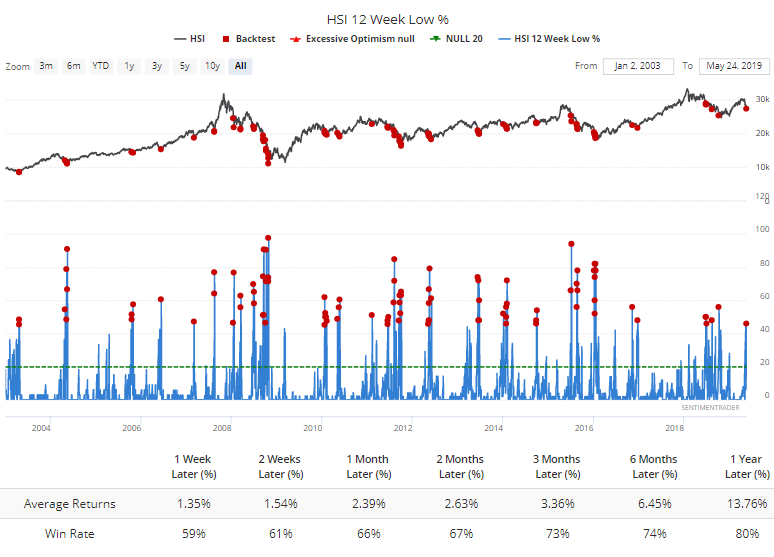
A really good way to see just how severe and persistent a decline has been is to look at the moving averages of some shorter-term breadth measures. For example, an average day over the past month has seen more than 35% of stocks in the Hang Seng trading at a one-month low. That hasn't been seen since 2016.
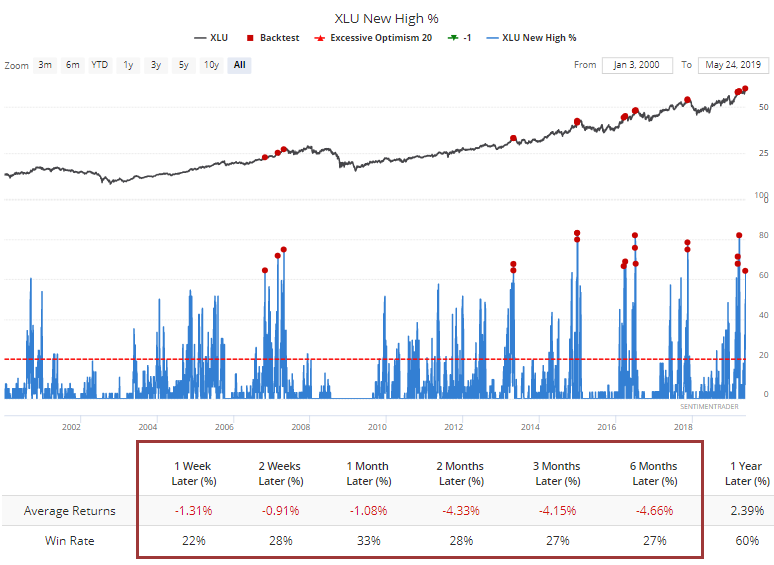
If investors are selling shares in certain sectors and not willing to hold cash, then they need to rotate somewhere. One of the biggest beneficiaries has been utilities. More than 65% of those stocks have now jumped to a multi-month high.
And well over 60% of them hit a 52-week high. Like we saw in March, it's hard for such staid sector like this to sustain this kind of concerted buying pressure for long.
Social Negativity
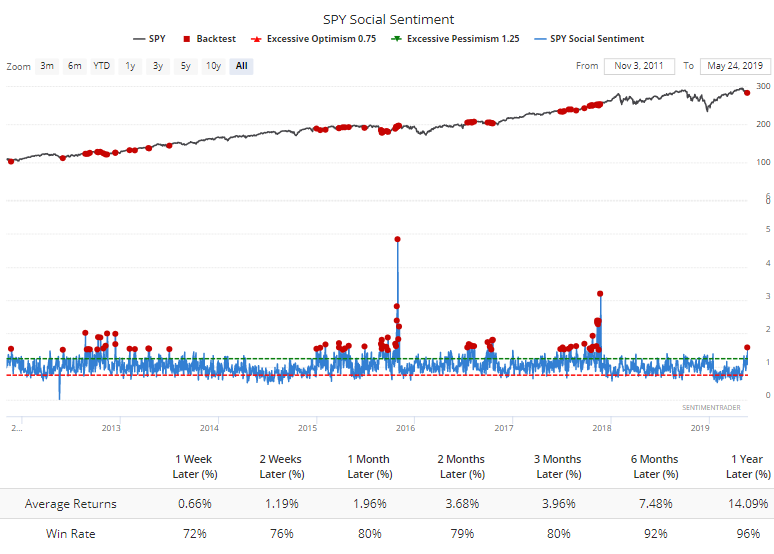
The massive and persistent pre-market losses seem to be weighing on the folks who engage on Twitter. For the most-traded fund in the world, there were more than 1.5 negative messages for every positive one on SPY.
Those social media users typically did not turn negative at the right points.