Friday Midday Color - Bonds, Renewed Momo, Overseas Extremes

Here's what's piquing my interest as traders try to end the week on an up note.
Panicky
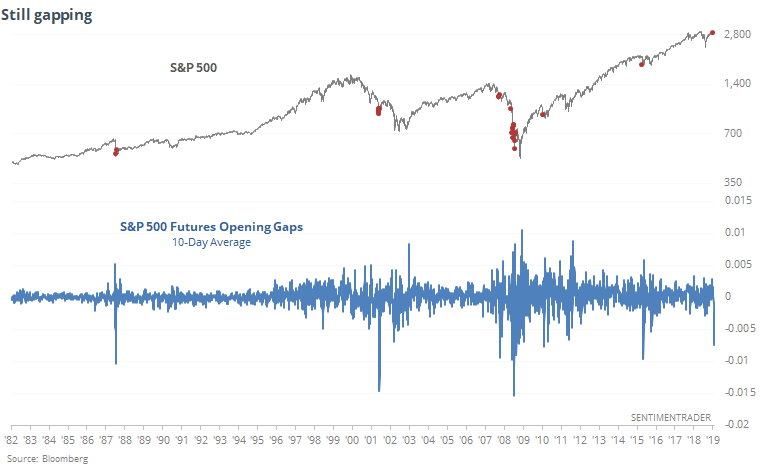
The pre-market nerves are continuing. We've touched on this a few times this week, and traders continue to push futures down before the open of regular trading hours. Over the past 10 days, the average gap in S&P 500 futures is now down to -.75%.
This is not something we often see, and other than during the grips of the financial crisis, was at/near the end of swift, severe declines.
Bonds
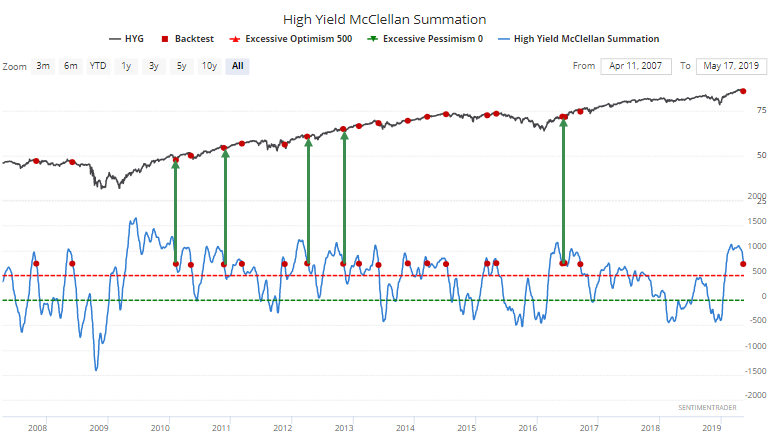
High-yield bonds have been struggling a bit under the surface. Over the past 5 days, the McClellan Oscillator for that market has averaged -40, fairly deep reading, especially when funds like HYG are still holding above their 200-day averages.
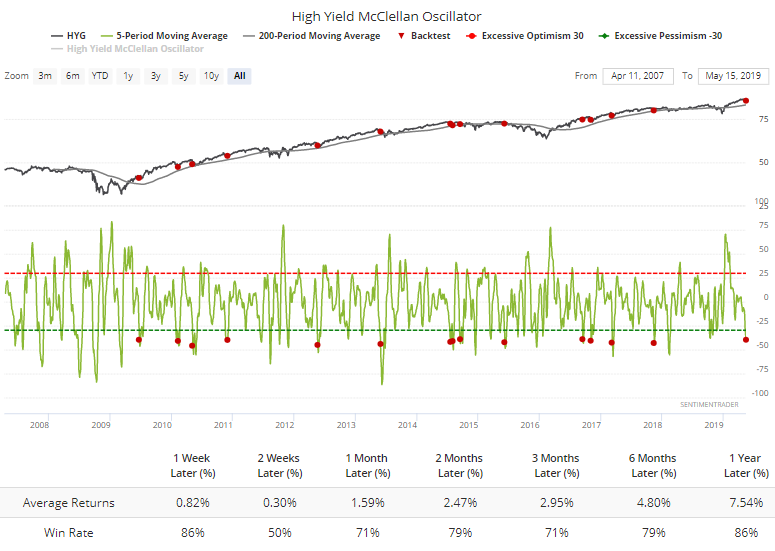
That triggered the Summation Index to fall under 750.
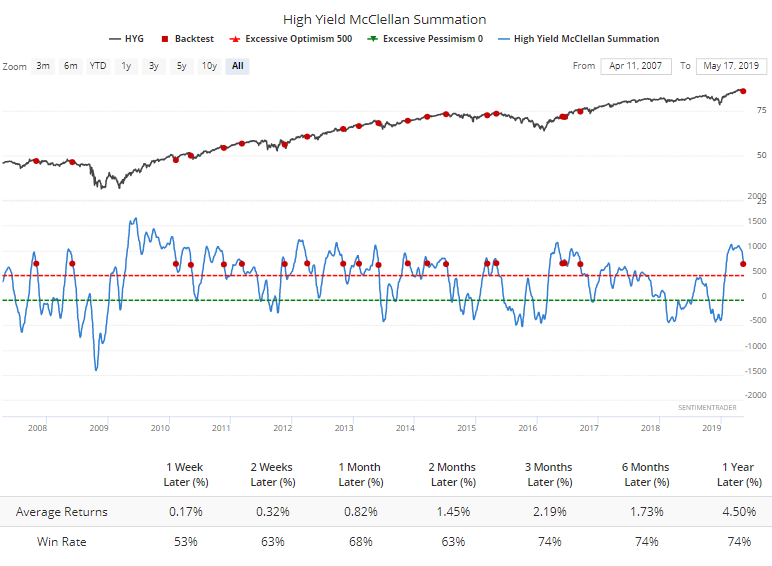
If we focus on the times when that waning momentum came after extended periods above that threshold, the outlook was brighter.
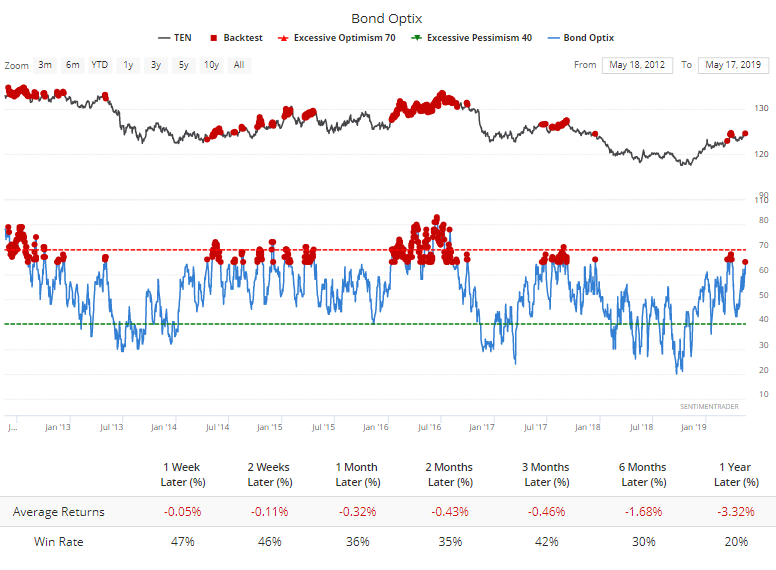
In the Treasury market, optimism has been climbing and is nearing an extreme. The broad Bond Optimism Index is at 65, among the highest readings in a year.
Over the past 7 years, when 10-year futures peaked, optimism this high has led to only rare price gains for those buyers.
Stocks
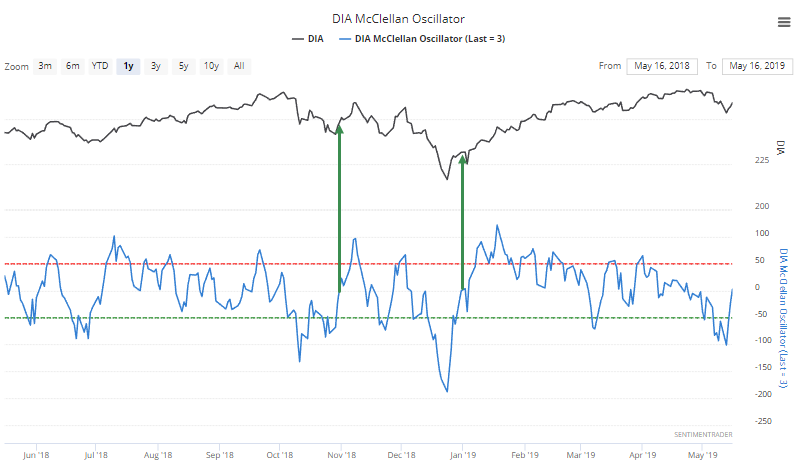
For the major stock indexes, the Oscillator has managed to pop above 0 after weeks below. For the Dow Industrials, it spent weeks below 0 and fell as low as -100. The last two times, it enjoyed at least a few more days of upside once this underlying momentum turned positive.
Looking at all signals over the past 20 years, it was still a good sign.
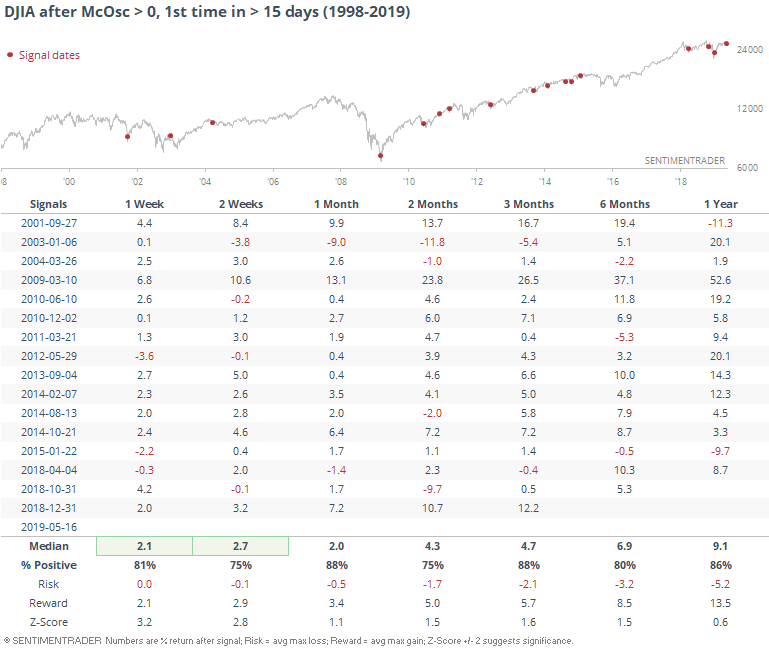
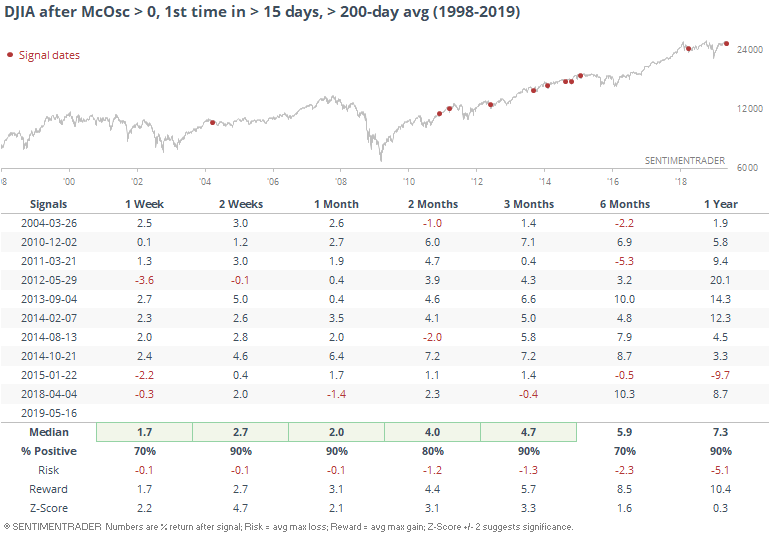
That was especially the case if the Dow was above its 200-day average at the time.
The same thing in happening in the Nasdaq 100 fund, QQQ, but on a much more compressed time frame. It has scrambled from below -100 to above 0 but it took only a little over a week.
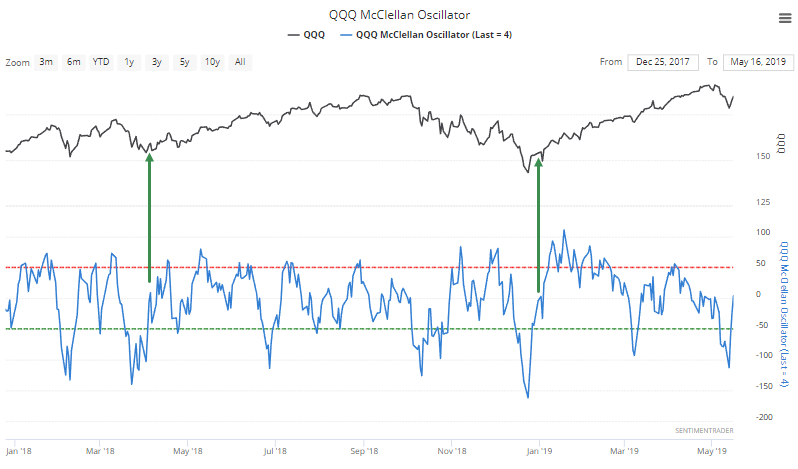
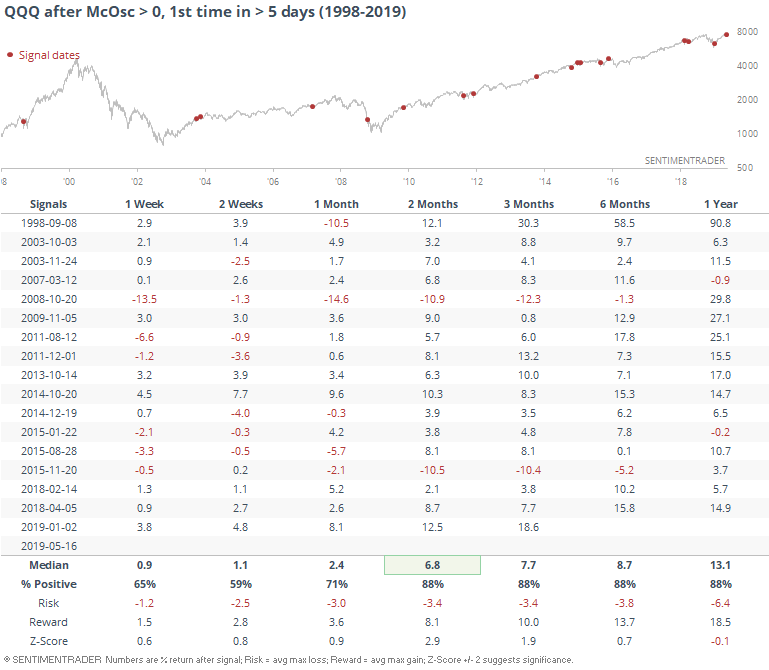
That, too, had a tendency to lead to further gains.
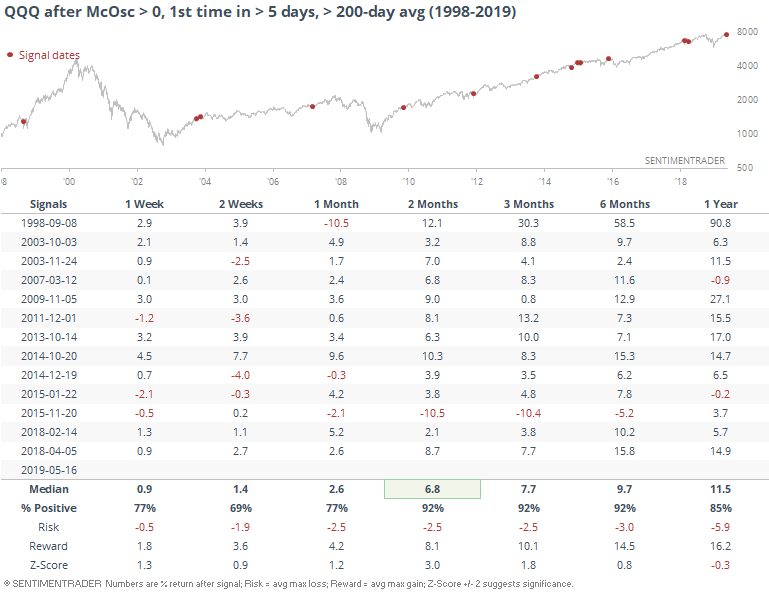
Including only times when QQQ was above its 200-day average at the time, only a single signal led to any meaningful decline in the months ahead.
Overseas, the Shanghai Composite if finally seeing a little underlying momentum, with the Oscillator popping above 0 for the first time in over a month, ending its longest streak below 0 since May 2017.
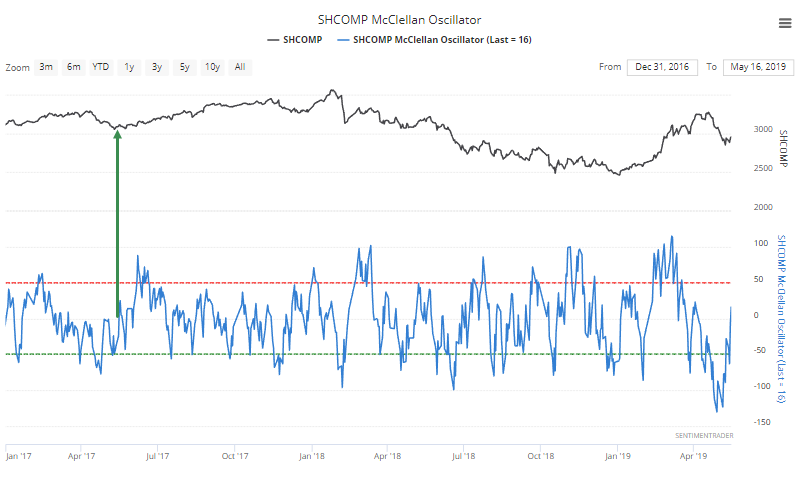
This has been less consistent as a buy signal than in U.S. indexes, though.
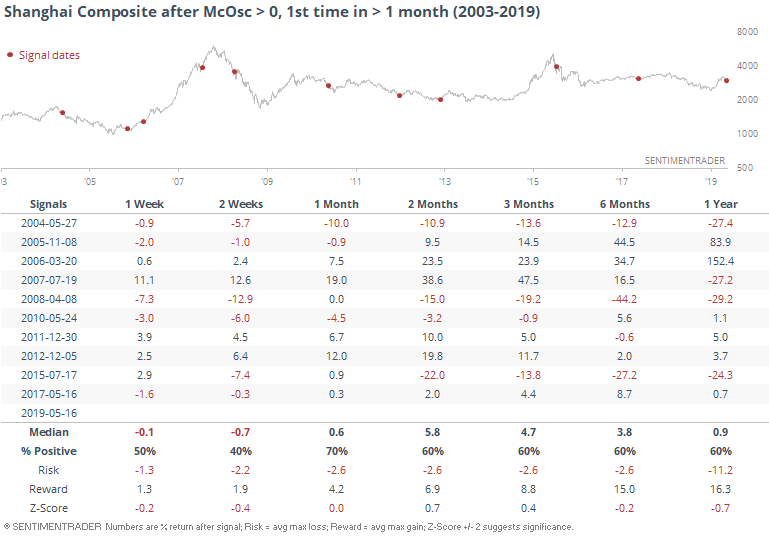
Only one of those signals triggered after the Oscillator had been as deeply negative as it was in the past few weeks. This is the only other time that market has selling pressure as it has seen lately, which was July 2015.
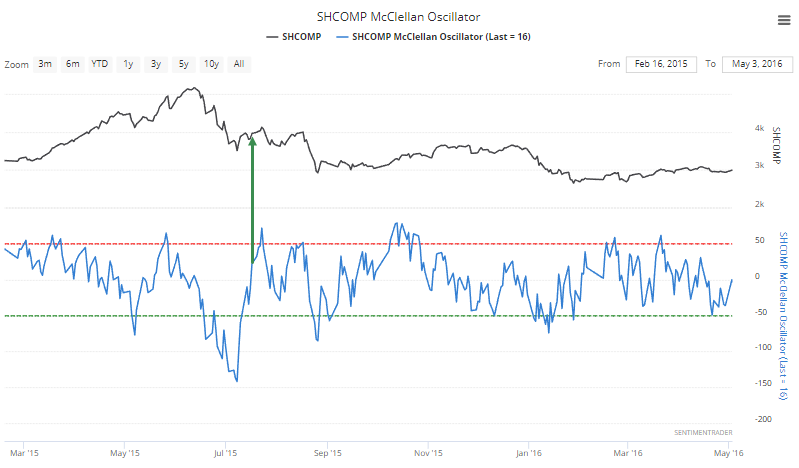
Then, when the Oscillator climbed above 0 after a protracted and severe drop below, it rallied for another week, then collapsed. This is a worry.
The only other notable developments overseas is in Brazilian stocks. Within the Ibovespa, nearly 40% of stocks have plunged below their lower Bollinger Bands despite the index still holding above its 200-day average.
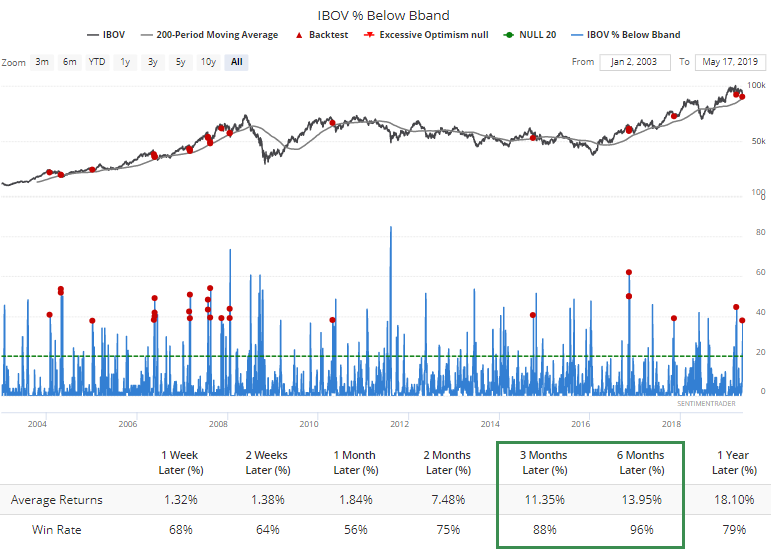
More than half of the stocks have dropped to their lowest level in a month.
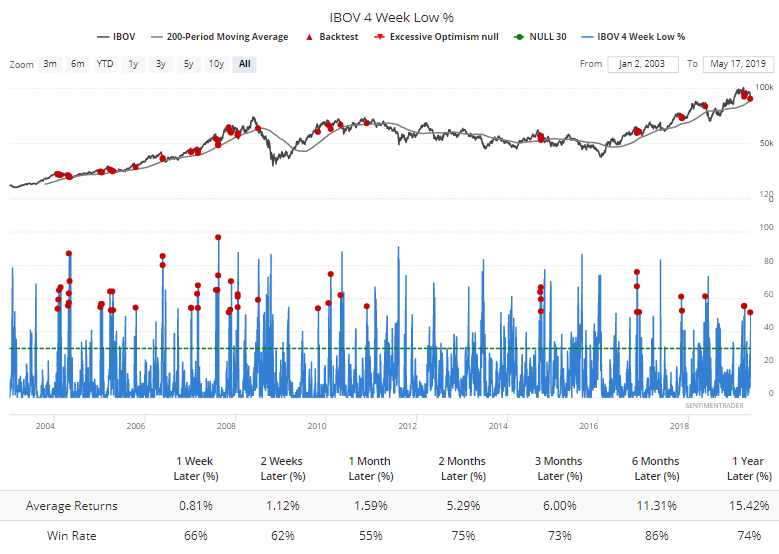
And more than a third to their lowest level in at least 3 months.
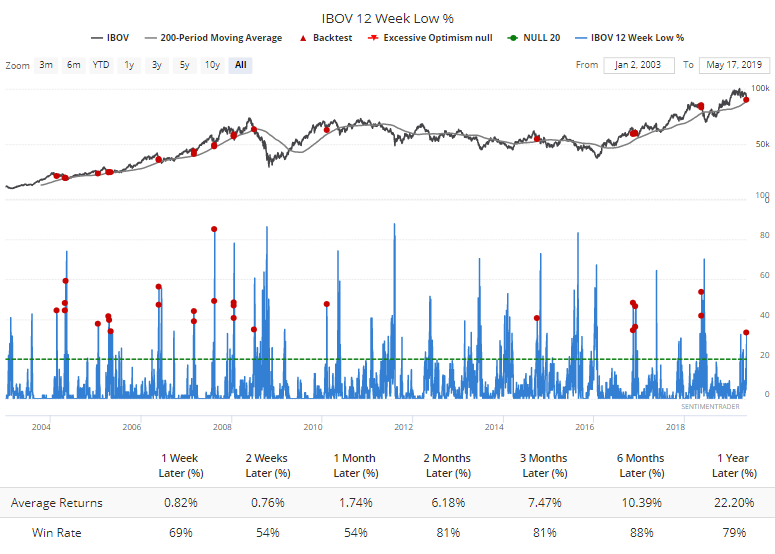
All led to decent gains over the medium-term.
Angst
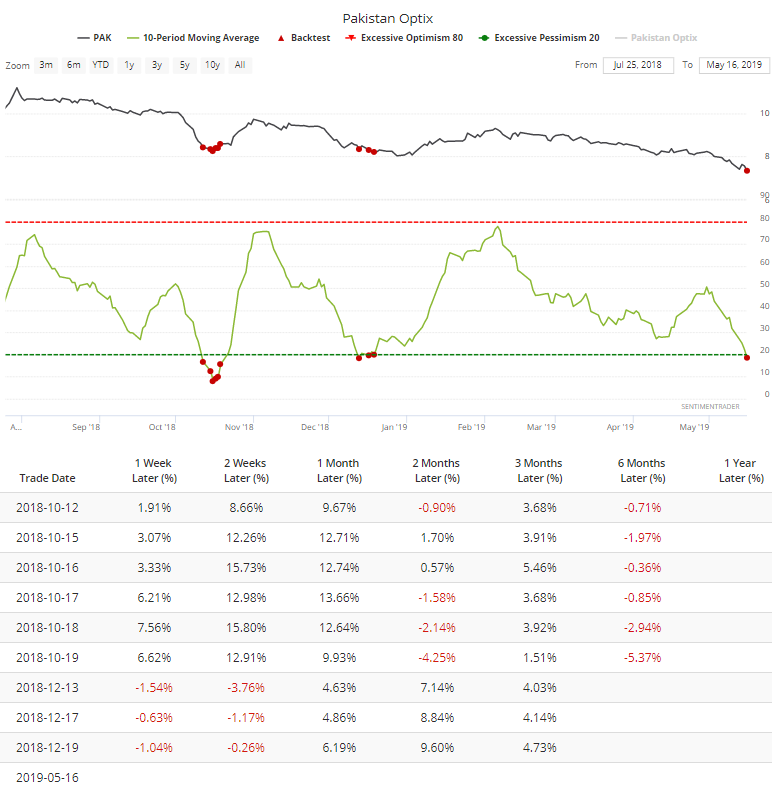
Some of the country-specific ETFs we follow are showing true extremes in pessimism.
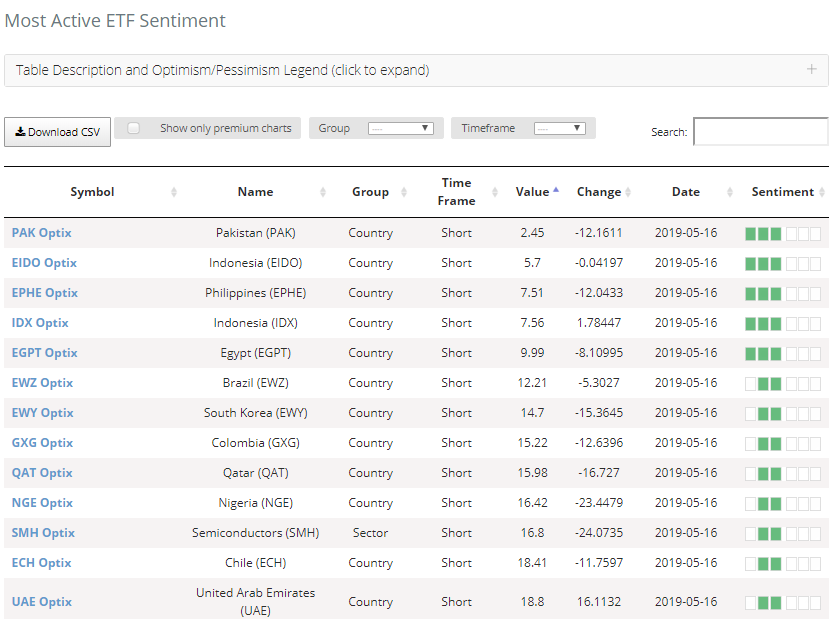
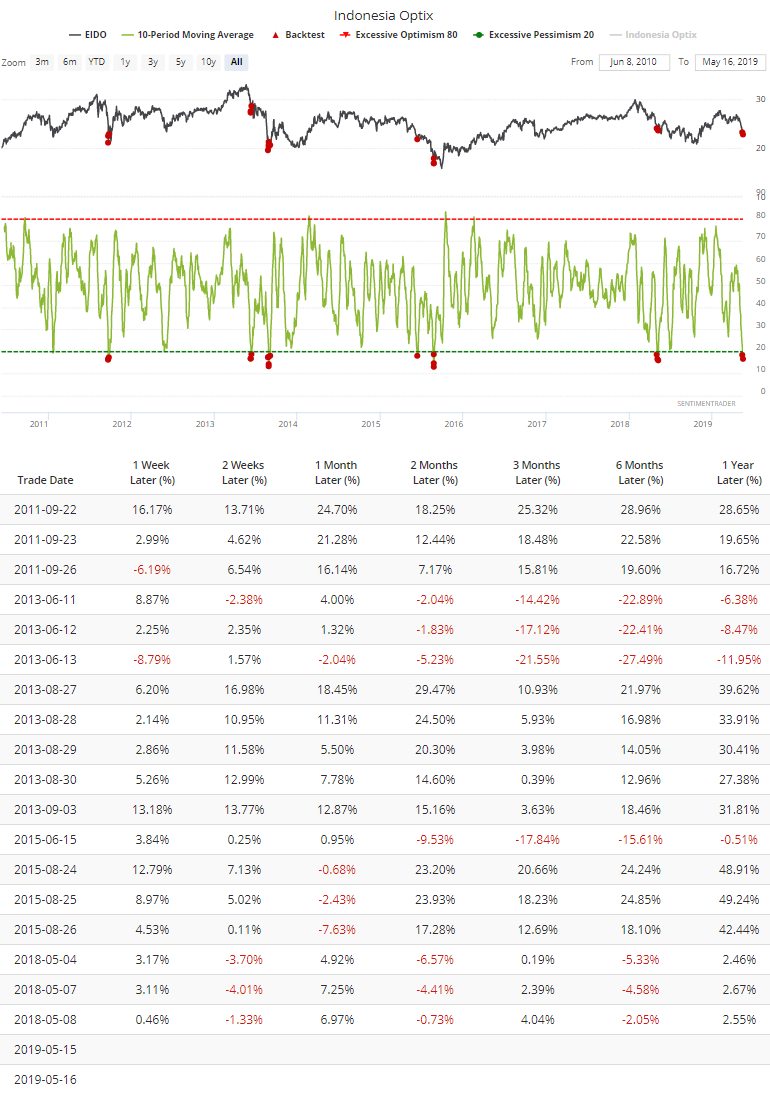
For EIDO, the 10-day average has slipped below 20, a level that has preceded a gain over the next 1 or 2 weeks each time it's triggered.
PAK only has about 4 years of history, so optimism this low over a two-week span has triggered only twice before, both in 2018.