Friday Color - Massive Flows, Dollar Trend, Stock/Bond Rally, Whiplash, Sector Highs

Here's what's piquing my interest as markets meander on a post-breakout summer Friday.
Sell Stocks, Buy Bonds
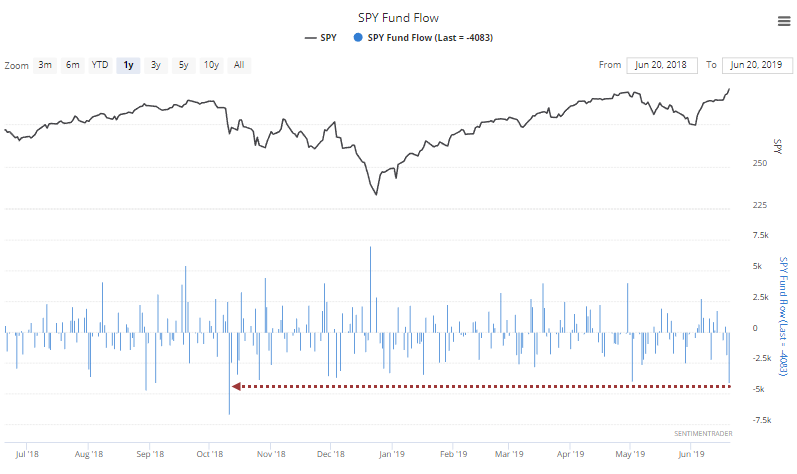
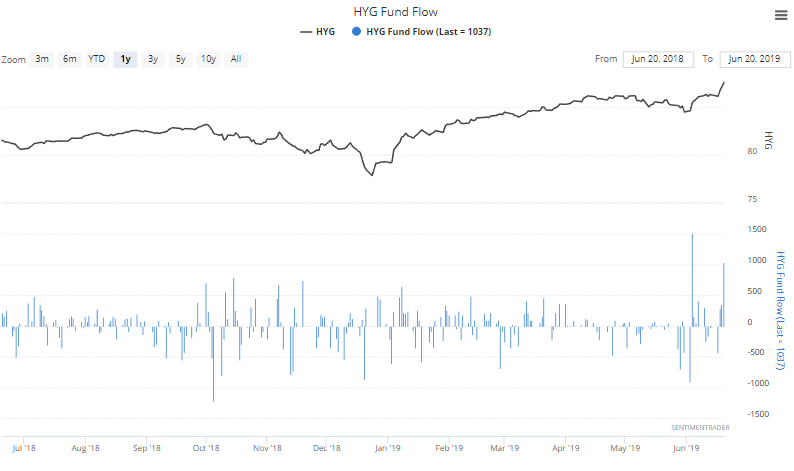
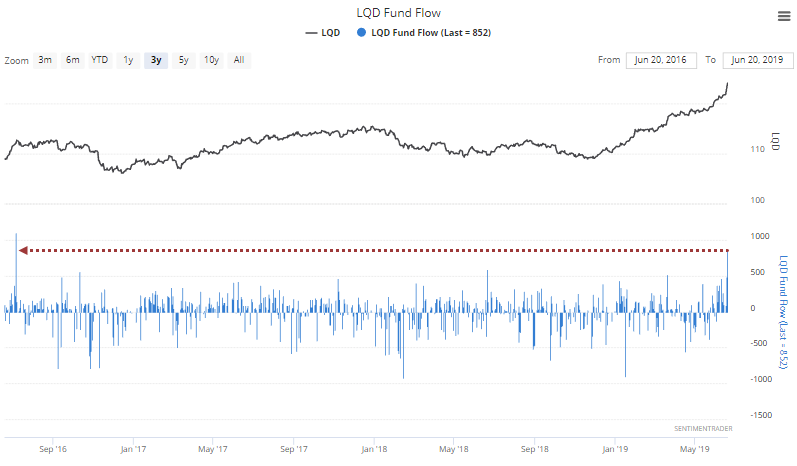
That seems to be the mantra among fund investors, anyway. On Thursday, SPY, HYG, and LQD all hit new highs. Yet investors pulled more than $4 billion from SPY, and added nearly $2 billion to the two bond funds.
For SPY, this was the largest outflow since last October.
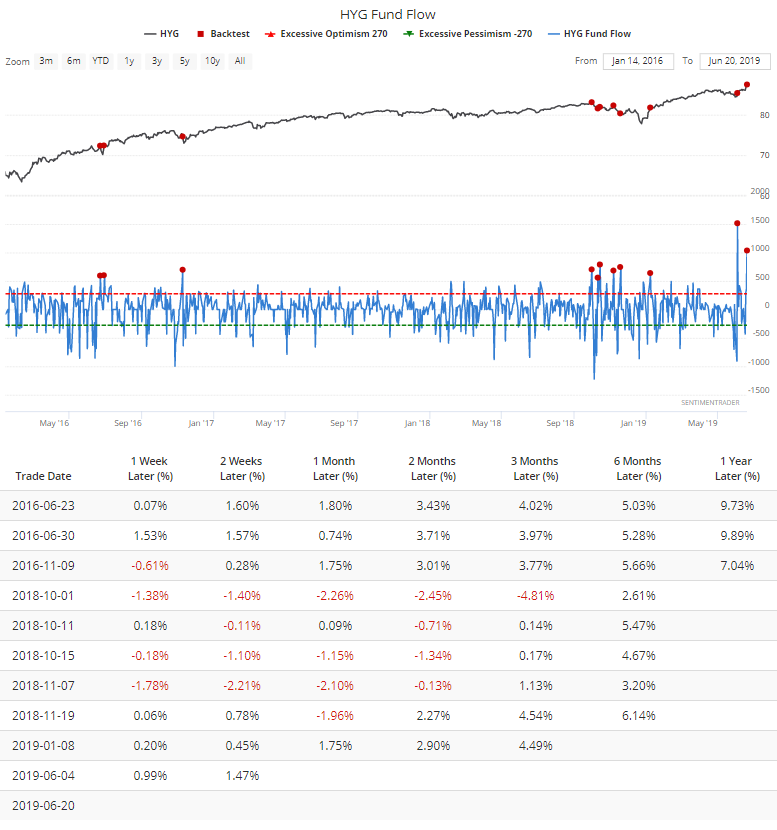
For HYG, it was the 2nd-largest inflow in history.
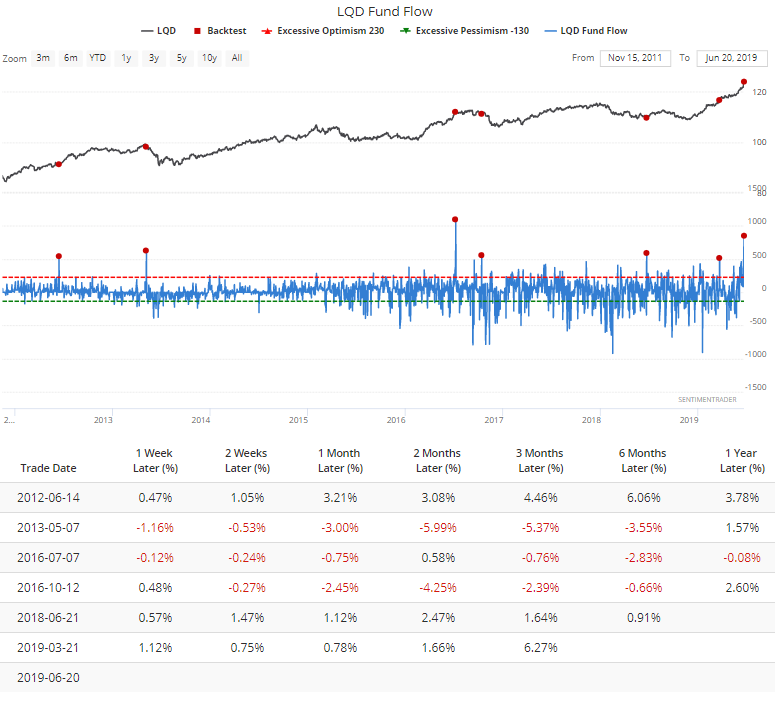
For LQD, it was the largest inflow in 3 years.
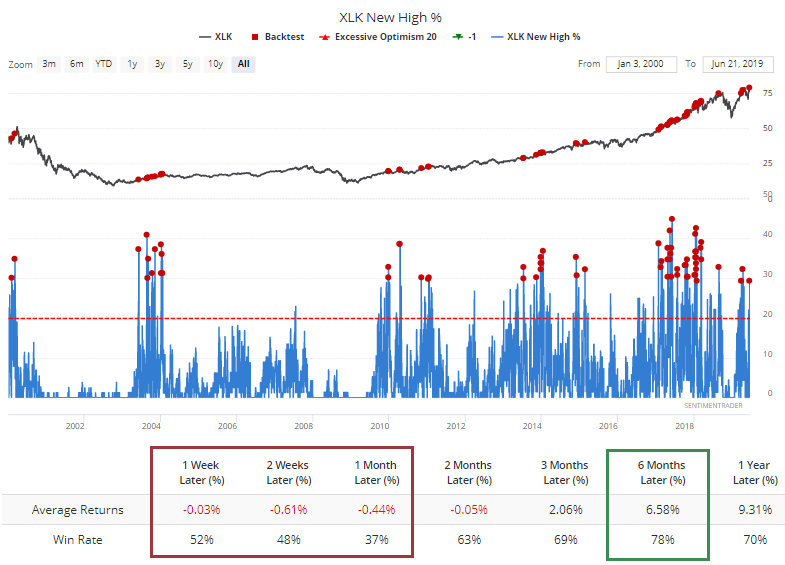
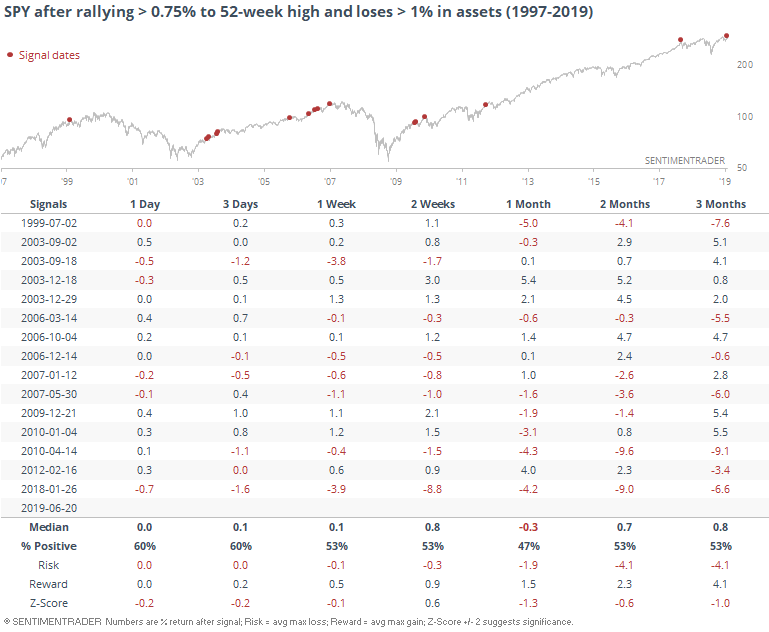
Fund flows can be a tricky beast, especially when looking at ETFs. This kind of behavior seems like it should be a good sign, but hasn't necessarily been in the past. Below we can see every time that SPY rallied at least 0.75% to a new high, yet ETF traders pulled at least 1% of assets from the fund.
For the bond funds, large inflows have been inconsistent predictors.
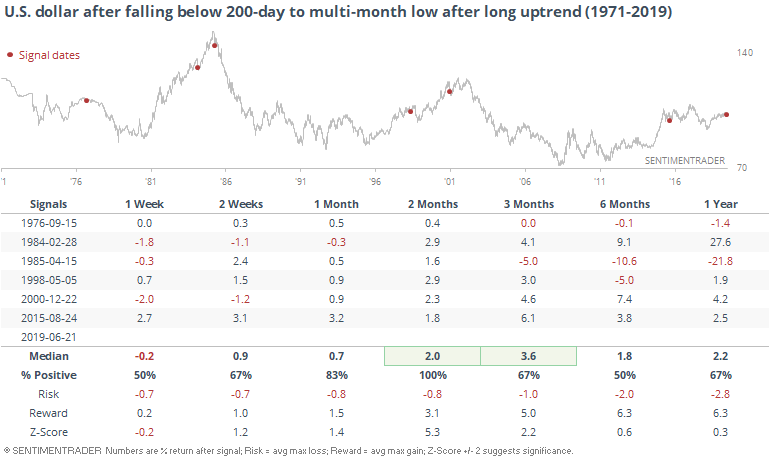
End Of Dollar's Trend
The dollar had been going gangbusters but has stumbled badly since the FOMC statement. It's now threatening to close at a multi-month low and today has violated its 200-day average, which has been rising for more than a year.
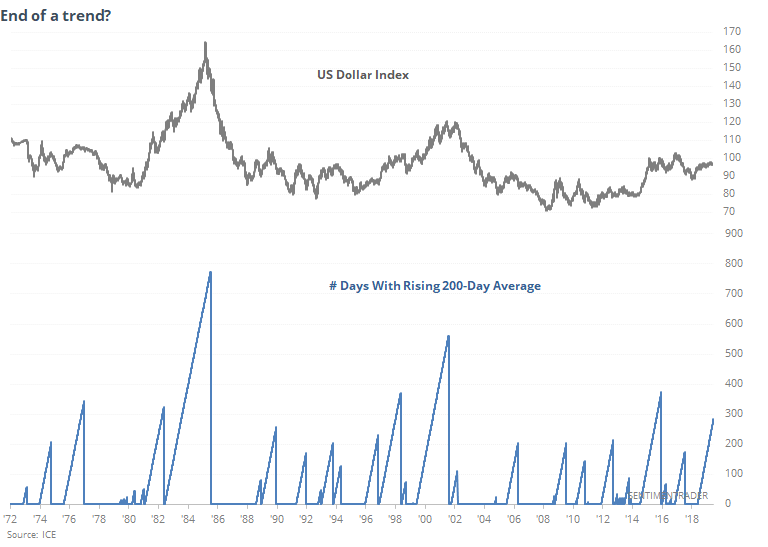
This kind of violation has triggered near the largest peaks since 1971, though it never coincided with the exact top. Of the 6 other times it's happened, the dollar resumed its rally over the next two months each time, before ultimately failing in three of the cases.
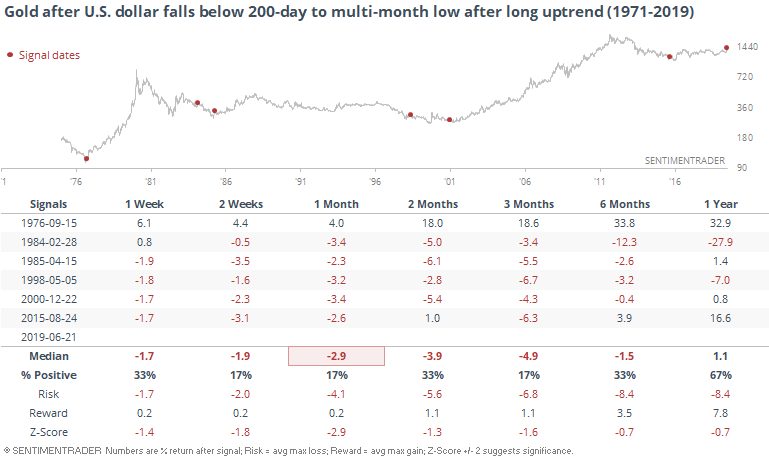
Because the dollar didn't tend to immediately decline, it was bad for assets that are helped by a falling dollar, especially gold.
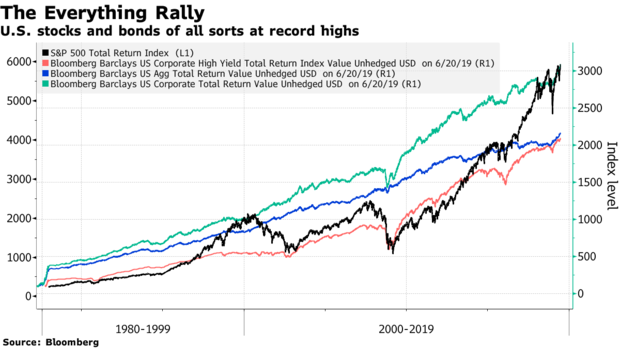
Everything's Rallying
Bloomberg notes that "everything" is on track for record closes, at least if we're looking at the stock and bond markets. The S&P 500 total return, and the total return of broad bond proxies, should all close the month at record highs.
After any month in which all the assets closed at record (monthly) highs, the S&P did very well going forward with only a single loss a year later.
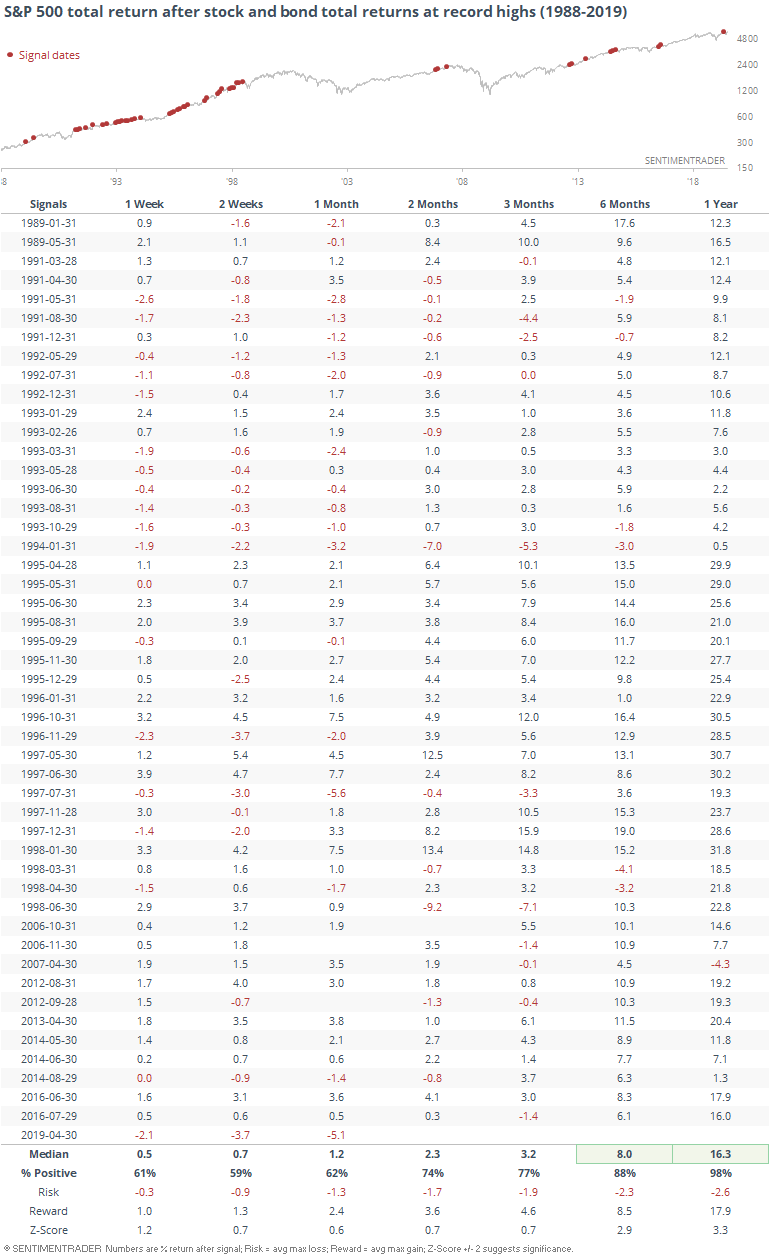
It was good for high-yield bonds, too.
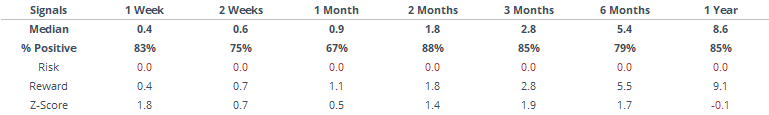
And investment-grade bonds.
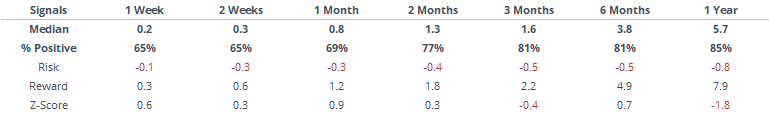
And the broader bond market (which includes Treasuries, etc.)
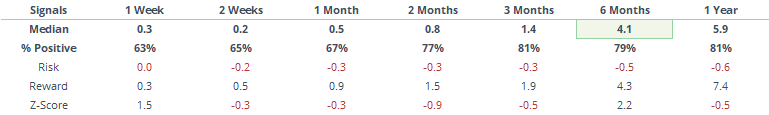
Overall, the biggest beneficiary seemed to be the stock market, with these all-clear signals leading to consistent and substantial upside.
Whiplash
Several times this year, we've looked at quick recoveries. There have been multiple times when an index suffered a pullback and then recovered in near-record time.
The S&P 500's jump to a fresh high yesterday wasn't a record, but it came close. It took only 12 days from the time it was sitting at a 50-day low and at least a 5% pullback to reach a new high.
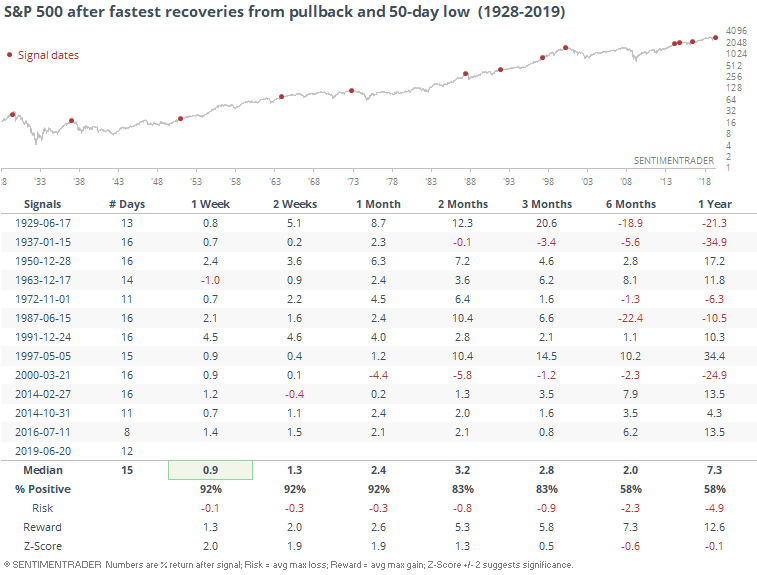
Similar about-faces have consistently led to further shorter-term gains. There was only a single loss up to a month later, then things got dicey. Five of these signals triggered near what ultimately proved to be major market peaks, something to keep in mind long-term.
Breadth Review
We should have expected a jump in breadth extremes yesterday, and we got them. Energy stocks flew higher thanks to a rebound in crude oil, and more than 40% of them popped above their volatility bands, even while XLE is still below its 200-day average. This has proved to be something of a hurdle for the sector.
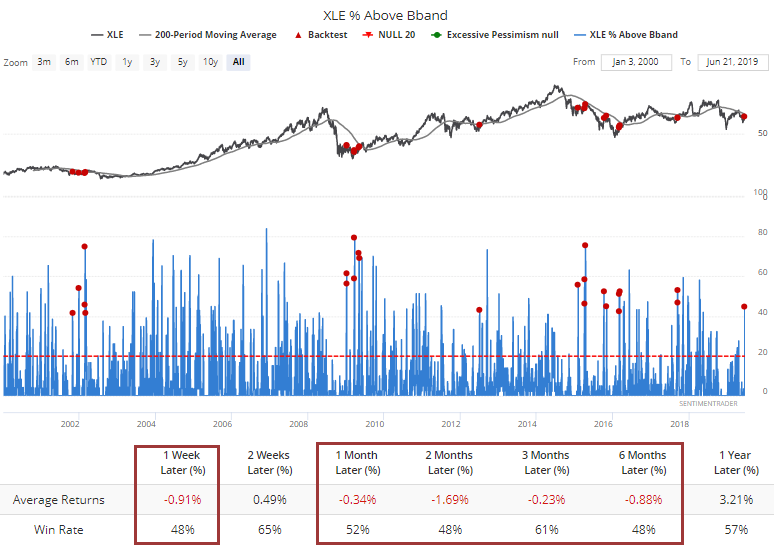
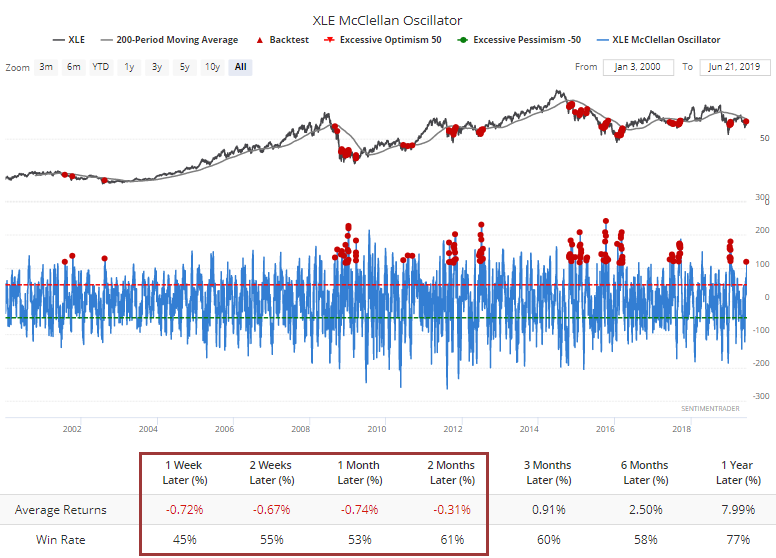
That helped pushed the McClellan Oscillator to nearly 120. Again, this has been a hurdle during downtrending markets.
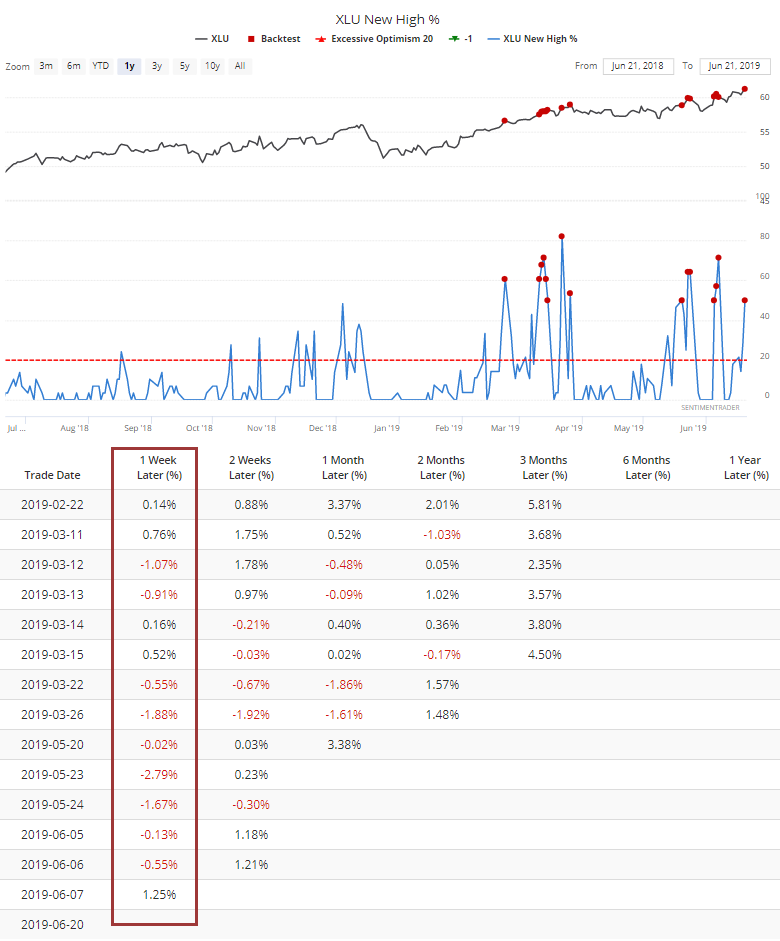
Utility stocks also got a boost, and half of them are back to new highs. Over the past 20 years, this has been a big negative, and even lately, when the sector has been doing very well, it has triggered some short-term pauses.
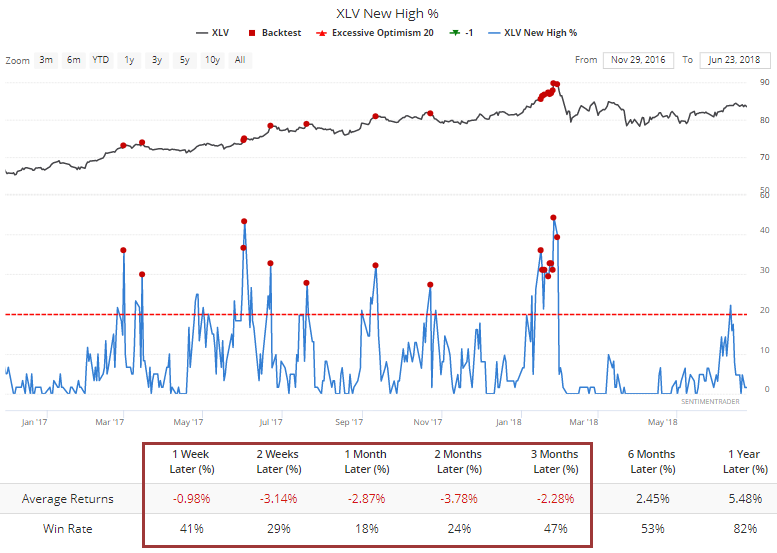
Another defensive sector, health care, also saw a surge in stocks at 52-week highs. That hasn't been particularly negative, just a little short-term weakness.
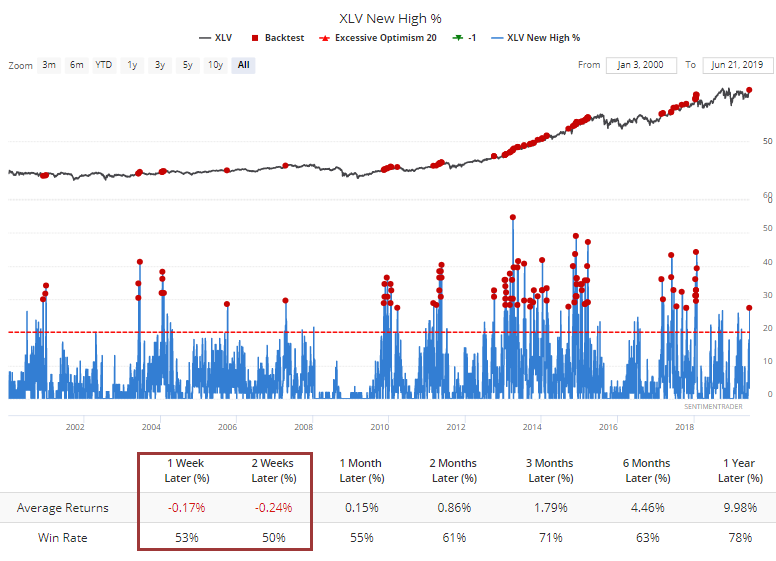
But in recent years, the sector has had a much more difficult time of it. Almost every time this many health care stocks hit a high together in 2017-18, the sector fell back over the next month.
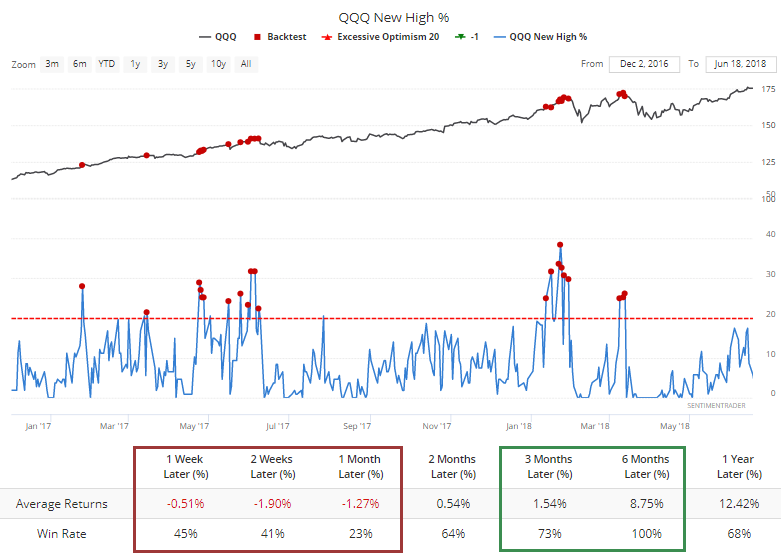
It wasn't just defensive sectors benefiting, though. More than 20% of the Nasdaq 100 jumped to new highs, too. Again, that's been a bit of a hurdle for the group during the next month.
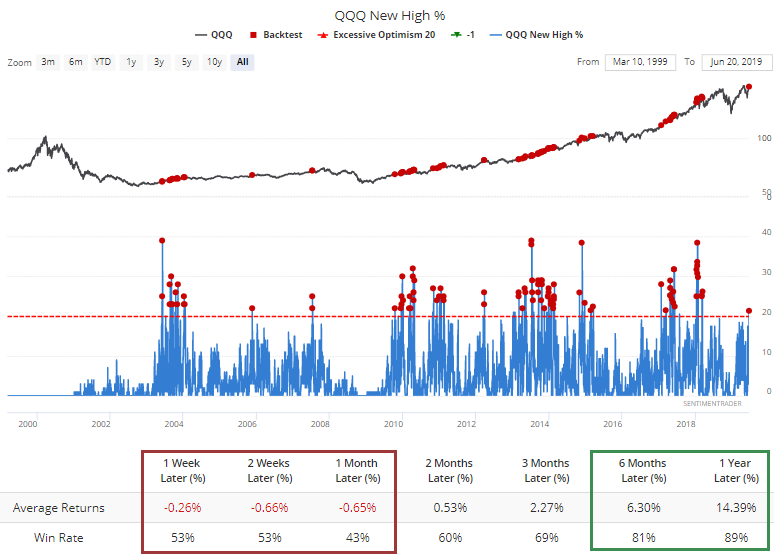
Especially in recent years.
The tech gains weren't just focused on the large tech stocks in the NDX, the broader tech sector also enjoyed gains, with nearly 30% of information technology stocks reaching a high on Thursday. Once again, this has been a weeks-long hurdle.