Friday Color - More Gaps, Peso, Outflows, Bond Binge

Here's what's piquing my interest on yet another big gap down day.
Gap Man
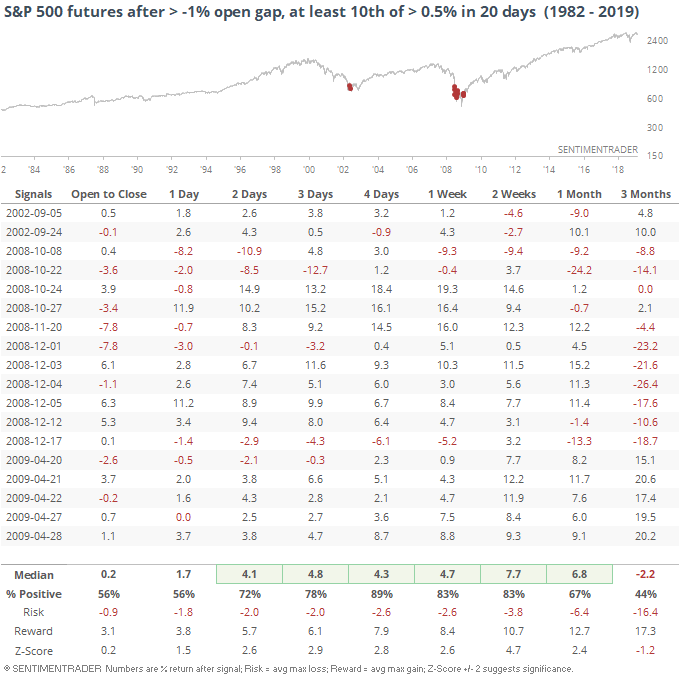
Another unexpected Tweet by the president pushed stocks lower immediately on Thursday and that anxiety has carried over into this morning. Stock futures are on track to gap down by more than 1%, the latest in a long string of poor openings that is nearing record territory.
It's remarkable that stocks have gapped down by more than 0.5% in half the sessions over the past month. Including today's (so far) loss of more than 1% at the open, this has only been seen during two other time periods. Both were at the peaks of bear market crises.
A bunch of those big down openings occurred after temporary bounces. This one is occurring when stocks are at a multi-month low already. That further narrows down any precedents.
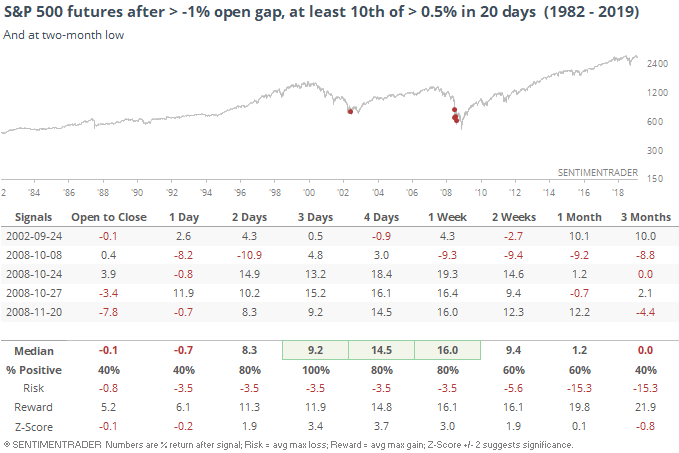
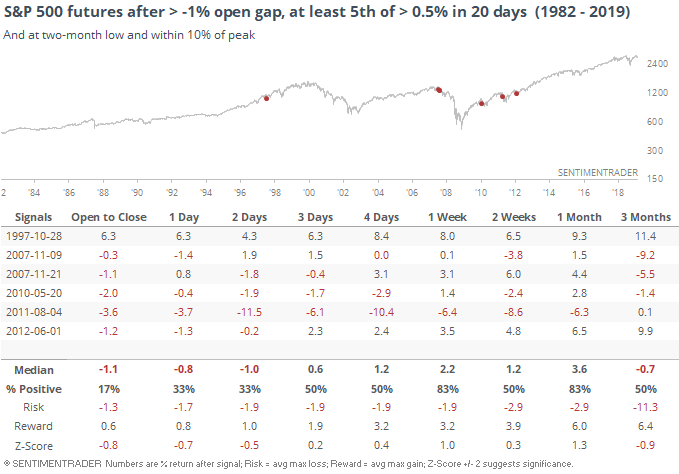
If we look for times when there were at least 5 big negative gaps but stocks were still within correction territory at the time, the very short-term still showed a mostly negative bias, but there was only one loss a week later.
We're dealing with a political wild card that investors haven't had to deal with in maybe forever, so who knows if historical behaviors are still valid. As much as they are, this kind of activity has previously led to some additional very short-term weakness, but a solid record of erasing the losses over the next 3-5 sessions.
Peso
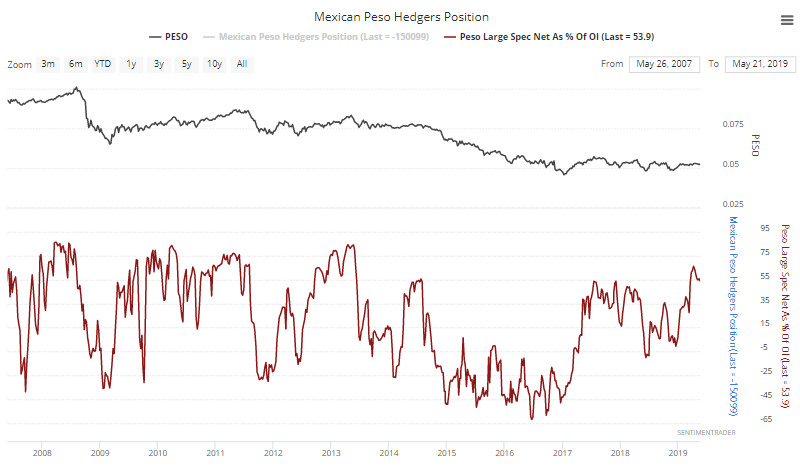
If the President is serious about the tariffs and the initial reaction in the peso isn't just a one-off knee-jerk move, there could be a lot more to come. Speculators were still holding more than 50% of open interest in peso futures net long.
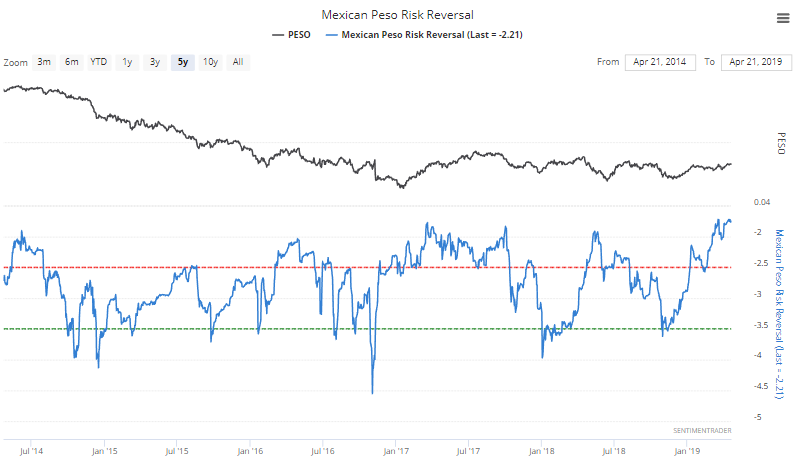
And the risk reversal - a gauge of option trader sentiment - is near the highest level in five years. Lots of room to unwind sentiment in this currency cross.
Flows
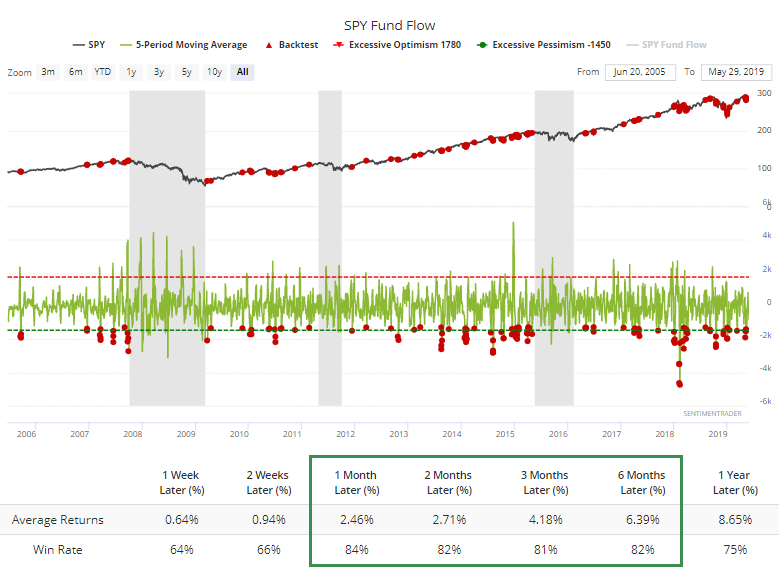
According to Lipper, investors pulled more than $20 billion from equity funds (mutual and ETF) in the last week. That's the most since December, and ranks among the most in 17 years.
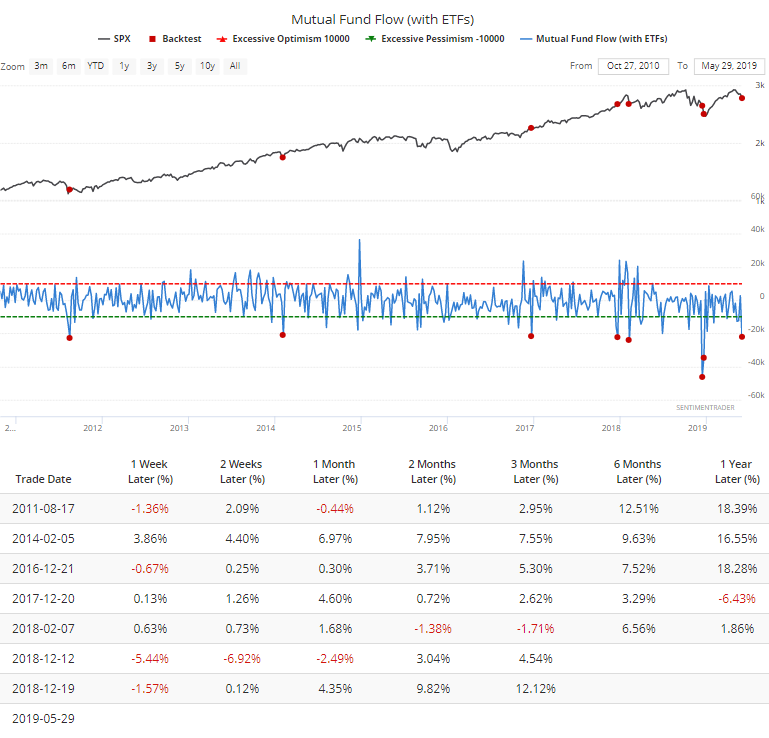
Less-extreme outflows, say of $15 billion or more, likewise tend to lead to rallies. Not a shocker given that all of these occurred during a long-term uptrend.
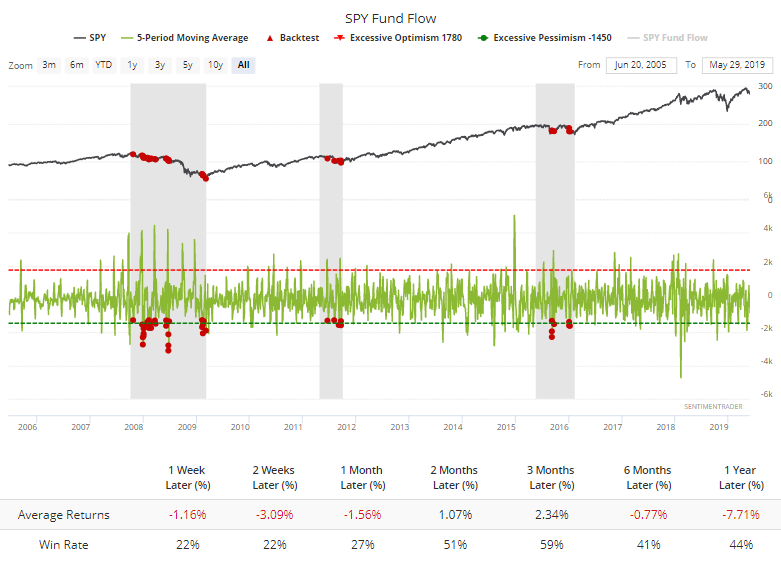
Some of that was due to the most important ETF in the world, SPY, which has bled an average of more than $1.25 billion per day for the past week. That's a lot when it was still in a bull market at the time.
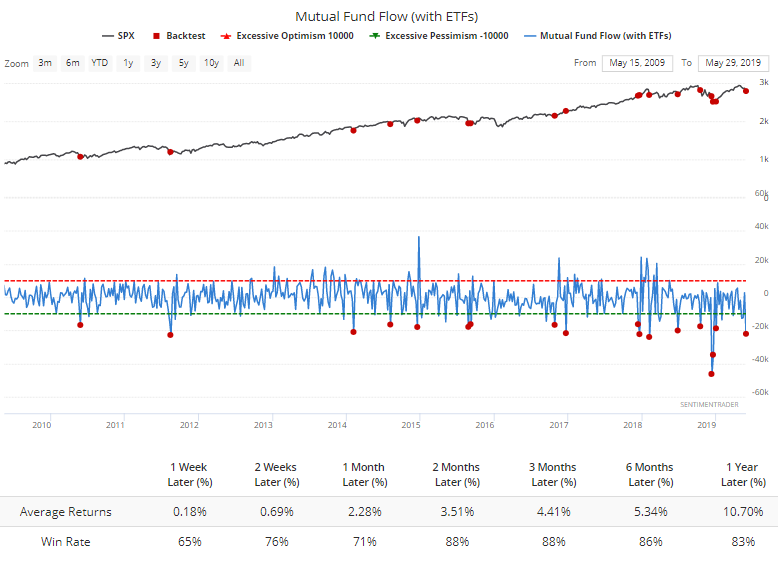
If we only look at bear markets, then future returns are of course weaker. But it's interesting that over the next 2-3 months, returns were still positive most of the time.
Bond Binge
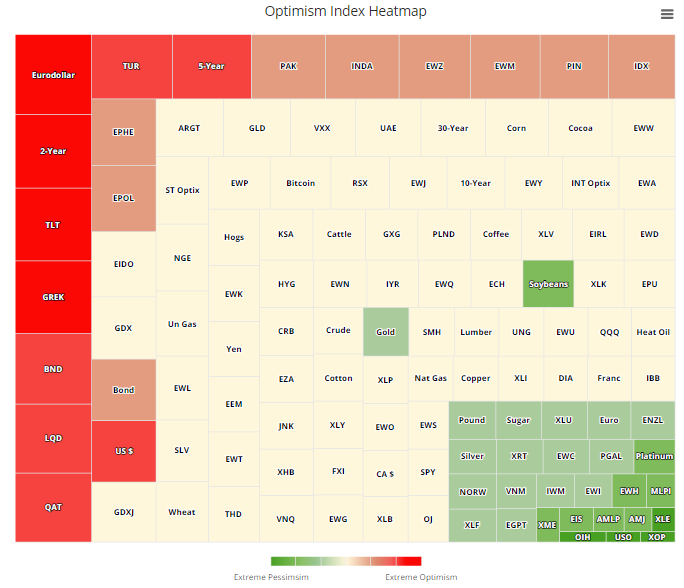
The Heatmap shows where sentiment is congregating, with the clear winners being bonds and losers being anything energy-related. Surprisingly, the moving averages of the energy funds aren't to a point we could consider extreme yet.
Even though nearly half of all energy stocks in the S&P 500 are now oversold according to the Relative Strength Index, it's still not enough to trigger a consistent signal that a rebound was likely on tap.
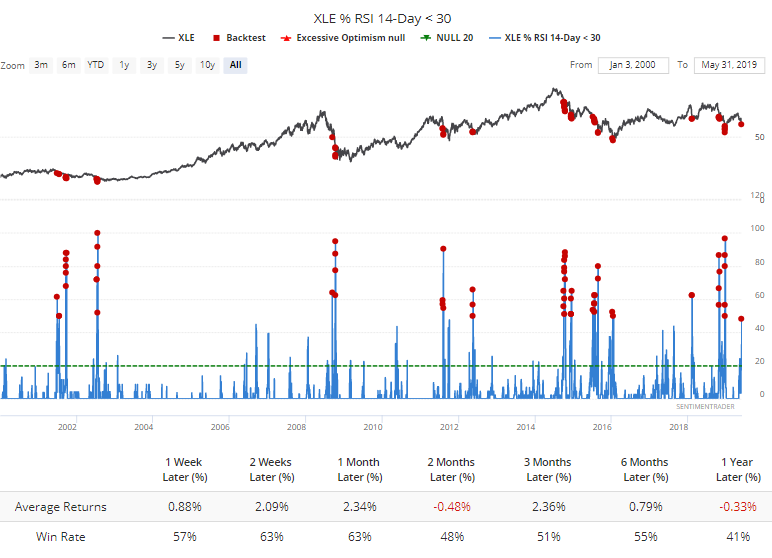
What to watch for? A reading above 75% or preferably 80% of stocks being oversold. That's not outside the realm of possibility if the sector keeps sliding in the days ahead.
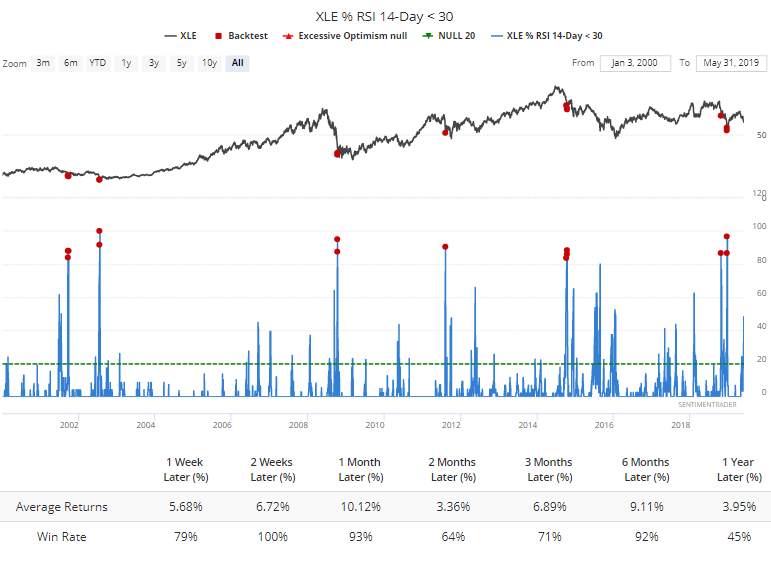
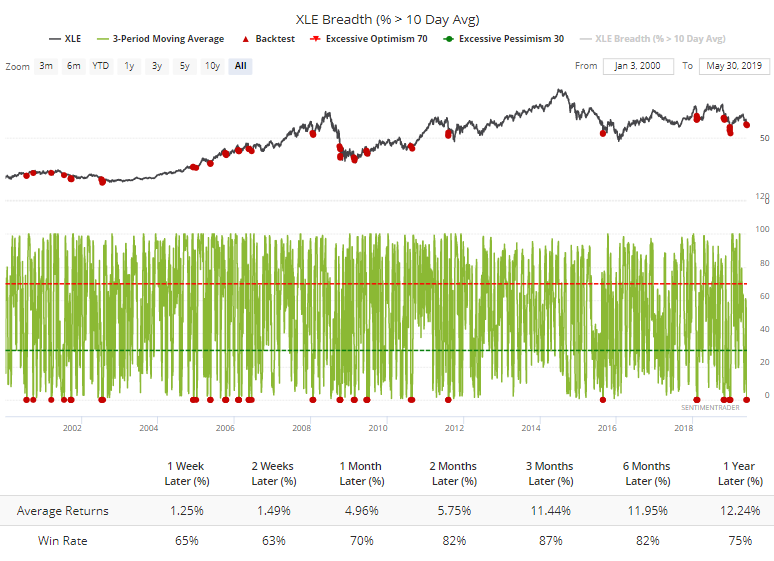
About the only measure that's suggesting a positive tilt for the sector right now is that over the past few days, every single energy stock has traded below their short-term 10-day moving average. That level of short-term selling pressure is pretty rare and consistently led to medium-term rebounds. Is it enough? Probably not.
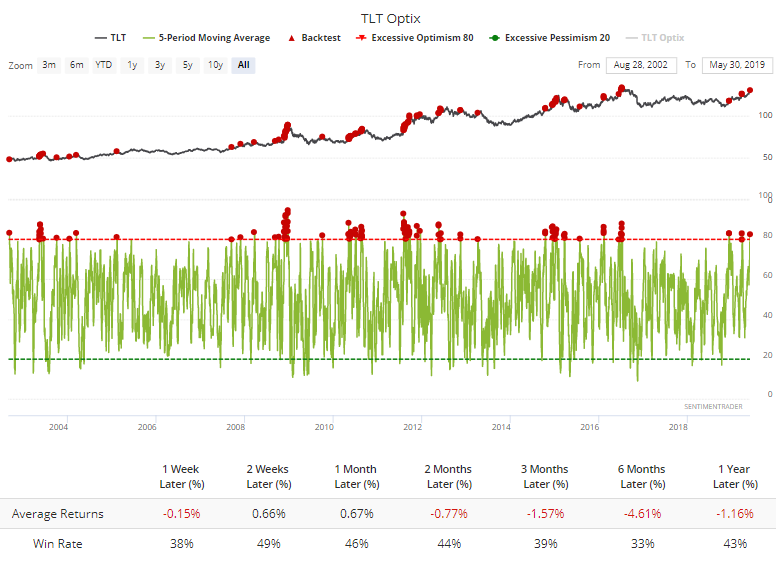
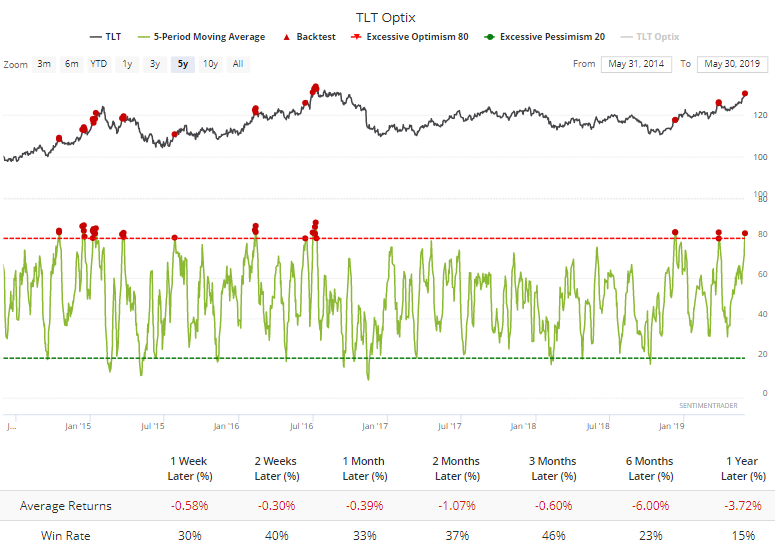
It's a different story for bonds. The rush to safety has pushed the 5-day Optimism Index above 80 on TLT. The fund has struggled to hold gains when it was this high.
Especially over the past 5 years.
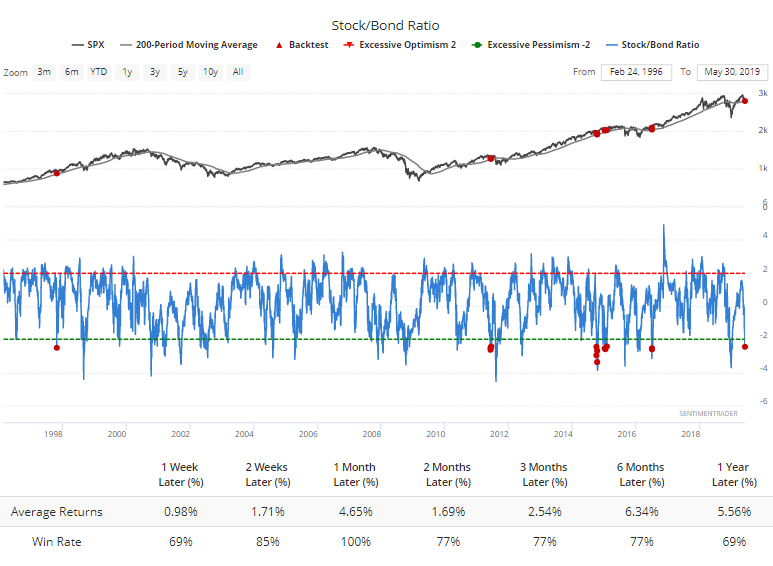
That rush into bonds has pushed the Stock/Bond Ratio even lower. Going back to 1962, there have only been a handful of times it got this stretched when the S&P had still held above its 200-day average at the time. The S&P snapped back over the next month each time.
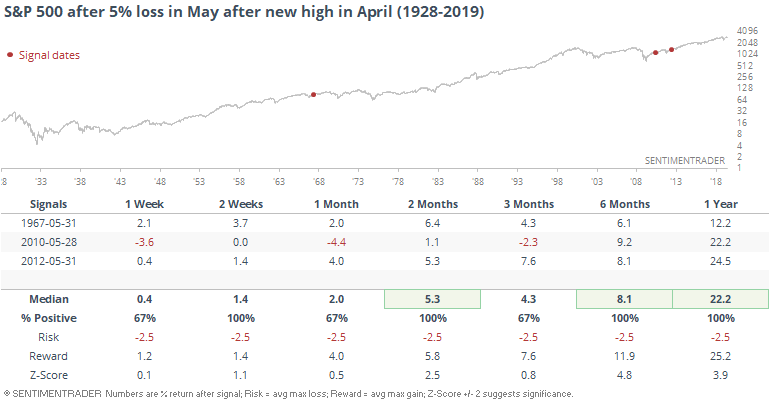
Sold In May
For those that headed the popular cliche about sell in May, it's hasn't been as rough a month as for most others. We looked before at 4% losses in May, but if that extends to 5%, we can see it hasn't happened in too many years. Mostly, stocks snapped back.
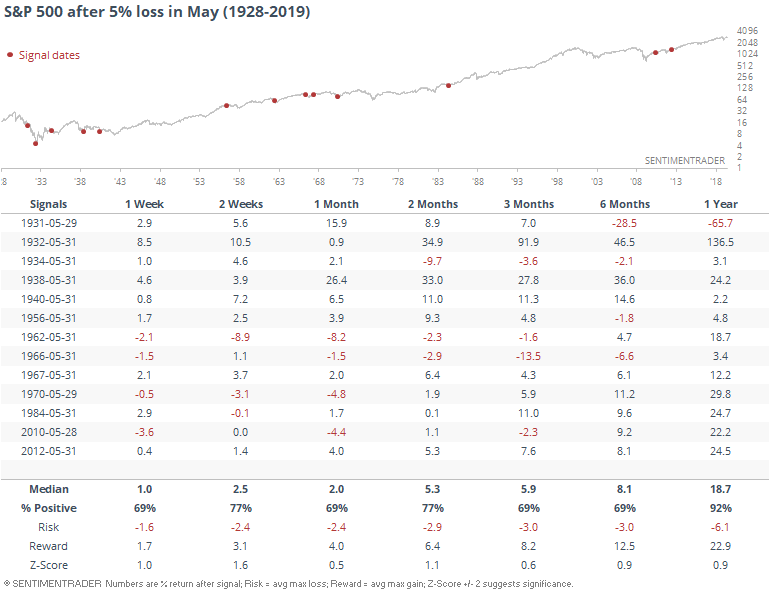
It's only happened twice when April had hit a 12-month high.