
Four sectors to be wary of in the short-term

Key points
- The stock market is showing terrific strength, so focusing heavily on unfavorable seasonals could be a mistake
- That said, several sectors are entering periods of historically significant and persistent weakness, so it's better to be forewarned
- Sometimes it can make sense to play the short side of a given sector, at other times (like this), it can make sense to tighten trailing stops, lighten up on, or altogether avoid a given sector during a period of typical seasonal weakness
Late September to mid-October is a stock market danger zone
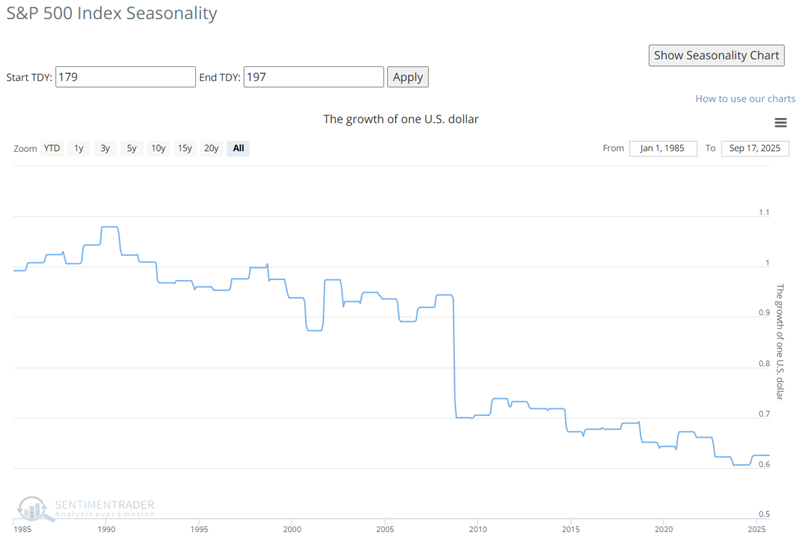
The stock market has been on a tear since bottoming in early April. The recent Fed rate cut appears so far to be adding fuel to the bullish fire. Interestingly, we are now heading into what is generally considered the weakest seasonal period of the year. The charts below show the Annual Seasonal Trend for the S&P 500 index and the hypothetical growth of $1 invested in the index only during this period. For 2025, this period extends from September 18th through October 14th.
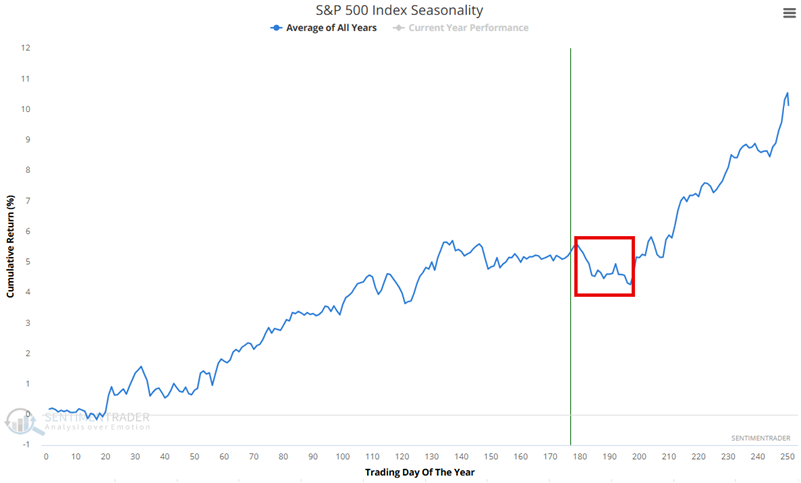
Despite the historical tendency for weakness during this period, it is always important to remember that seasonality is a secondary indicator, and performance can vary widely from year to year. Given the current market strength, the message at the moment is NOT to shout "SELL!" The real message is more like "Don't fall into the trap of getting too giddy and believing the market cannot turn down sharply and quickly."
With these crosscurrents in mind, let's highlight four sectors that are likely to show weakness if things reverse in the near term. Given the overall market strength, we are not recommending short positions in these sectors but merely a modicum of caution.
Investors with holdings in these sectors might consider quickly lightening up or tightening stops if signs of trouble appear.
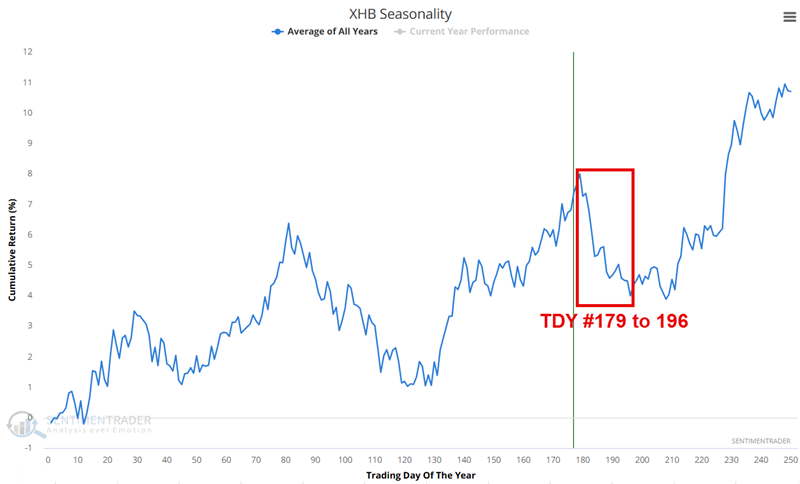
Sector #1: Homebuilder stocks
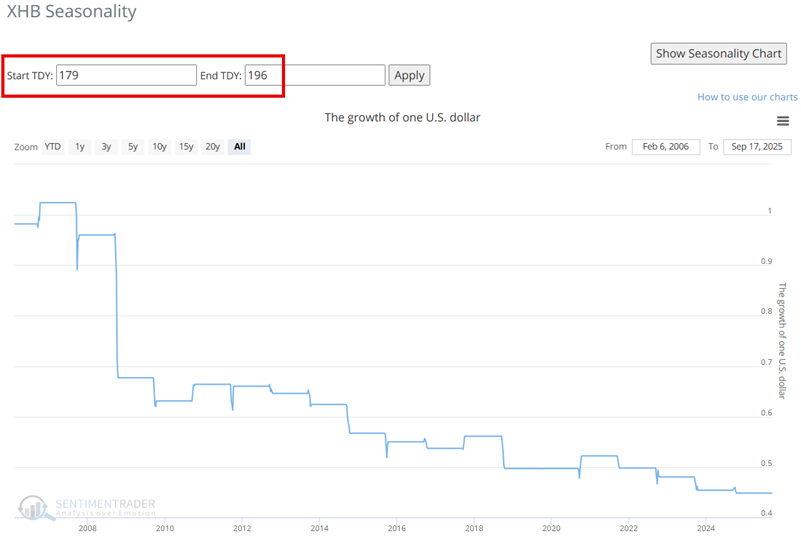
The Annual Seasonal Trend chart for the SPDR S&P Homebuilders ETF (XHB) is entering an unfavorable period that extends from Trading Day of the Year (TDY) #179 through TDY #196. For 2025, this period extends from September 18th through October 13th.
A hypothetical $ invested in XHB every year since 2006 has declined 55% to $0.45.
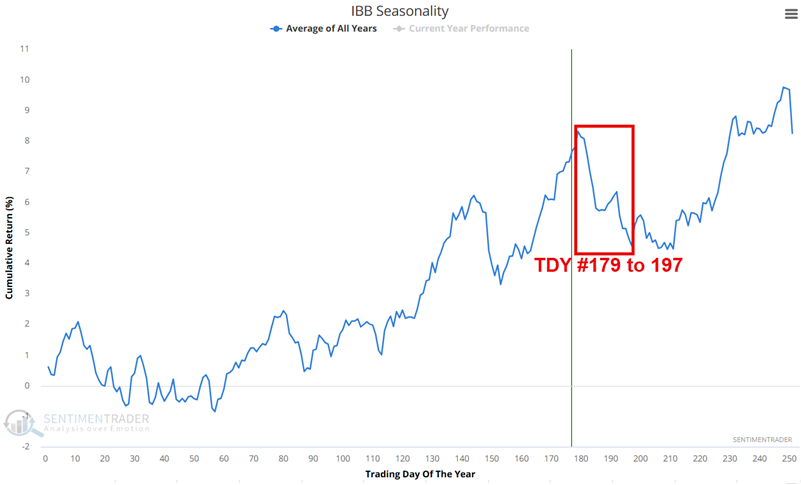
Sector #2: Biotechnology stocks
The Annual Seasonal Trend chart for the iShares Biotechnology ETF (IBB) is entering an unfavorable period that extends from Trading Day of the Year (TDY) #179 through TDY #197. For 2025, this period extends from September 18th through October 14th.
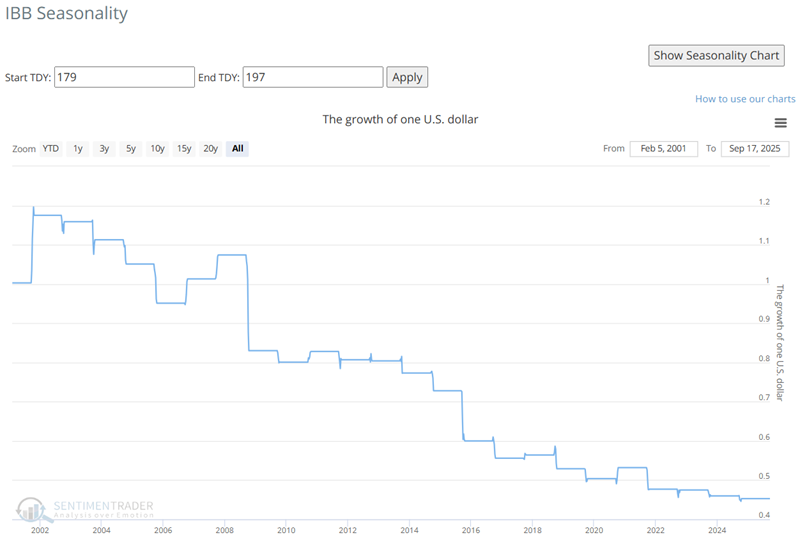
A hypothetical $ invested in IBB during this period, every year since 2001, has declined 55% to $0.45.
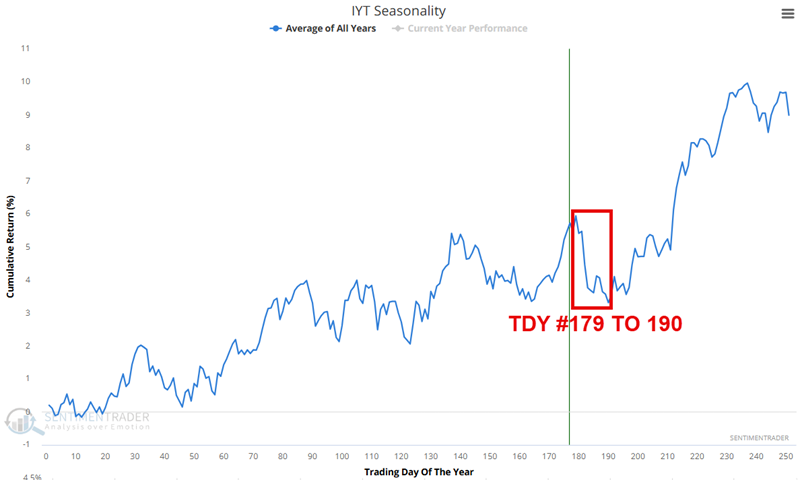
Sector #3: Transportation stocks
The Annual Seasonal Trend chart for the iShares Transportation Average ETF (IYT) is entering an unfavorable period that extends from Trading Day of the Year (TDY) #179 through TDY #190. For 2025, this period extends from September 18th through October 3rd.
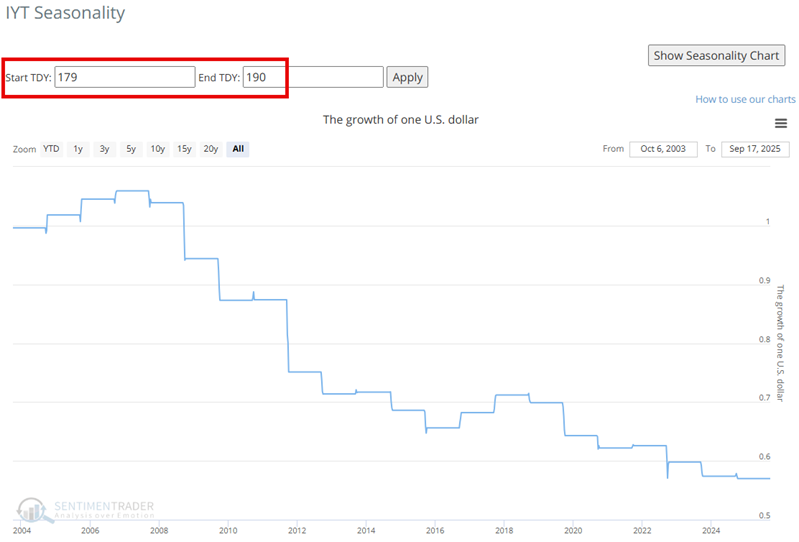
A hypothetical $ invested in IYT during this period, every year since 2004, has declined 43% to $0.57
Sector #4: Gold mining stocks
Gold mining stocks have been spectacular performers in 2025, with some miner ETFs up over 100%. It can be very dangerous to pick a top in the face of a rip-roaring bear market. Nevertheless, this sector is ripe for a pullback, and history suggests that the month ahead is a likely time for that to happen.
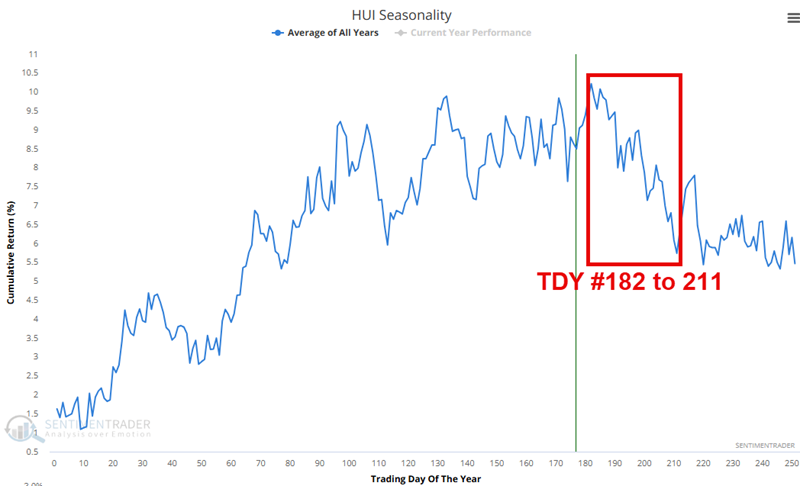
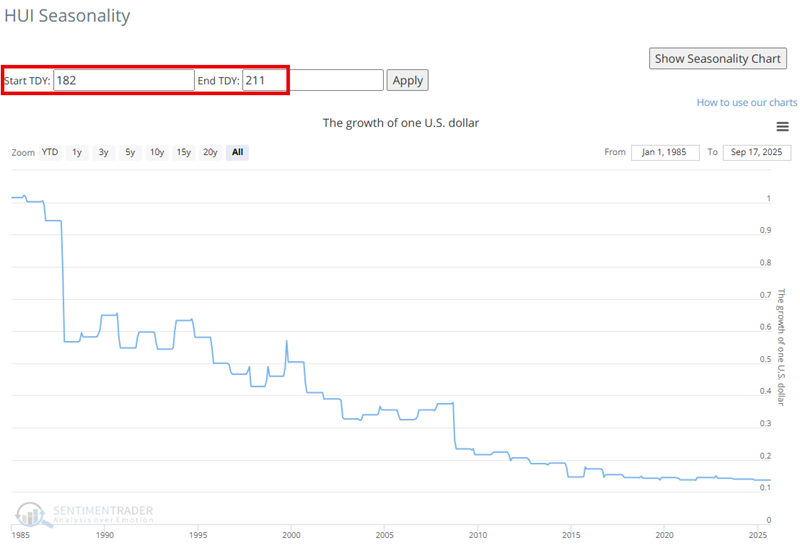
The Annual Seasonal Trend chart for the Gold Bugs Index (HUI) of gold-mining companies is entering an unfavorable period that extends from Trading Day of the Year (TDY) #182 through TDY #211. For 2025, this period extends from September 23rd through October 11th.
A hypothetical 1$ invested in HUI during this period every year since 1985 has declined 86% to $0.14.
What the research tells us…
Each highlighted sector has two things in common: They have shown exceptional strength recently and are now entering a period of typical seasonal weakness. It is dangerous to sell short something that is showing strength unless you are experienced at this type of trading. However, the message here is more about "profit-taking" (and/or allocating elsewhere) rather than short-selling.
The relevant question for investors is not, "Will these sectors decline in the month ahead?" The appropriate question is, "Given their history during this time of year, is this where I want to allocate capital right now?"
History suggests that investors can find better opportunities elsewhere in the month ahead.