
Four sectors to be wary of

Key points
- There are no sure things in the stock market
- That said, when price trends and seasonal trends align, there is often a great opportunity or at least a warning to stand aside
- Four sectors set up for potential trouble in the months ahead are materials, Argentinian stocks, gold stocks, and regional banks
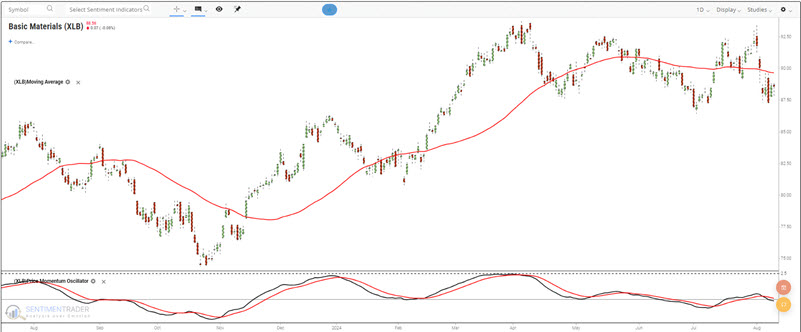
Sector 1: Basic Materials
The SPDR S&P 500 Materials ETF (ticker XLB) has been moving sideways since March. In the chart below, we see price action currently below the 50-day moving average and a recent negative crossover in the Price Momentum Oscillator
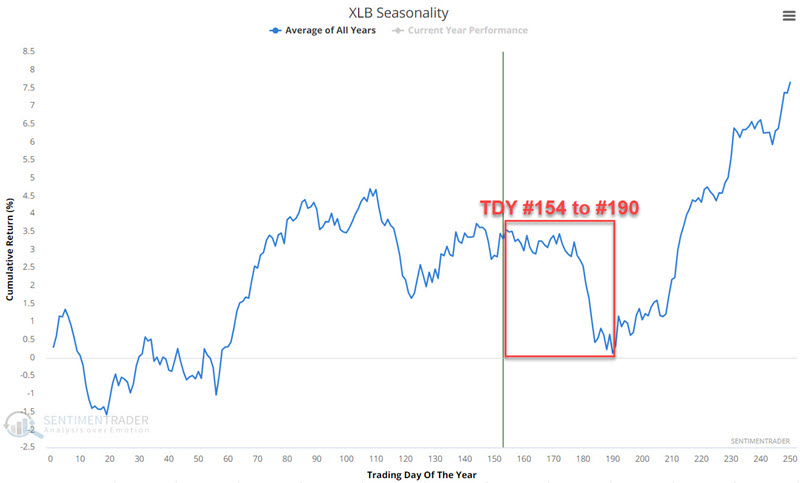
Does this portend a further decline? Not necessarily. Price action could quickly bounce higher. However, in the annual seasonal chart for XLB below, we see a sector about to enter an unfavorable seasonal period from Trading Day of the Year #154 through #190. For 2024, this period extends from 2024-08-12 through 2024-10-02.
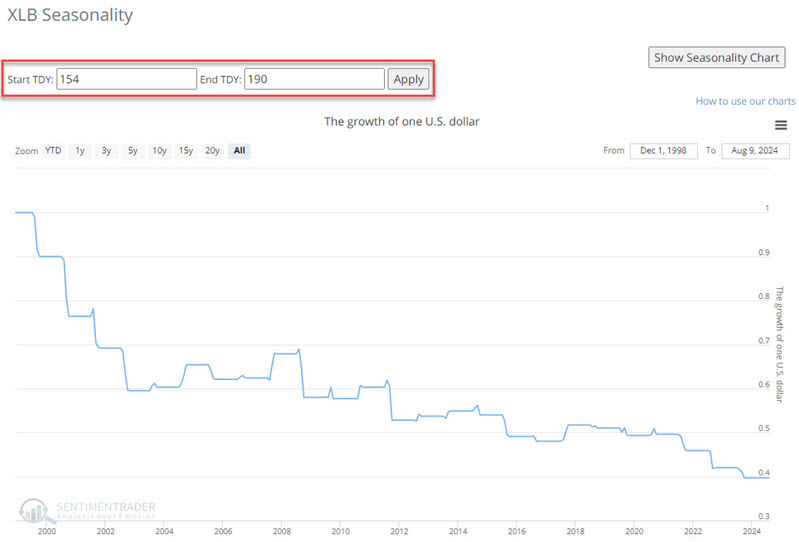
The chart below displays the hypothetical growth of $1 invested in ticker XLB only during this period every year since 1999. XLB has lost ground 64% of the time, with a cumulative decline of -60%.
Does this mean XLB is doomed to decline between now and early October? Not at all. The real question for investors is, "Is this a good place to allocate capital right now?" The same question applies to each of the following sectors. The objective here is not to play the short side of these sectors heavily but to consider investing capital elsewhere in better opportunities.
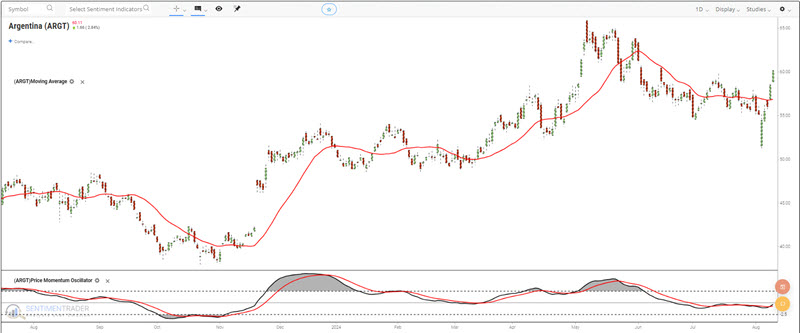
Sector 2: Argentina
From a March 2020 low to the May 2024 high, the Global X MSCI Argentina ETF (ticker ARGT) soared over 366%. The index ETF then pulled back over 22% before bouncing sharply in the past week.
Is this country ETF off to the races once again? Anything is possible. However, in the annual seasonal chart for ARGT below, we see a sector about to enter an unfavorable seasonal period from Trading Day of the Year #153 through #188. For 2024, this period extends from 2024-08-09 through 2024-09-30.
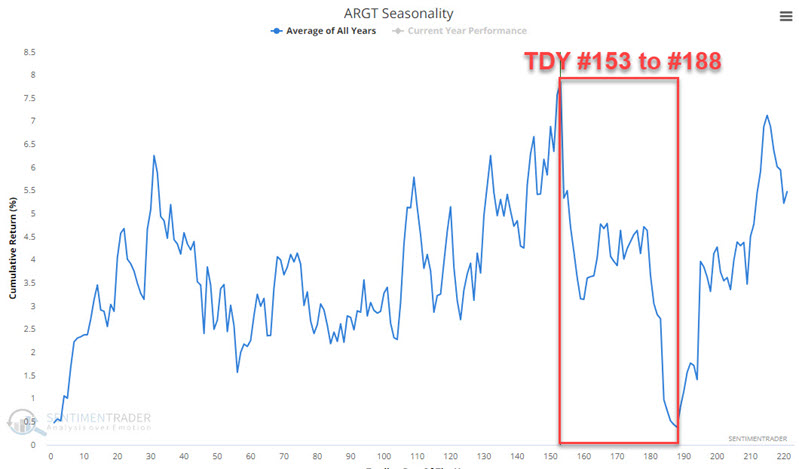
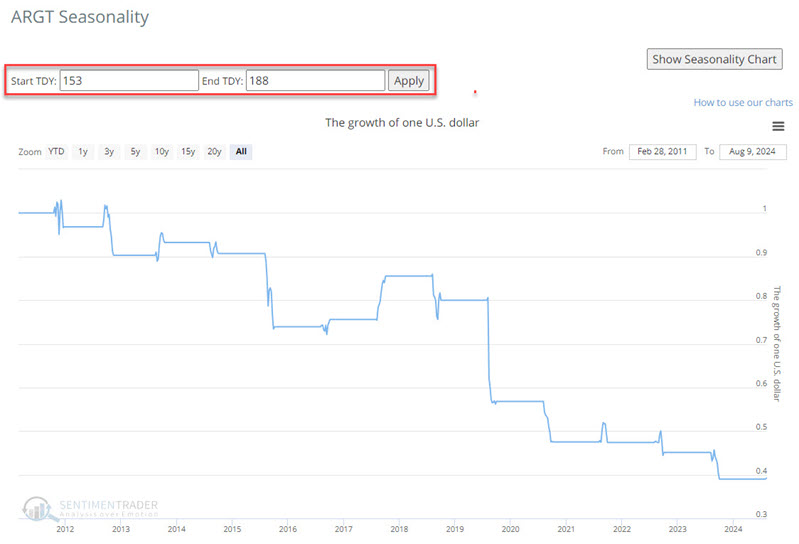
The chart below displays the hypothetical growth of $1 invested in ticker ARGT only during this period every year since 2012. ARGT has lost ground during this period in 10 of 13 years, i.e., 77% of the time) with a cumulative decline of -61%.
Sector 3: Gold stocks
One school of thought argues that gold mining stocks will soon shoot higher to catch up with the performance of gold bullion itself. And that is certainly a possibility - especially the longer gold remains a strong performer. But there are valid reasons to remain wary of gold stocks.
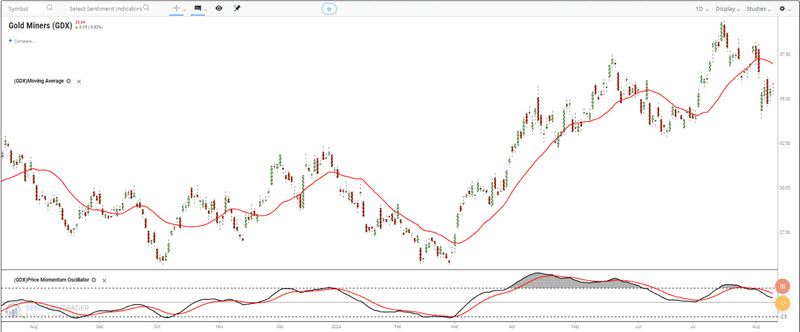
Since this article was published (warning of potential tough sledding for gold miners), ticker GDX has fallen -8.7%. The chart below reveals that the VanEck Gold Miners ETF (ticker GDX) recently dropped below its 50-day moving average, accompanied by a recent negative crossover in the Price Momentum Oscillator.
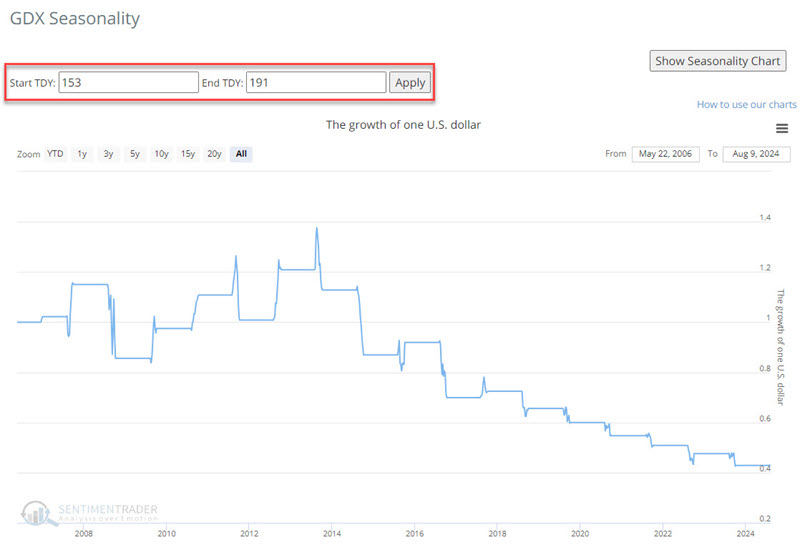
To make matters more concerning, in the annual seasonal chart for GDX below, we see a sector about to enter an unfavorable seasonal period from Trading Day of the Year #153 through #191. For 2024, this period extends from 2024-08-09 through 2024-10-03.
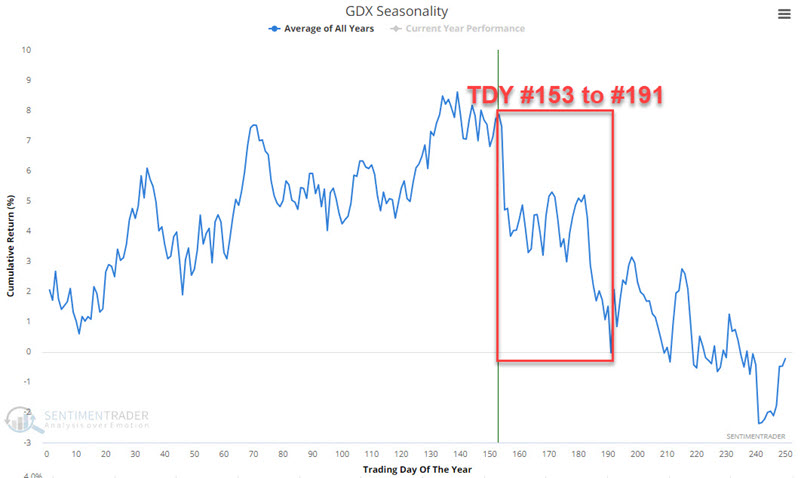
The chart below displays the hypothetical growth of $1 invested in ticker GDX only during this period every year since 2012. GDX has lost ground during this period in 10 of 15 years, i.e., 67% of the time) with a cumulative decline of -57%.
Sector 4: Regional Banks
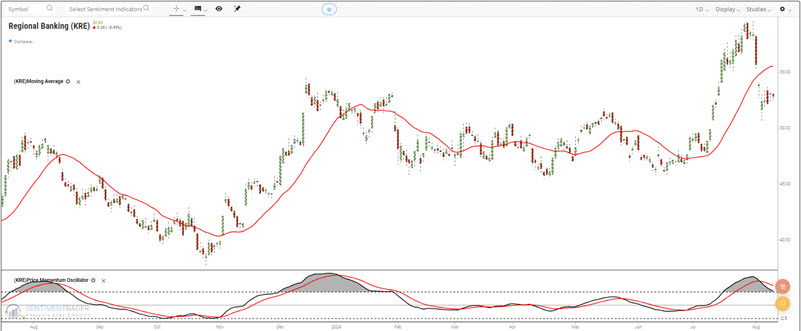
The regional bank sector enjoyed a nice rally from early June into late July. Last week, however, it took a nasty spill, and unlike many other sectors, it did not get much of a bounce by week's end. The chart below shows the SPDR S&P Regional Banking ETF (ticker KRE) back below its 50-day moving average with a negative crossover in the Price Momentum Oscillator.
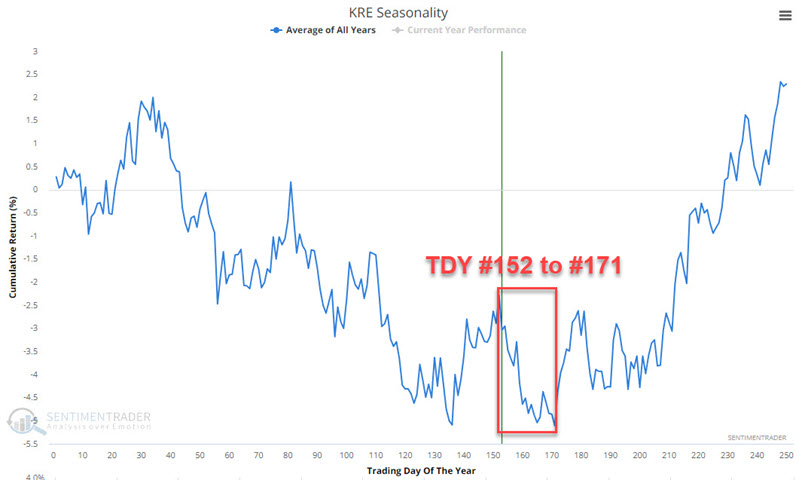
The chart below shows that KRE has entered a brief unfavorable seasonal period from Trading Day of the Year #152 through #171. For 2024, this period extends from 2024-08-08 through 2024-09-05.
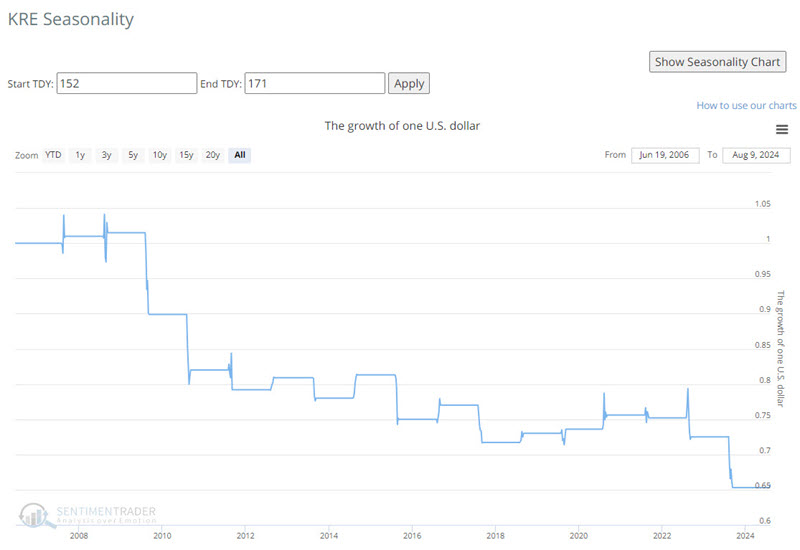
The chart below displays the hypothetical growth of $1 invested in ticker KRE only during this period every year since 2012. KRE has lost ground during this period in 9 of 17 years, i.e., 53% of the time) with a cumulative decline of -35%.
The regional banking sector has tended to be more of a coin flip regarding this late summer or early fall than the abovementioned sectors. Nevertheless, the overall result is pretty uninspiring for investors looking for the best opportunities.
What the research tells us…
It is always worth remembering that annual seasonal trend charts are merely an average of what has happened in the past and not a roadmap of what will happen in the future. Still, we have seen instances time and again when an alignment of price trend and seasonal trend in the same direction creates either a solid trading opportunity - or, at the very least, a valuable warning to look elsewhere. The sectors detailed above appear to fit into the former category presently.