
Four market with potential seasonal tailwinds

Key points:
- Seasonal trends should not be thought of as "buy" or "sell" signals
- Seasonal trends should be thought of as "clues" that tell us "When to look where" for potential opportunities
- With that understanding in mind, traders might consider looking more closely at Gold, Natural Gas, Wheat, and the Japanese Yen, or their ETF counterparts
Gold enters its best seasonal period
Gold enjoyed a massive run-up from March 2024 into the first quarter of 2026. Since then, the shiny metal has pulled back almost 25% from its highs. Could another upleg be in the offing? We can't predict, however, the Annual Seasonal Trend chart for Gold suggests the potential for a bullish bias for the next several months. The chart below highlights the period from Trading Day of the Year (TDY) #134 through TDY #207. For 2026, this period extends from July 9th through October 21st.
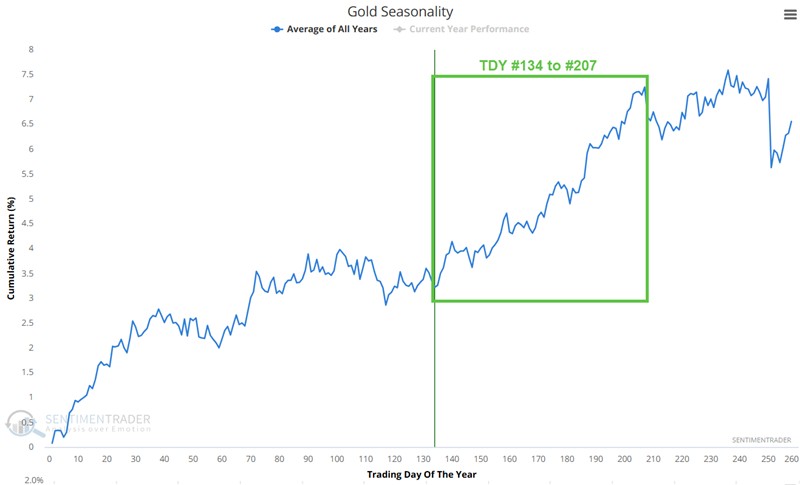
The chart below displays the hypothetical growth of $1 achieved by holding a long position in Gold only during this period every year since 1985, based on percentage price changes. The cumulative price gain during this period is 154%.