
Four commodity-related setups for aggressive, counter-trend traders to consider

Key points
- Seasonality is generally best used as a secondary indicator. Likewise, the best opportunities tend to occur when price action and seasonality are in agreement
- That said, there are occasions when taking a counter-trend position can pay off
- Four commodities (Canadian Dollar, Soybeans, Natural Gas, and Sugar) are entering periods of historically persistent seasonal tendencies
Commodity #1: Seasonality suggests weakness for the Canadian Dollar
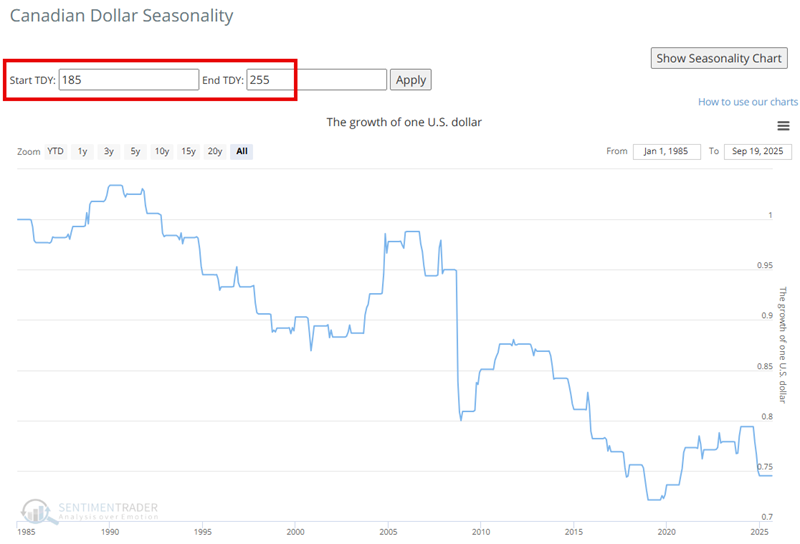
The Annual Seasonal Trend chart for the Canadian Dollar recently entered an unfavorable period that extends from Trading Day of the Year (TDY) #185 through the end of the year. For 2025, this period extends from September 16th through December 31st.
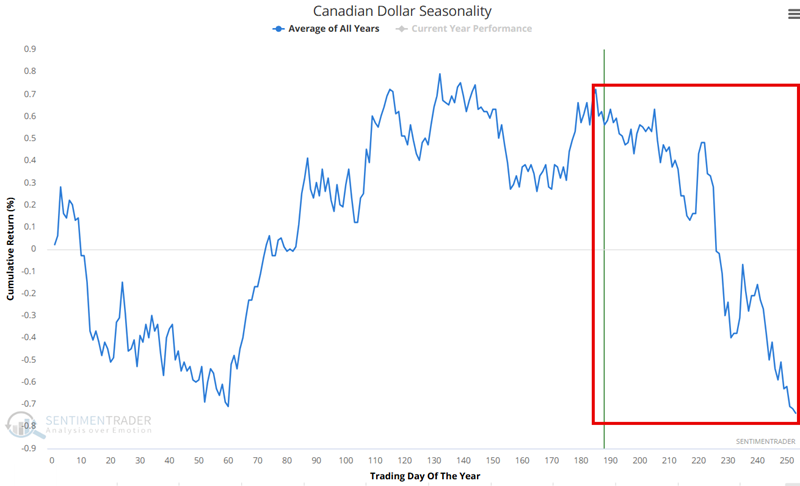
The Canadian Dollar has lost 25% during this period since 1985.
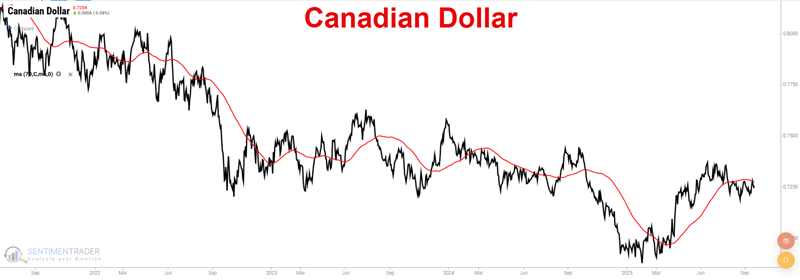
Currently, the Canadian Dollar is trading below its 70-day exponential average. Will this recent downturn become the severe downtrend suggested by the abovementioned seasonal pattern? I can't predict. But that is the way to play for aggressive, short-term swing traders.
Commodity #2: Seasonality suggests weakness for Soybeans
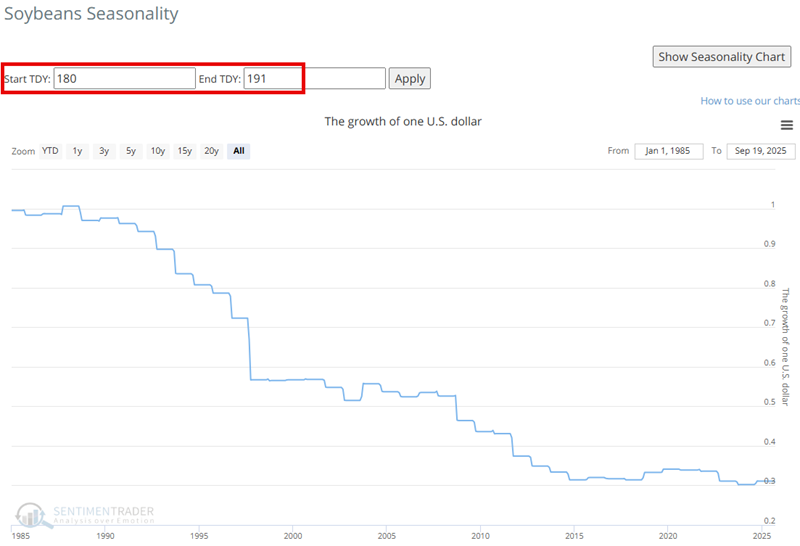
The Annual Seasonal Trend chart for the Soybeans is entering one of its worst historical periods of the year, extending from Trading Day of the Year (TDY) #180 through #191. For 2025, this period extends from September 19th through October 6th.
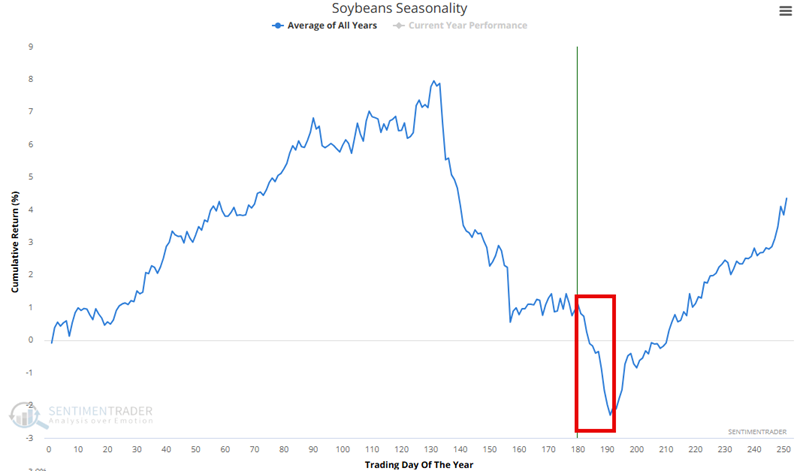
The hypothetical equity curve below clearly shows the persistence of seasonal weakness during this period. Soybeans have lost 69% during this period since 1985.
Regarding designating a trend, traders can see whatever they want in the price chart below. Some will see a market mired in a long-term downtrend, while others will see a market trending sideways and potentially building a base over the last year.
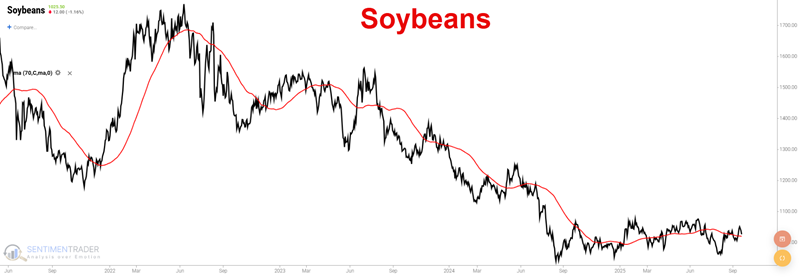
Regardless, the above-mentioned seasonal pattern suggests looking for an opportunity to play the short side in the near term.
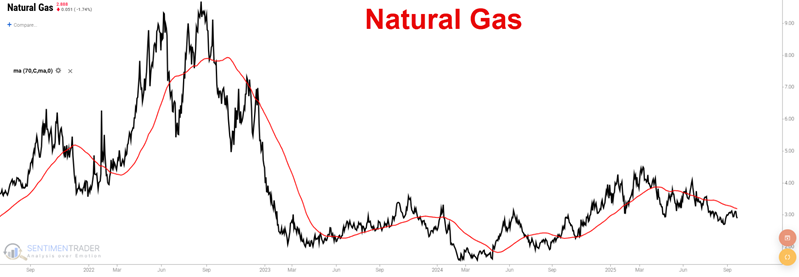
Commodity #3: Seasonality suggests strength for Natural Gas
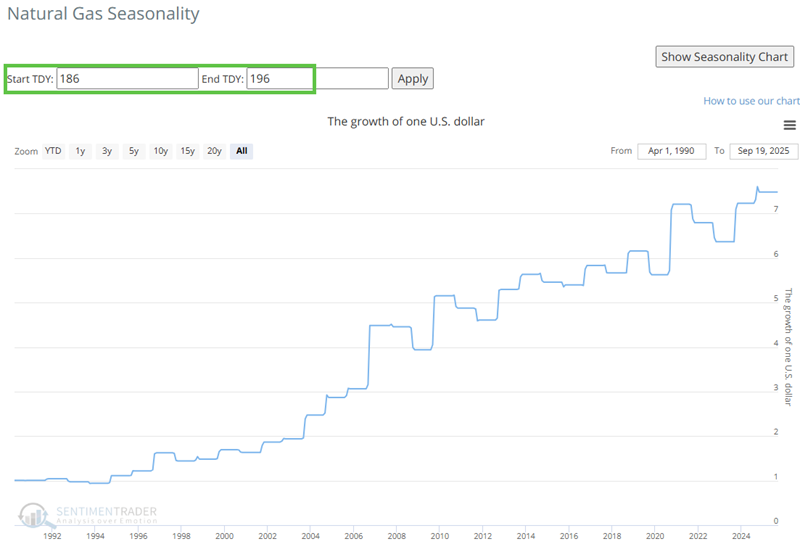
Due to its abundance, Natural Gas has been in a bear market for years. Nevertheless, aggressive short-term traders might note that the Annual Seasonal Trend chart for Natural Gas is entering a favorable period, extending from Trading Day of the Year (TDY) #186 through #196. For 2025, this period extends from September 19th through October 3rd.
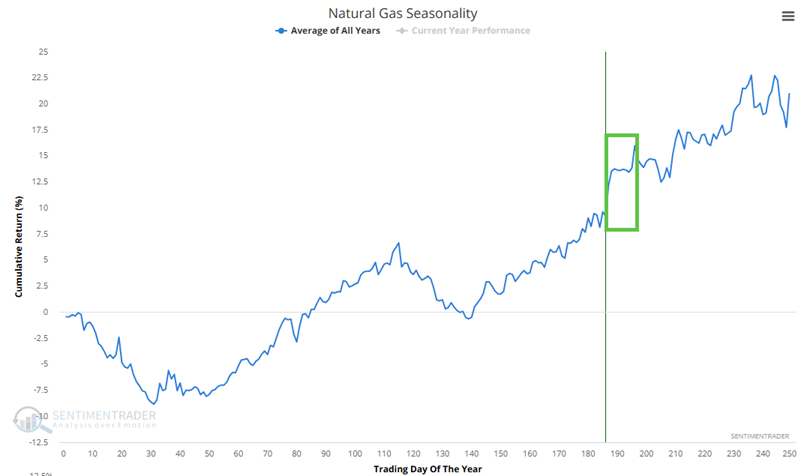
Despite overall persistent long-term weakness, Natural Gas has gained 648% during this period since 1985.
Natural Gas remains mired in a long trading range, but most recently in a downtrend.
Non-futures traders might consider trading shares of the United States Natural Gas Fund LP (UNG). Whether a trader uses futures contracts or ETF shares, it should be noted that this is a contrarian, against the major trend trade, as both the futures and the ETF remain mired in long-term downtrends. Playing the long side of this situation is only for aggressive, counter-trend traders willing to assume the risks involved.
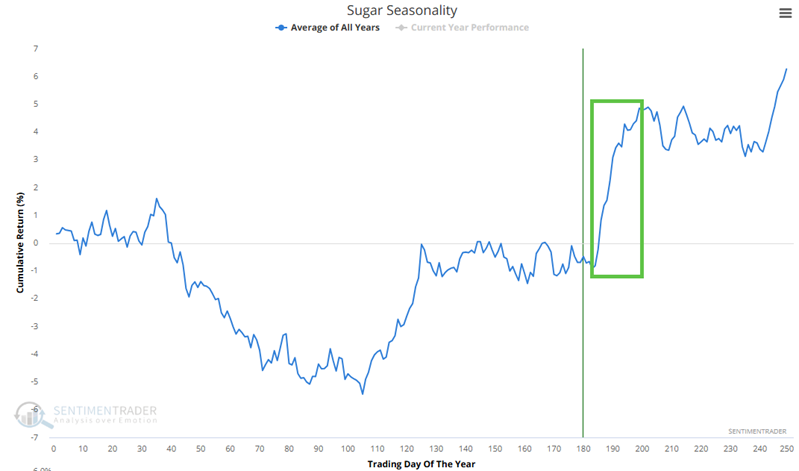
Commodity #4: Seasonality suggests strength for Sugar
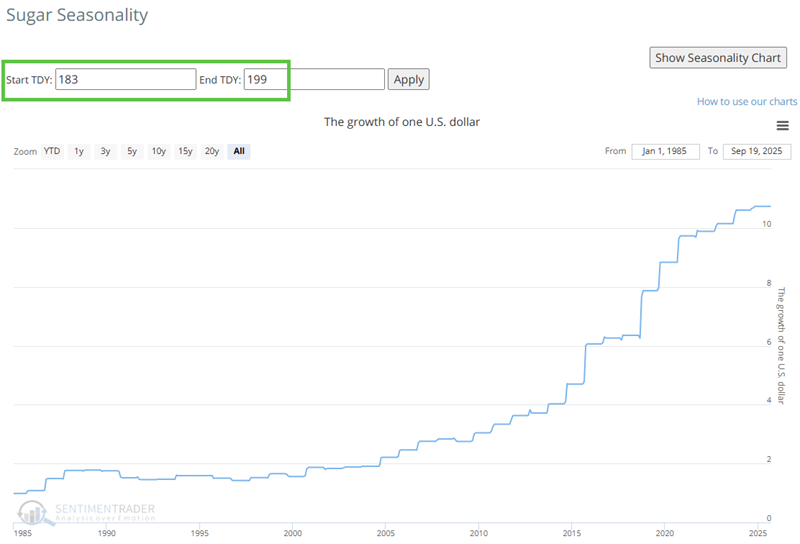
Speaking of contrarian ideas in a commodity mired in a downtrend, Sugar futures recently touched multi-year lows. So make no mistake: Considering a long position here is straight-up contrarian, counter-trend speculation-and the risk of loss is great. That said, the Annual Seasonal Trend chart for Sugar is entering a favorable period, extending from Trading Day of the Year (TDY) #183 through #199. For 2025, this period extends from September 24th through October 16th.
Sugar has gained 973% during this period since 1985, with remarkable consistency since 2000.
As discussed, the danger here is that Sugar remains mired in an obvious sideways to lower pattern.
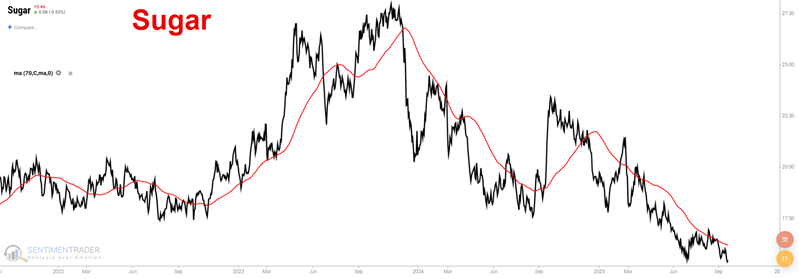
Non-futures traders might consider buying shares of the Teucrium Sugar Fund ETF (CANE).
What the research tells us…
My favorite usage of seasonality is as a tool to tell me "when to look where." Ideally, I would like to see a situation where seasonality and price action agree. In other words, a situation where price action is trending higher during a period when it is supposed to be trending higher (according to seasonality) can offer above-average probability of profit. It's the same on the downside for traders willing to play the short side. The opportunities highlighted above do not all fall into this category. The Canadian Dollar and Soybeans have been trending sideways, and Natural Gas and Sugar have been in obvious downtrends.
So to be clear, the opportunities highlighted above are only for aggressive short-term traders willing to take a counter-trend position to consider. Remember that position sizing and risk management are the keys to speculative trading success.