
Five Straight Up Months for the S&P 500 (and why it matters)

Key points
- Momentum is an important factor in the stock market, as strength tends to beget more strength
- A higher close for the S&P 500 for September will mark five consecutive up months
- Historically, this has tended to be followed by still higher prices in the year ahead
S&P 500 closes higher for five straight months
The S&P 500 registered a monthly loss during April 2025. As the end of September approaches, the index is on track to register its fifth consecutive higher monthly close. Intuitively, this causes many investors to presume that the market may "already be up too much" and/or that it is due for a pullback (which could be true). However, history suggests this event should fall on the favorable side of the "weight of the evidence" ledger.
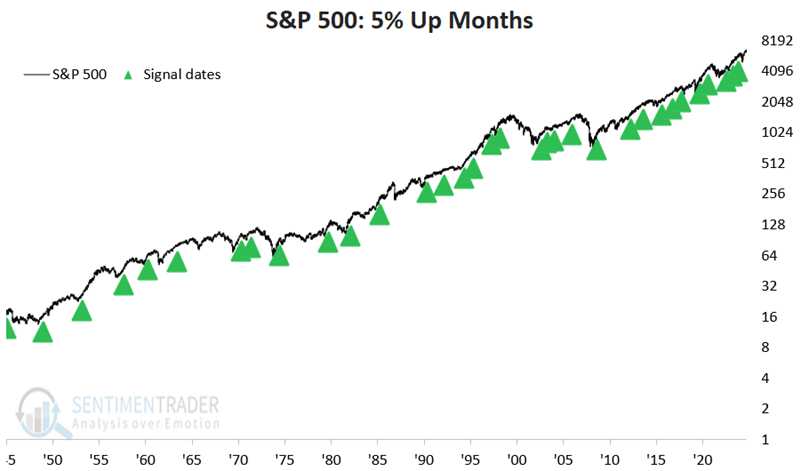
The chart below highlights with a green arrow all months since 1945 when the S&P 500 closed higher for the fifth consecutive month, following a down month.
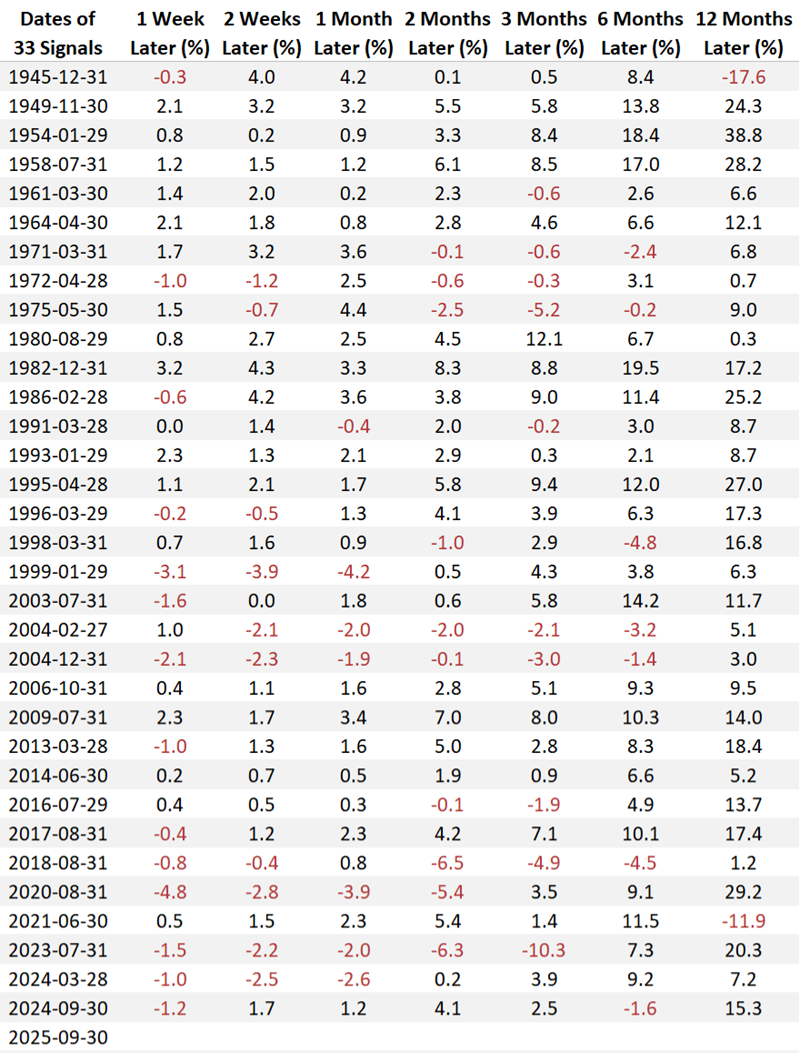
The table below displays the price performance for the S&P 500 following the dates highlighted in the chart above.
The table below summarizes S&P 500 performance during the periods highlighted in the chart and table above.
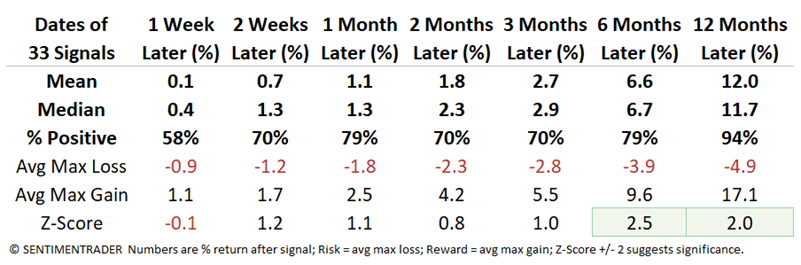
One caveat is that Median Returns are not spectacular. Nevertheless, the Win Rates (especially for six and twelve months) and decent z-scores again suggest that long-term investors continue to give the bullish case the benefit of the doubt for now.
Reviewing results using a systematic approach
While we don't recommend using "five up months" as a standalone trading system, it is instructive to look at it on that basis. For the following test, we will examine S&P 500 performance as follows:
- If, following a down month, the S&P 500 index closes higher for five straight months, we will buy and hold the index for twelve months
- If a new signal occurs within those twelve months, that signal will be ignored
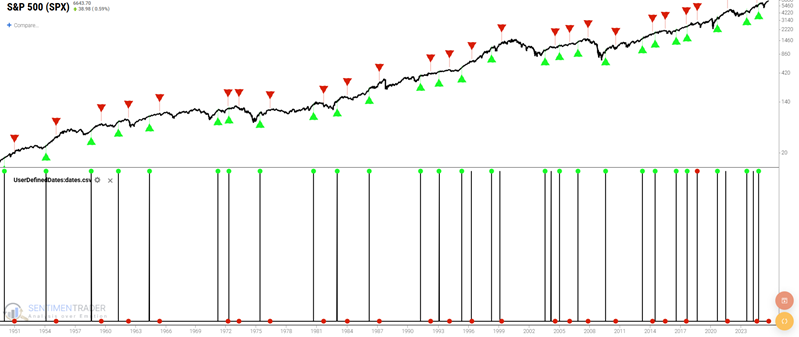
The chart below shows all the twelve-month periods since 1945, which excludes some of the overlapping signals from the first test.
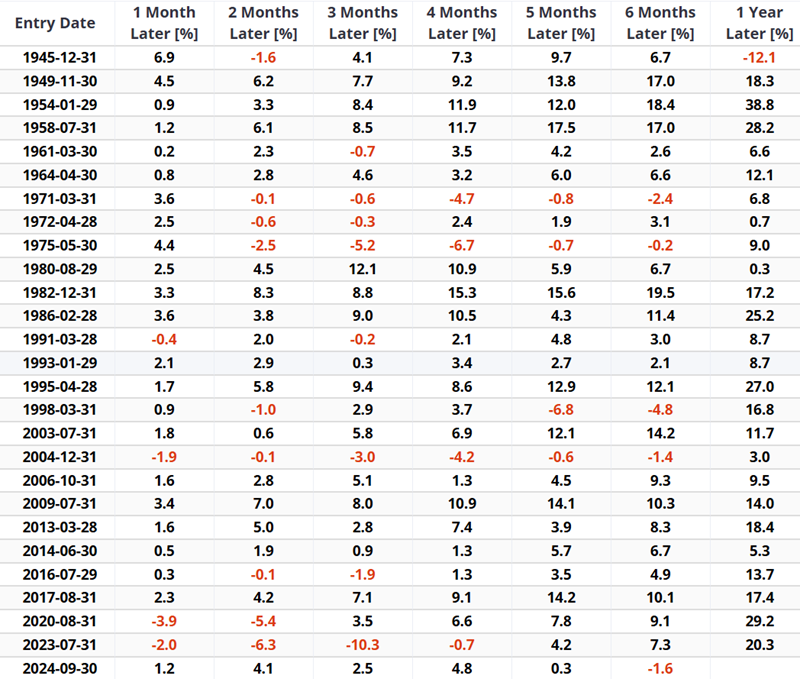
The table below displays the price performance for the S&P 500 following the dates highlighted in the chart above.
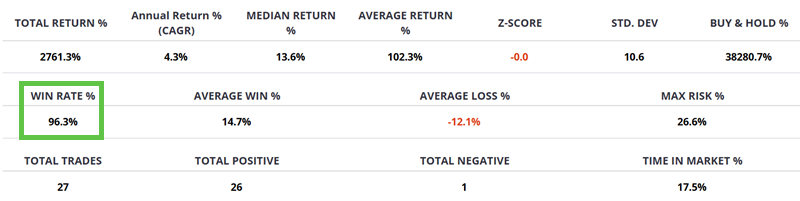
The table below summarizes the S&P 500's performance during the twelve-month periods highlighted in the chart and table above. Note that the first signal (1945-12-31) saw the S&P 500 decline over the next twelve months. Since then, the next 26 signals saw the S&P 500 register a gain over twelve months later.
The next signal will be added to this table at the close on 2025-09-30.
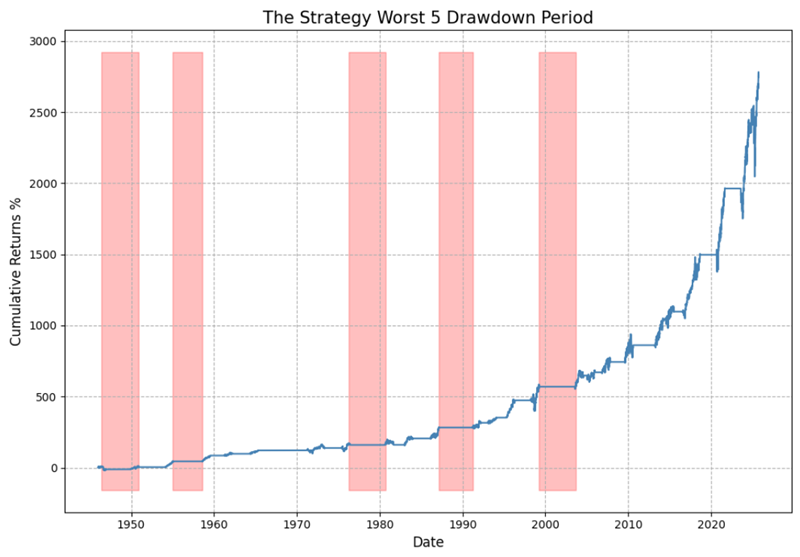
The chart below displays the hypothetical equity curve achieved by holding the S&P 500 only during the twelve months following the above dates. The key thing to note is the equity curve's "lower left to upper right" nature.
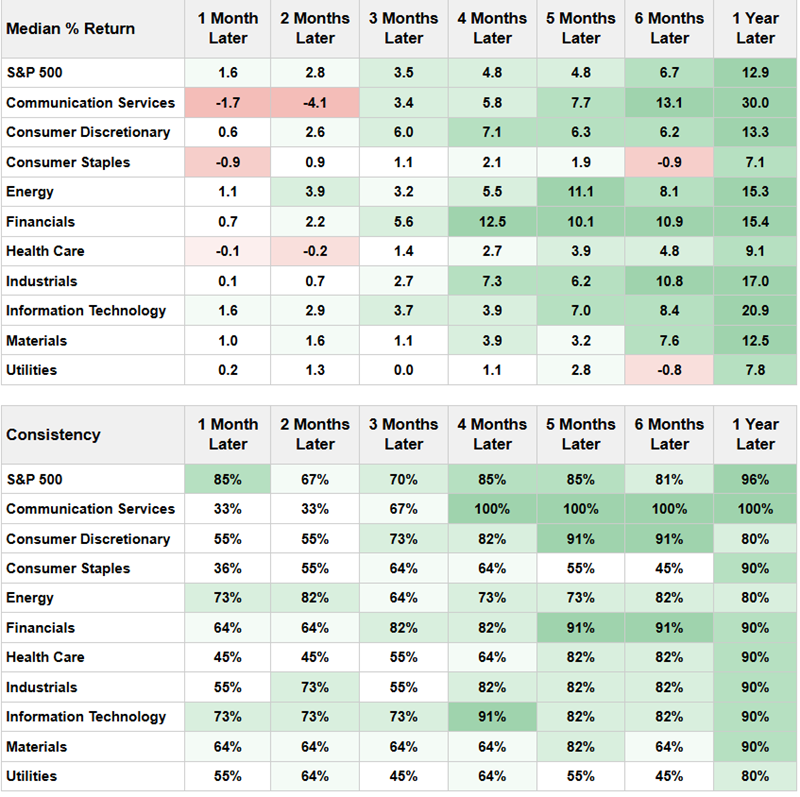
Broadening our horizons, the table below shows performance results for the S&P 500 sectors during the twelve months following the dates highlighted above.
What the research tells us…
Momentum is a real thing in the stock market. Many investors start to get skittish following a significant advance, assuming that a pullback must be in the offing. And pullbacks - sometimes sizable - are a normal part of market action. However, the real question for longer-term investors is more one of "fight or flight" or, maybe more accurately, "flight or sit tight." While some individuals are tempted to "sell into strength" or "not hold on too long," the above results suggest that long-term investors sit tight and continue to give the bullish case the benefit of the doubt.