
Five Reasons Not to be a Long-Term Investor in T-Bonds

Key points:
- The treasury bond market has been beaten down for several years, and the price pattern has been coiling
- A recent uptrend and talk of lower interest rates may be setting the stage for a treasury bond rally
- However, a variety of objective bond market indicators that we follow continue to remain unfavorable for now
The technical state of the bond market
The chart below displays the price action of 30-year Treasury bond futures over the past few years. Following a massive decline from March 2020 to October 2023, long-term treasuries have been trading in a narrowing range without making new lows.
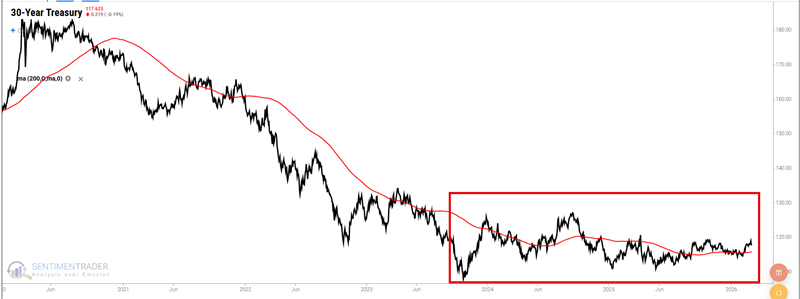
More recently, T-bonds have traded in a narrowing range, with lower highs but also higher lows. According to classic technical analysis, this price pattern, often called "coiling," is typically followed by a meaningful advance. This has led many pundits and speculators to proffer that the bond market will break out decisively to the upside following this long period of decline and consolidation.
And they may be right. However, several indicators remain unfavorable for long-term treasuries and suggest that now is not the time to make a major commitment to long-term treasury bonds. Let's take a closer look.
The Copper/Gold Ratio remains at a very low level
The Copper/Gold Ratio, which measures the relative performance of the leading industrial metal versus the leading precious metal, has a surprisingly wide influence across many markets, including bonds.
The chart below highlights all dates when the Copper/Gold Ratio was below 0.2.
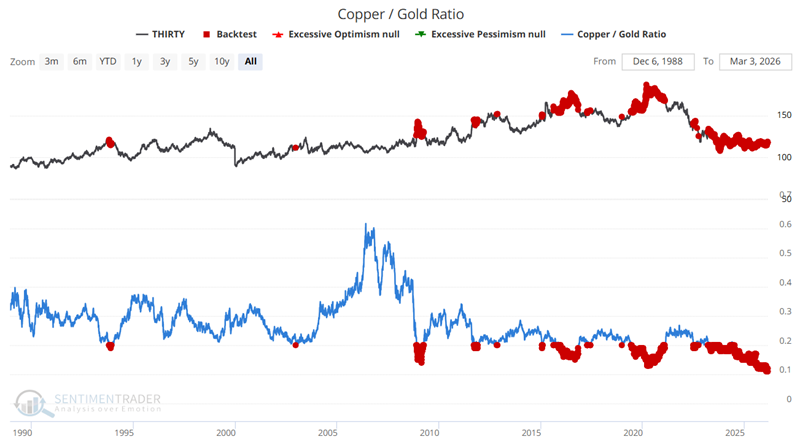
The table below summarizes the subsequent performance of 30-year treasuries. Note that, one year later, treasuries were higher only 29% of the time.

Even worse forward results for treasuries have accompanied lower copper-to-gold ratios. The chart below highlights all dates when the Copper/Gold Ratio was at 0.17 or lower.
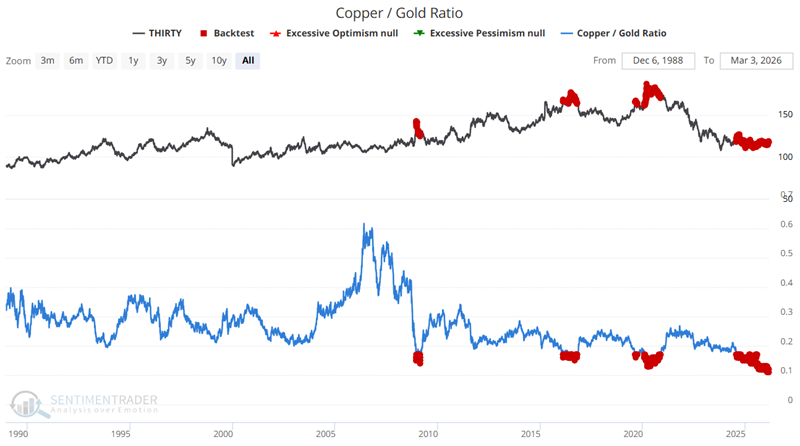
The table below summarizes the subsequent performance of 30-year treasuries following Copper/Gold Ratio readings below 0.17.

One-year results showed just an 18% Win Rate and a Median Return of -8.00%. Does this guarantee lower bond prices from here? Not at all. But it does flash a warning sign.
The University of Michigan survey has a different impact on bonds than on stocks
In this piece, I highlighted that low consumer confidence readings have typically been bullish for stock prices. Treasury bond prices, however, have tended to behave differently. The chart below highlights all dates when the U of M Consumer Confidence Index was below 60.
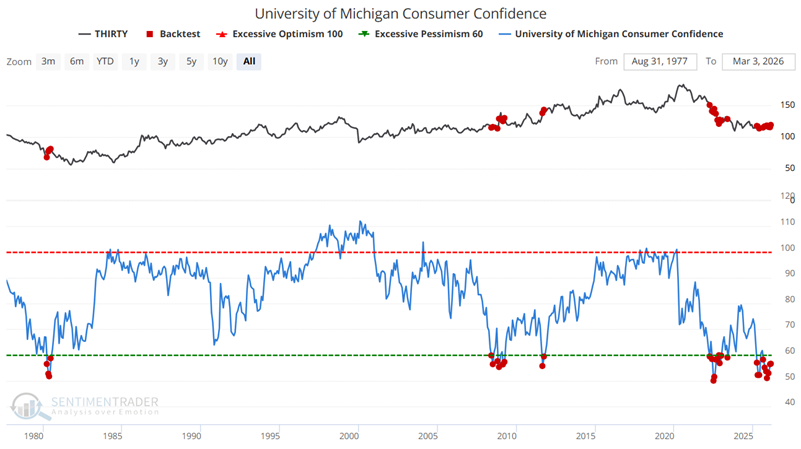
The table below summarizes the performance of the subsequent 30-year Treasury bonds. One-year results showed just a 23% Win Rate and a Median Return of -6.53%.

Treasury bond futures trader sentiment remains stubbornly high
Sentiment among treasury bond futures traders has been relatively bullish of late. While this is not surprising given the favorable price action for t-bonds so far in 2026, this type of action often serves as a contrary indicator. The chart below highlights all weeks when the 30-year Optix indicator was equal to 100.
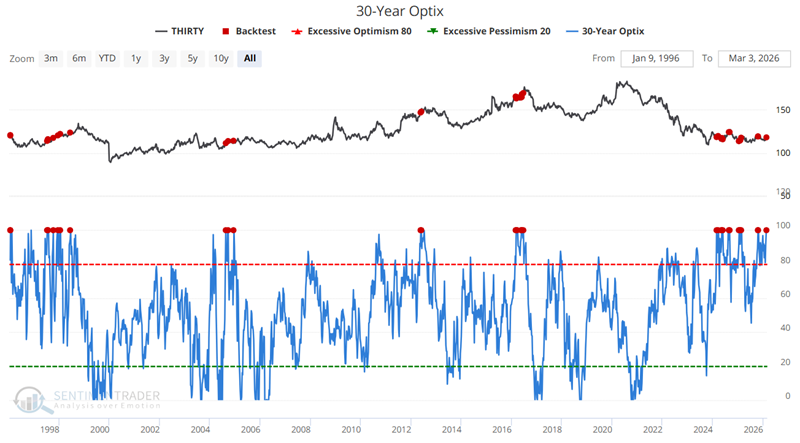
The table below summarizes the subsequent 30-year Treasury bond performance following previous signals.

To look at a longer-term test, the chart below highlights all weeks when the 10-week moving average of our 30-year Optix indicator was above 80.
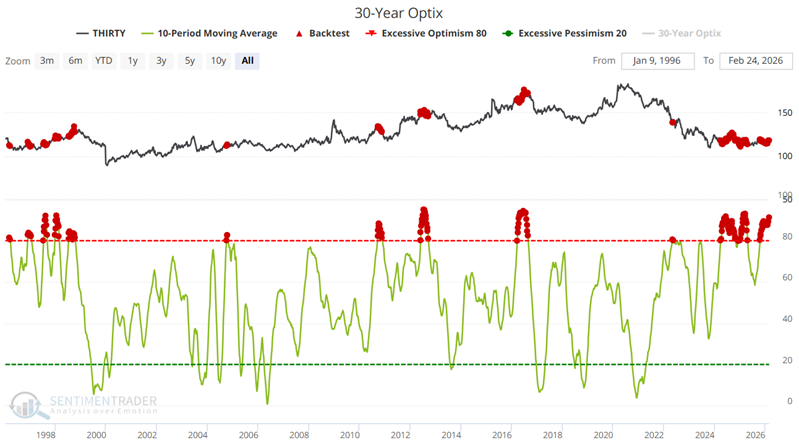
The table below summarizes the subsequent 30-year Treasury bond performance following previous signals.

While the results above for this indicator are not as extreme as some of the earlier ones, they show the same pattern of bond price weakness and add weight to the unfavorable case for bonds.
The JK Bond Cycle Model remains locked in unfavorable territory
The JK Bond Cycle Model is a responsive indicator that tracks cyclical trends in the bond market. It is designed to identify significant shifts in market sentiment by comparing the current reading of the JK Bond Cycle Thermometer with the previous one. A Thermometer reading of +3 or +4 sets the JK Bond Cycle Model to a value of +1, which indicates a bullish stance for bonds. A Thermometer reading of +1 or 0 sets the JK Bond Cycle Model to a value of 0, which suggests bearish conditions for long-term treasuries. This model is particularly insightful for investors seeking to align their strategies with the evolving market dynamics.
The chart below highlights all dates when the JK Bond Cycle Model dropped from +1 to 0.
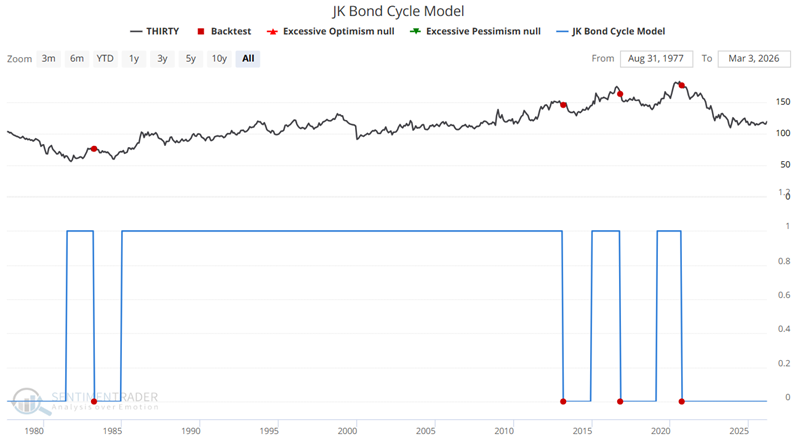
The table below summarizes the subsequent 30-year treasury performance following the JK Bond Cycle Model dropping to 0. The results are fairly ominous, but note that the last "new" signal occurred almost 5.5 years ago.
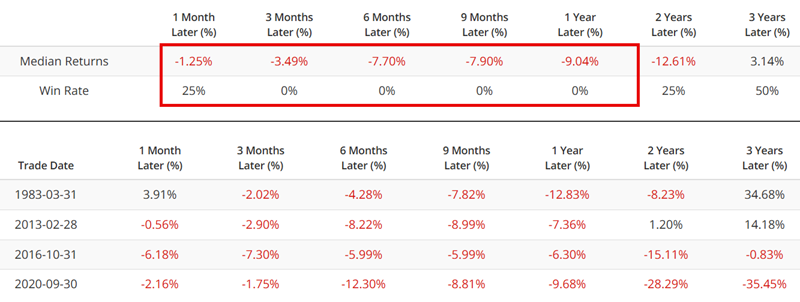
If we consider the periods from the time the JK Bond Cycle Model hits 0 until it gets back up to +1 as a short side "trade", the table below shows the results of those trades.
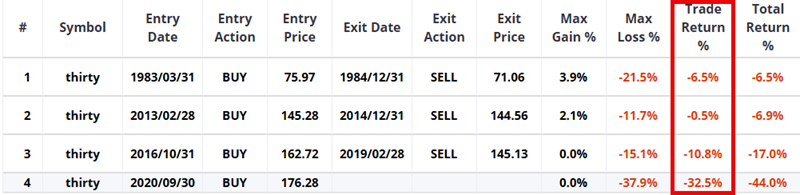
This model presently shows no prospects of moving from 0 to 1 anytime soon. While this does not guarantee unfavorable results going forward, it definitely stands as negative weight of the evidence for treasury bonds.
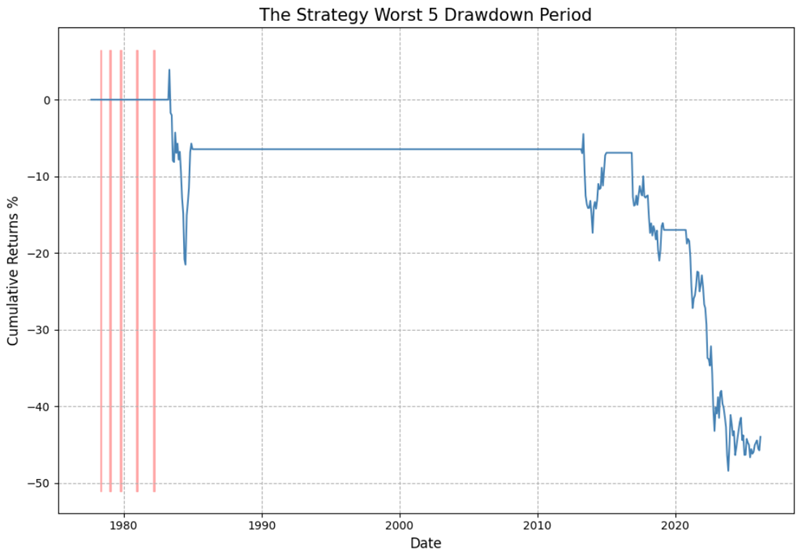
The chart below shows the hypothetical % gain or loss from holding a long position in 30-year t-bonds when the model is at a reading of 0.
Treasury Bond seasonality remains unfavorable
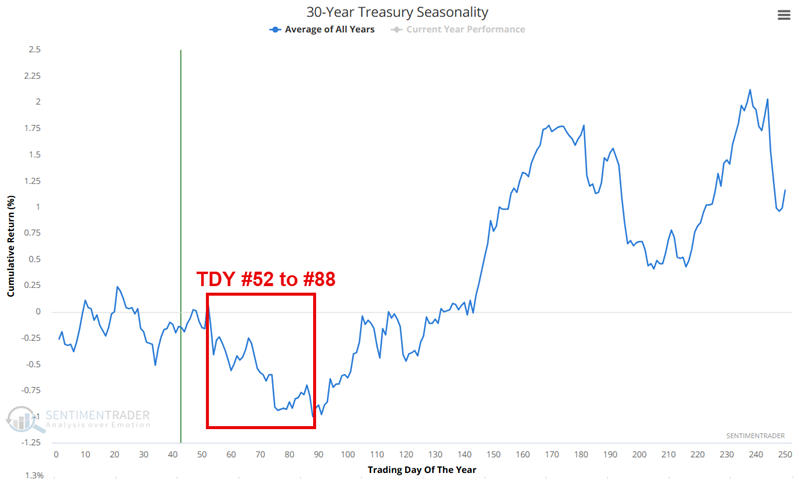
The chart below displays the annual seasonal trend for 30-year Treasury bond futures. Note that a period of typical weakness will extend from March 16th through May 6th.
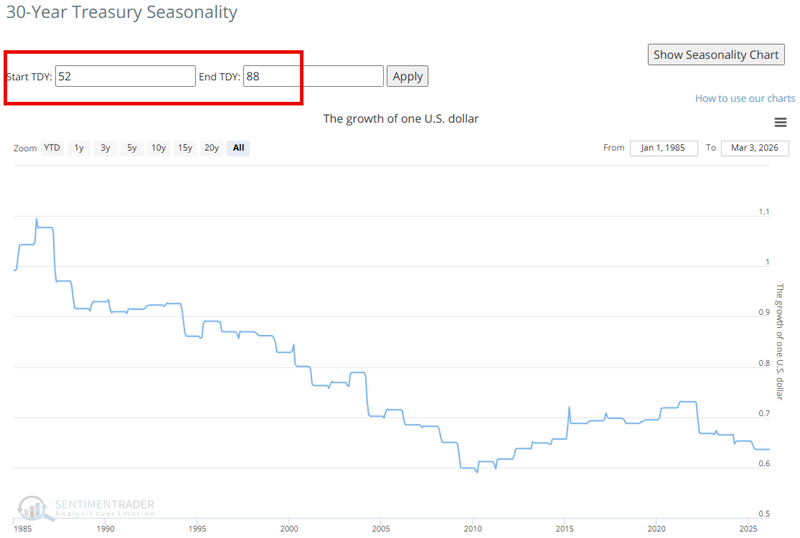
The chart below displays the hypothetical % +(-) achieved by holding a long position in treasury bonds only during the Trading Day of Year #52 through TDY #88 period each year since 1985.
What the research tells us…
Short-term traders may be encouraged by the recent upward trend in t-bond prices. On the other hand, investors who might consider building a position in long-term treasury bonds as a long-term investment should carefully consider the vast array of unfavorable indicator results detailed above before doing so. Unless and until price action actually breaks out to the upside, the weight of the bond market evidence still favors the short side for traders.