
Financials trigger a breadth thrust buy signal

Key points:
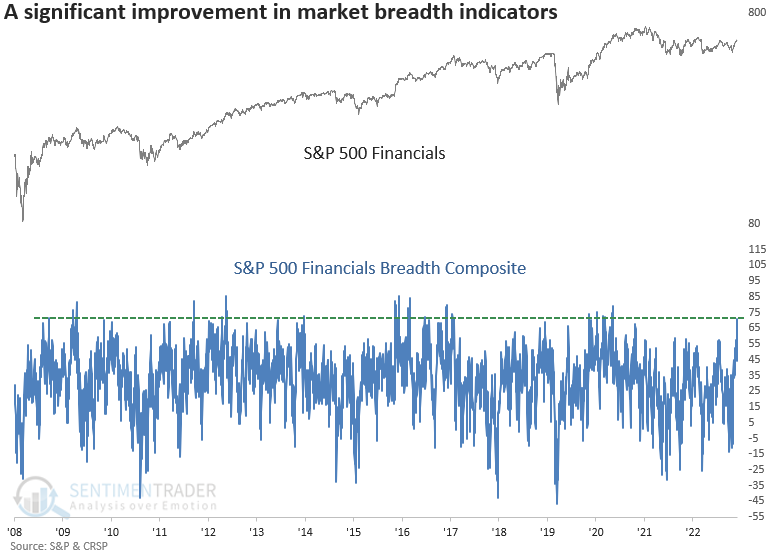
- A breadth composite for the S&P 500 Financials surged to the highest level in more than two years
- Similar increases in the composite generated favorable results for financials and the broad market
- The S&P 500 Financials showed a tendency to outperform the S&P 500 after similar alerts
Financials signal risk-on
Confirmation of the rally's sustainability gained further credence last week when market breadth indicators shifted upwards, indicating widespread participation.
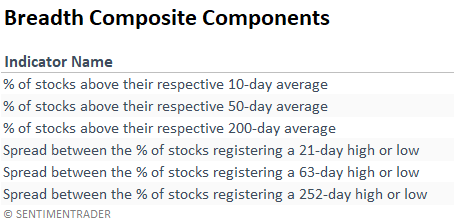
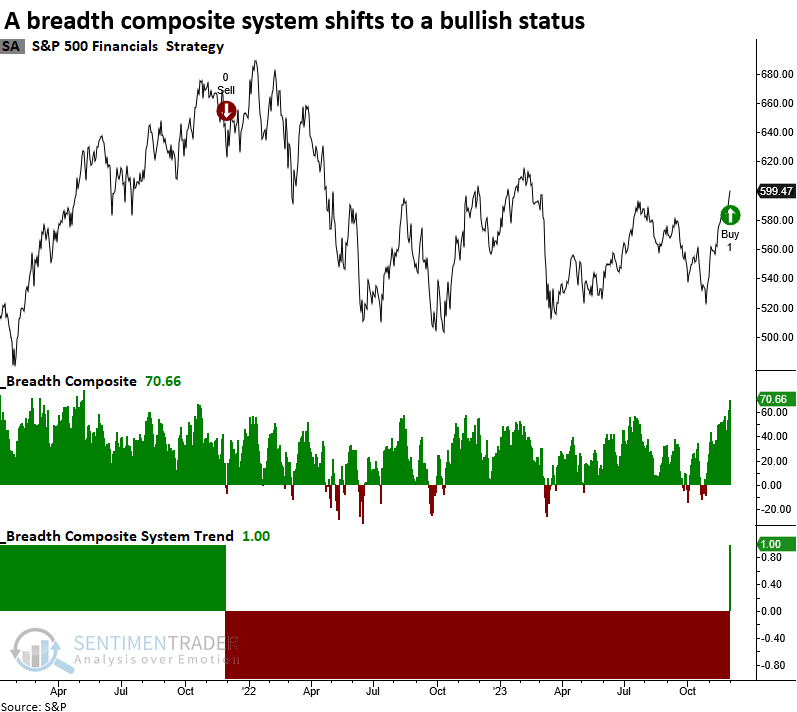
Nowhere was that more evident than in the financial sector, where a breadth composite containing six indicators with various duration lengths exploded to the highest level in more than two years, triggering a buy signal for the group. The previous signal generated an alert in November 2020, leading to an almost 16% gain over the following three months.
A single arrow is easily broken, but not ten in a bundle - Japanese proverb
Similar increases in the breadth composite produced bullish outcomes
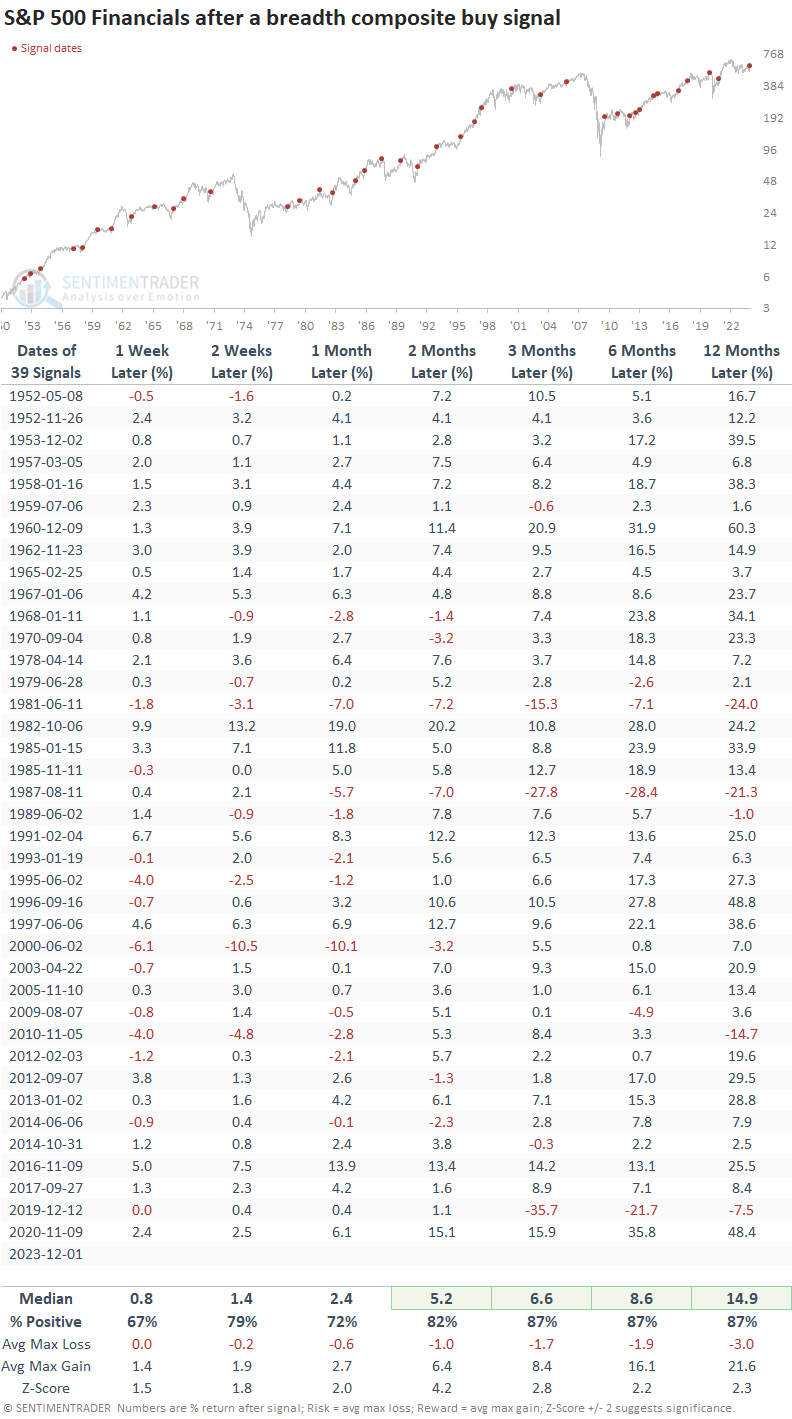
Whenever the S&P 500 Financials breadth composite surges above 67%, returns, win rates, and z-scores for the financials sector are excellent across all time horizons. The signal showed a gain at some point over the subsequent three months in 38 out of 39 precedents.
Bullish for broad market
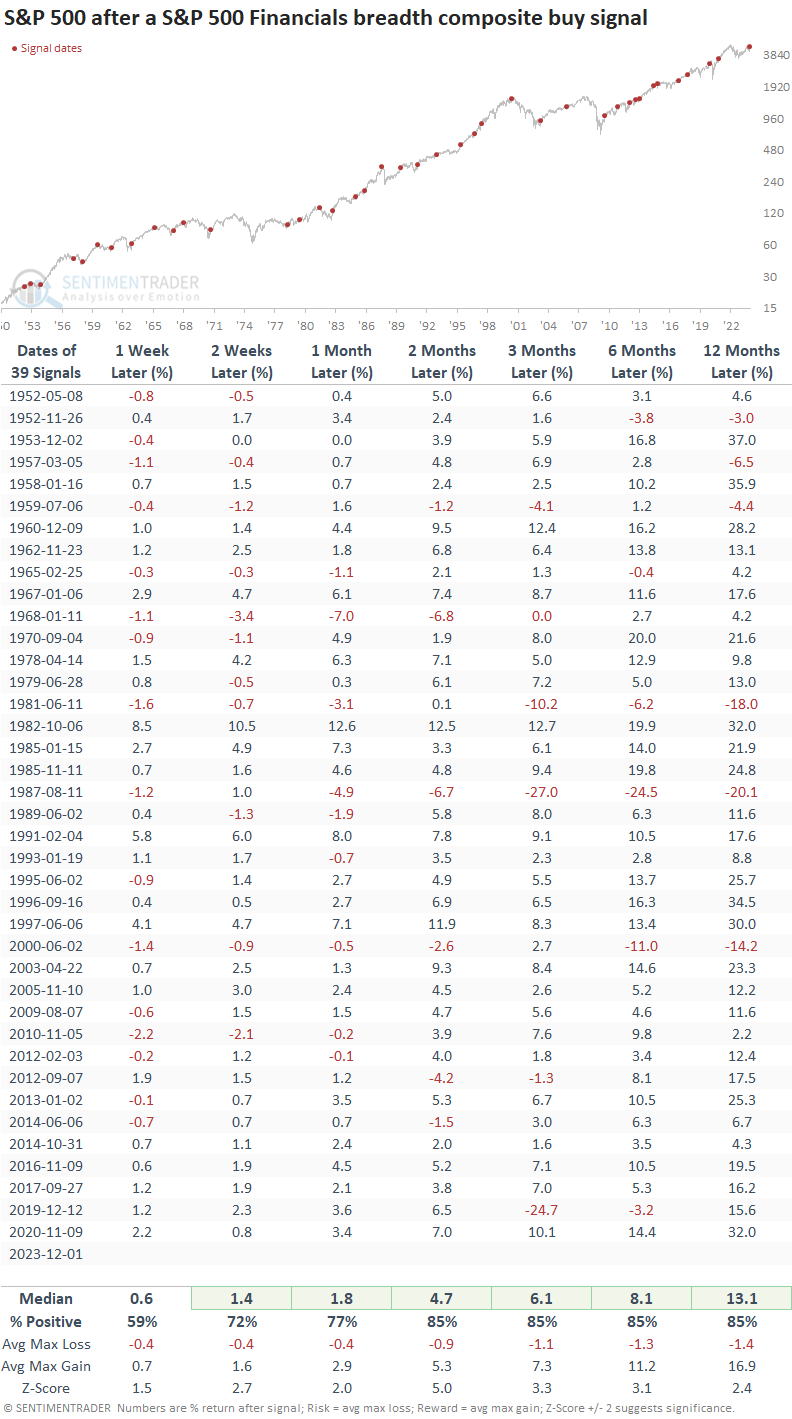
When market breadth indicators for the financials sector show a high level of participation, like now, it's typically associated with an overall bullish backdrop. Returns, win rates, and z-scores are outstanding for the S&P 500.
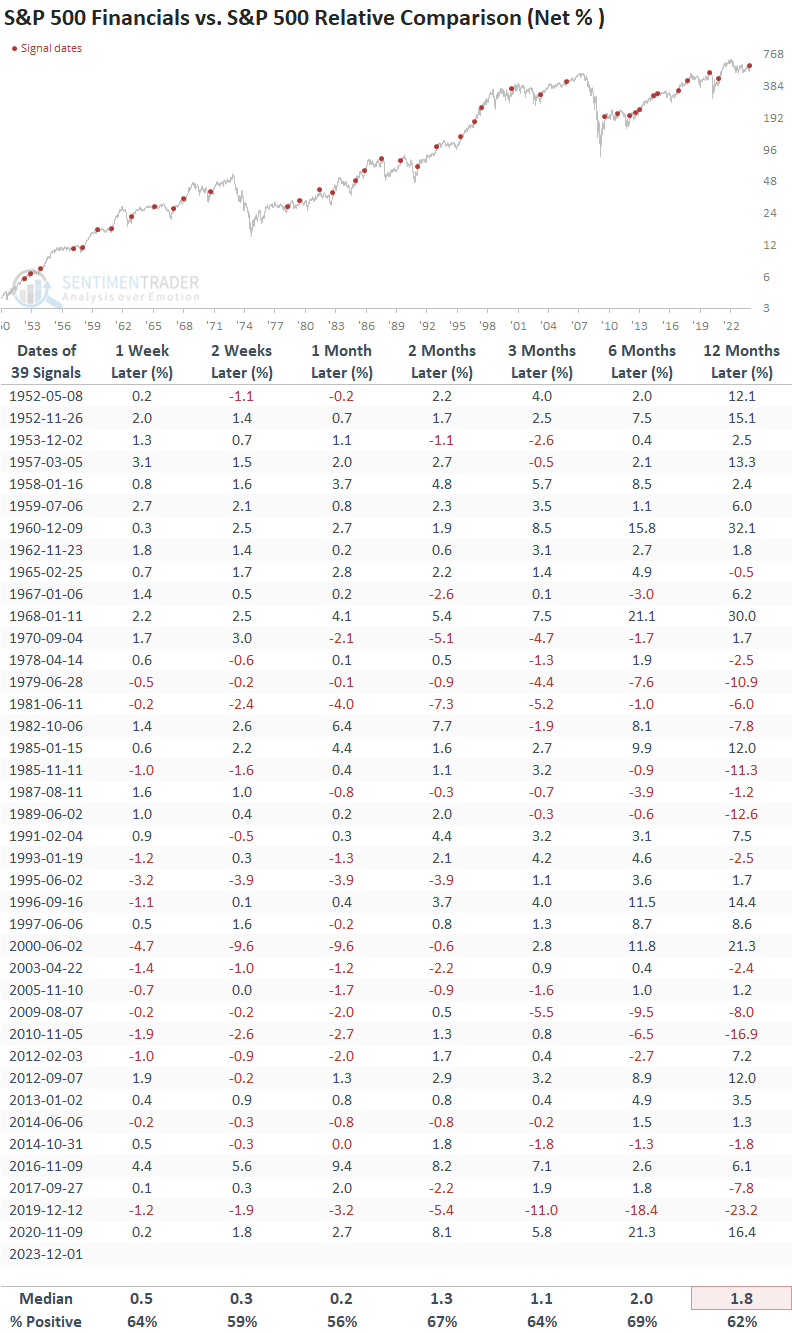
Relative comparison
After breadth composite signals, S&P 500 Financials consistently outperformed the S&P 500 across all time frames, with the highest win rate coming over the subsequent six months.
A trading system based on the breadth composite
The breadth composite can be used as a standalone risk-on signal or as a trading system. The trading system generates a buy signal when the composite exceeds 67%, similar to the standalone threshold. However, the system issues a sell signal when the composite falls below 1%.
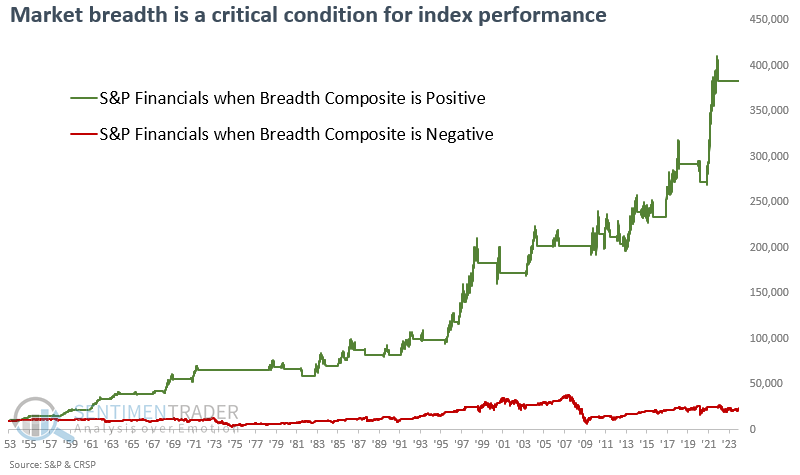
Utilizing the threshold levels for buy and sell signals, an initial $10,000 investment in the S&P 500 Financials catapults to $383,000 during positive composite periods. Conversely, during negative phases, the initial investment inches up to just $23,000.
Relative strength
Over the last week, the relative trend score for the S&P 500 Financials jumped eight points, and the sector registered new relative highs versus the S&P 500 in four out of five days.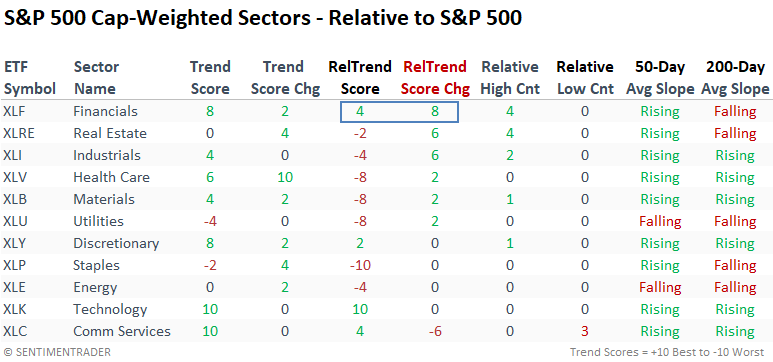
The equal-weighted S&P 500 Financials sector also registered a noticeable increase in its relative trend score. So, the improvement in financials is not limited to a handful of mega-cap names.
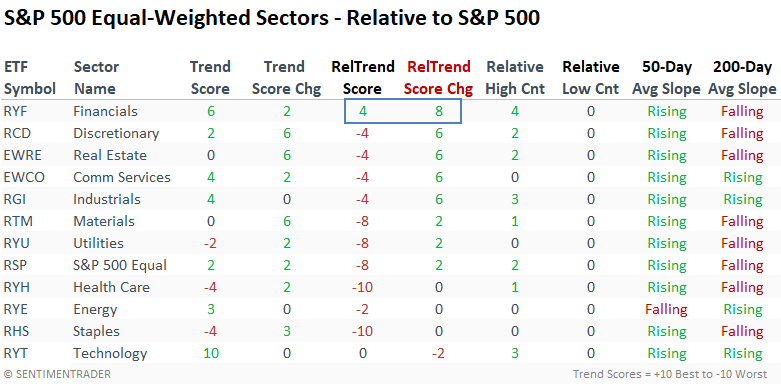
Drilling down further to industries shows notable relative trend score changes for the Capital Markets ETF (KCE) and the Bank ETF (KBE).
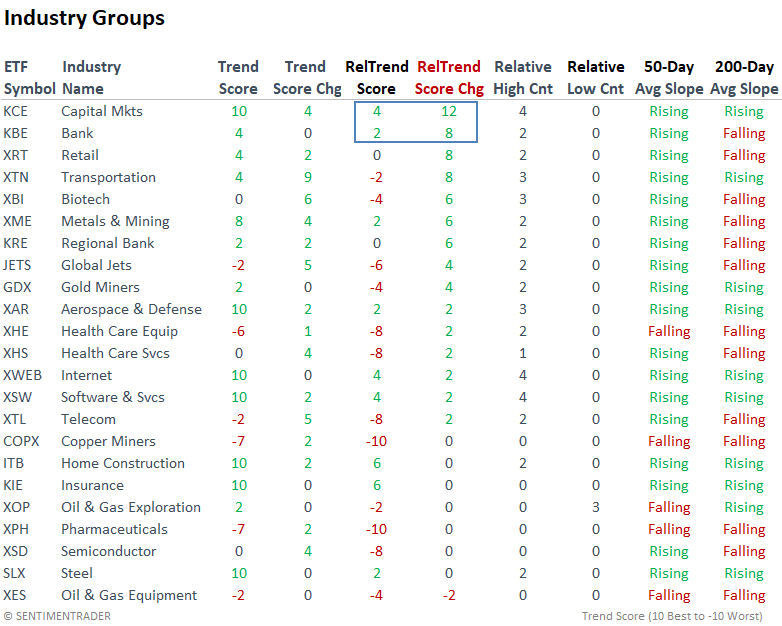
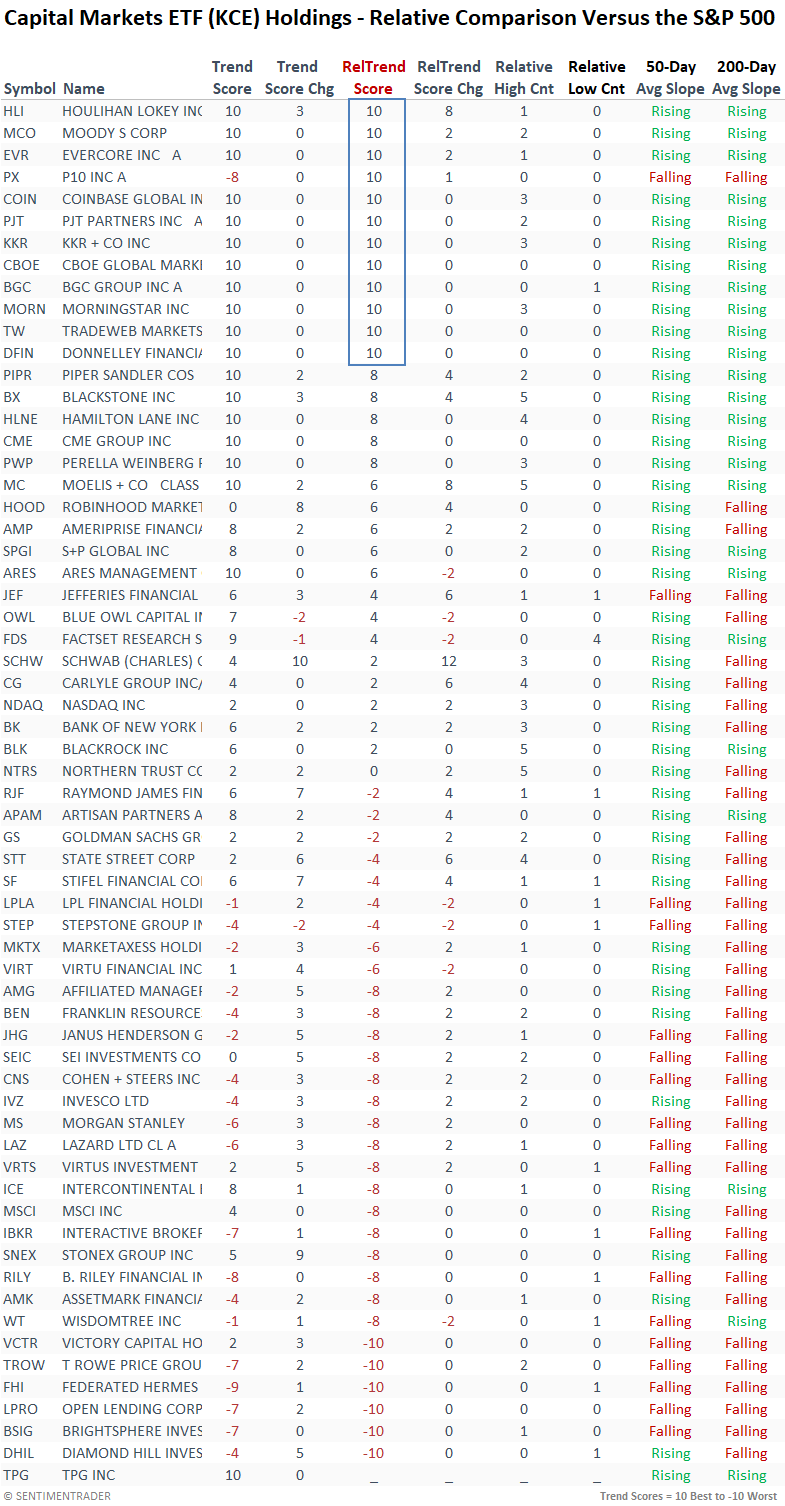
By peering beneath the surface of the Capital Markets ETF (KCE), we can better understand which companies are driving the improvement in relative performance.
What the research tells us...
A breadth composite for the S&P 500 Financials generated a new buy signal. Comparable alerts produced outstanding results for the sector and the overall market, with a slight performance edge favoring financials. While my models still prefer growth-oriented groups, based on this new evidence, financials deserve a look as the sector continues to improve relative to the S&P 500.