
Financials - The Momentum Continues

The S&P 500 financials sector surged to a new high on Wednesday. More importantly, the new high shows excellent internal participation from a couple of short-term indicators that I monitor for momentum-based signals.
Today's note aims to assess the forward return outlook for two signals that use the following indicators.
- The percentage of members registering a 21-day high
- The percentage of members above the 50-day average
Financial sector momentum looks good when compared to the S&P 500 and other sectors.
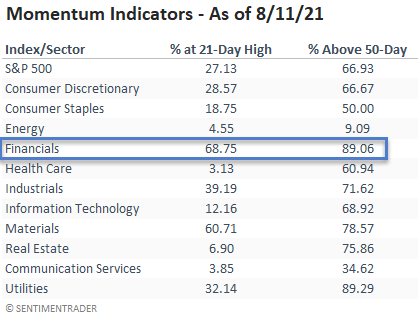
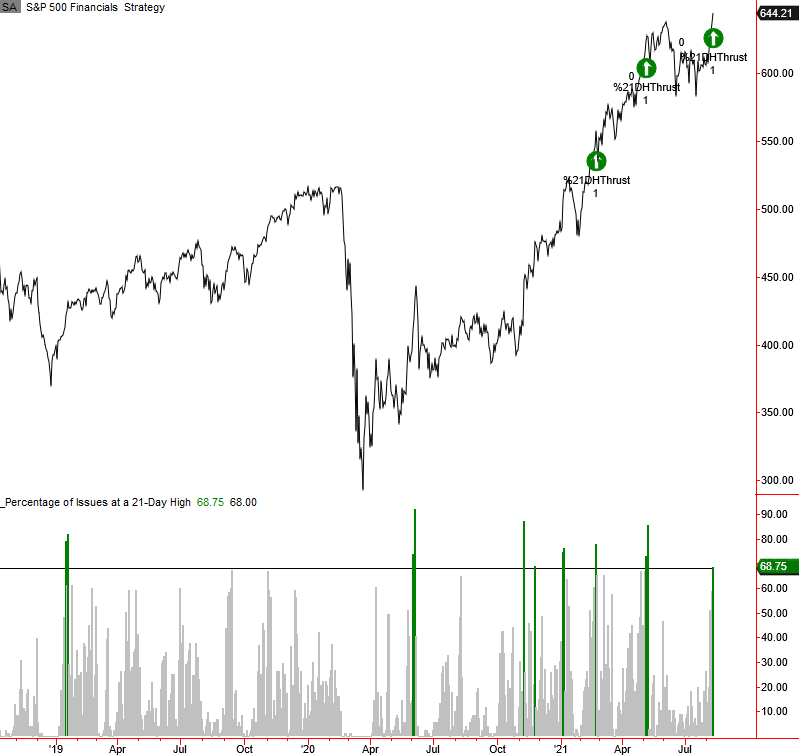
The percentage of S&P 500 Financial members registering a 21-day high surged to 68.75% on Wednesday. At the same time, the sector closed at a new 252-day high. I also noticed that the percentage of financial members registering a high outpaced the percentage of new highs in the S&P 500 index by a ratio of greater than 2/1.
Let's conduct a study to assess the forward return outlook for the financial sector using the following signal criteria. The goal is to isolate historical instances that look similar to the most recent condition.
SIGNAL CRITERIA
- Percentage of financial members registering 21-day highs crosses above 68%.
- The S&P 500 financials sector closes at a 252-day high.
- The percentage of 21-day highs for financials exceeds the percentage of 21-day highs for the S&P 500 by a ratio of 2/1.
CURRENT DAY CHART
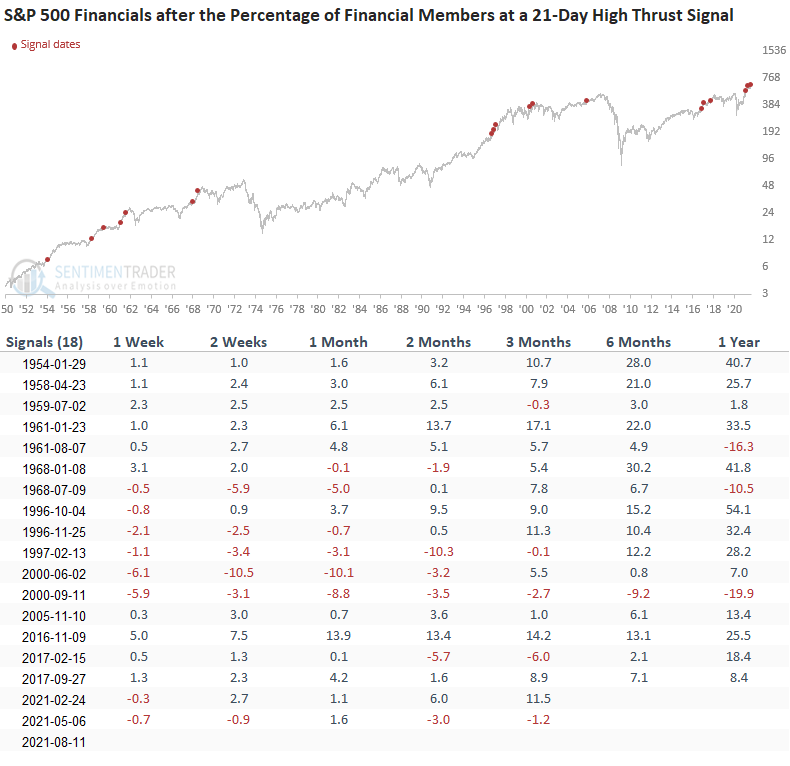
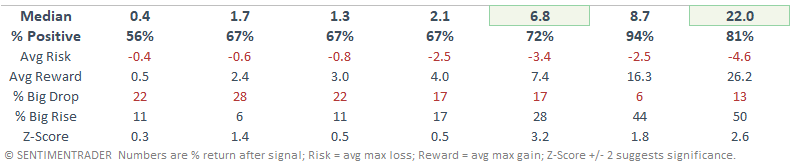
HOW THE SIGNALS PERFORMED
The intermediate to long-term results look good, especially the risk/reward profiles. I would note that a few of the instances hit a rough patch in the short term. However, it's not uncommon for momentum-based signals to take a break after the initial surge.
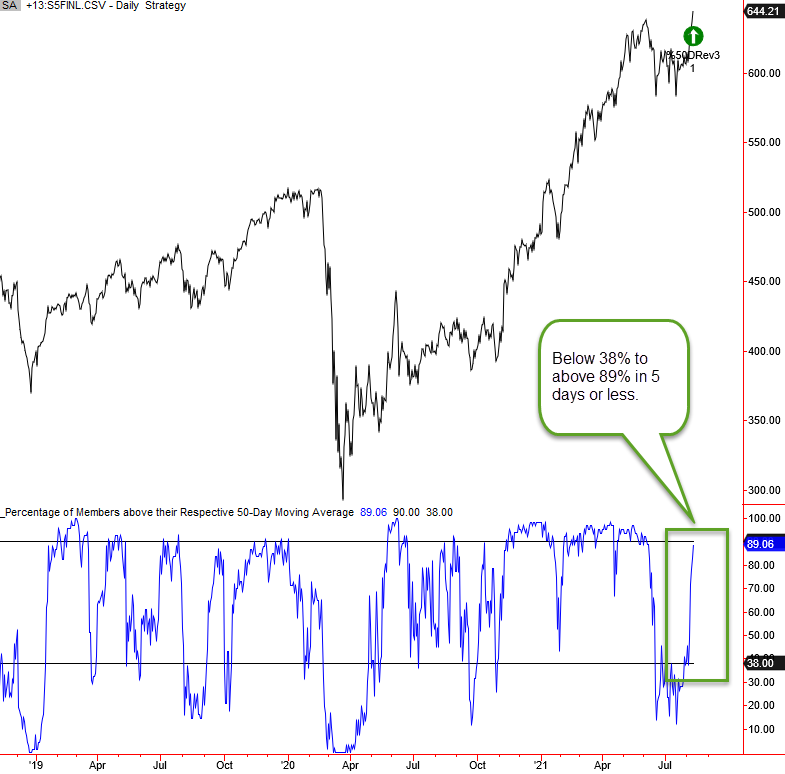
On Wednesday, the percentage of S&P 500 financial sector members trading above their respective 50-day moving average crossed above 89%. And, the cross occurred within five days of the indicator registering a reading below a level of 38%.
Let's conduct a study to assess the forward return outlook for the financial sector using the following signal criteria. The goal is to isolate historical instances that look similar to the most recent condition.
SIGNAL CRITERIA
- Percentage of financial members above the 50-day average crosses above 89% in five days or less of registering a reading of 38% or lower.
CURRENT DAY CHART
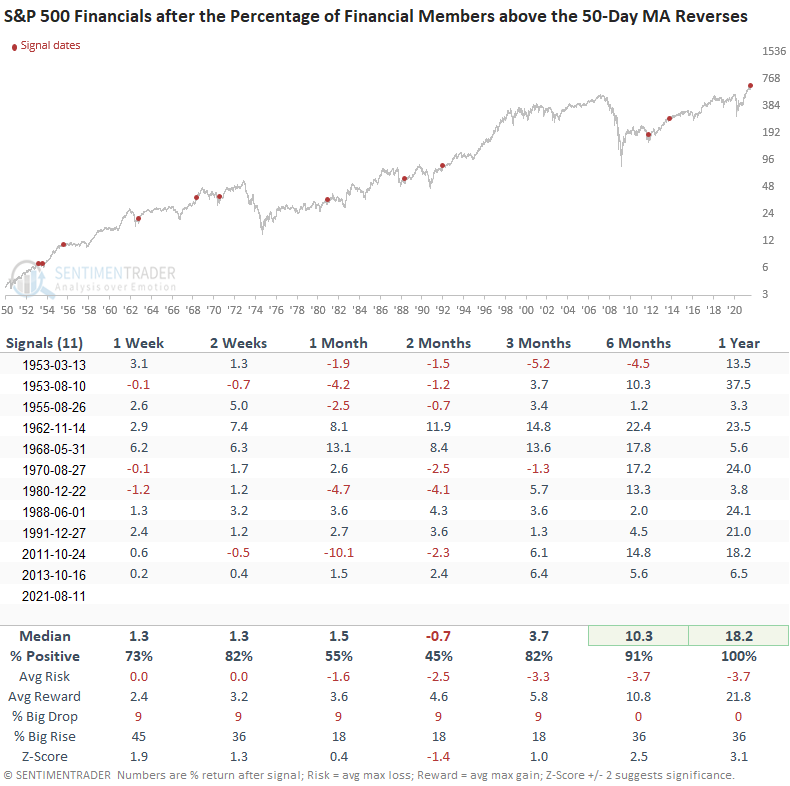
HOW THE SIGNALS PERFORMED
While the sample size is smaller, the results look good across almost all timeframes, especially in the 6-12 month window. As was the case with the surge in 21-day highs, momentum-based signals often see follow-through in the short term, followed by a digestion period. After the digestion period, the uptrend resumes.
Would you please click on the following link for a note from Tuesday that shared another breadth-based momentum signal for the financial sector? Click here.