
Financials surge to the leaderboard

Key points
- The Financial sector (XLF) has seen a sharp increase in relative strength, leading all sectors in short-term momentum.
- A sentiment signal from the XLF Put/Call Ratio suggests a favorable risk/reward setup for the sector, with a 94% historical win rate over six months.
- The breakout in Financials to new highs, occurring while the S&P 500 is near its own highs, has historically been a bullish confirmation for the broader market.
Relative strength rotation favors Financials
Prudent portfolio management requires diversification; we cannot put all our eggs in one basket. With this in mind, we actively monitor other sectors for signs of strengthening relative trends. One sector that has recently caught our attention is Financials, where the 10-day relative strength ranking has risen sharply, leading all sectors on Monday.
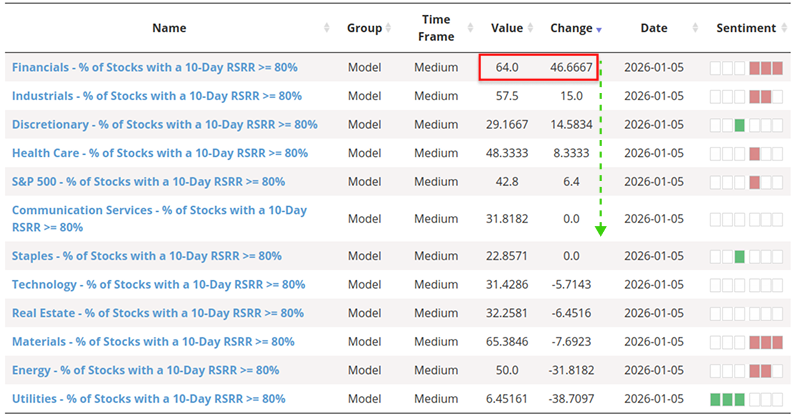
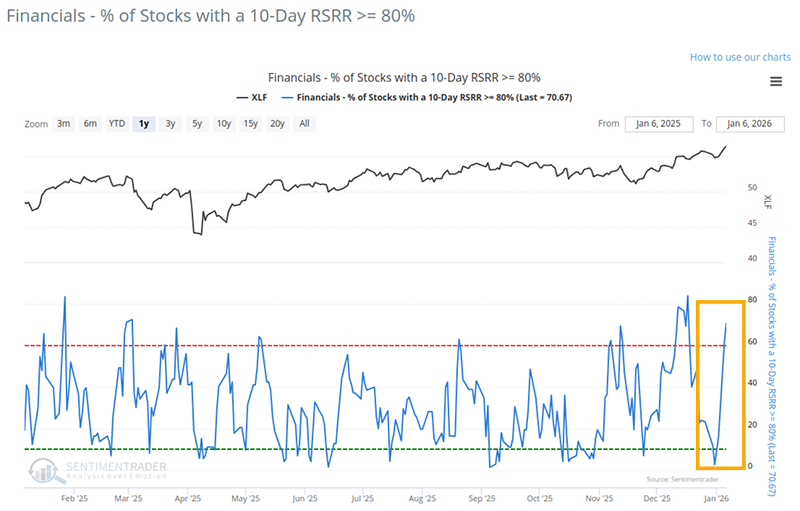
You can now visualize the data from the table above in a chart and analyze it using the backtest engine. The chart below shows that S&P 500 Financials stocks with a relative strength range rank of 80% or higher experienced a sharp uptick in recent sessions.
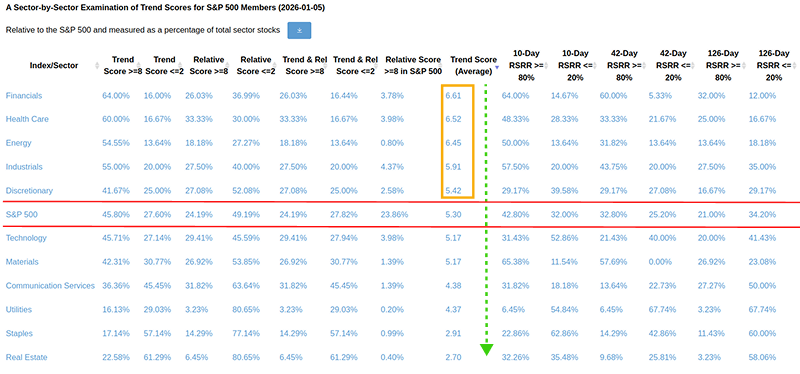
According to the sector summary page, Financials are one of only five sectors with a high average trend score. Compared to the S&P 500, Financials are leading the pack, with both Absolute and Relative Trend Scores reaching 8 or higher.
The combination of a sharp rise in 10-day relative ranks and favorable long-term trend scores suggests that investors should look for potential opportunities within this group
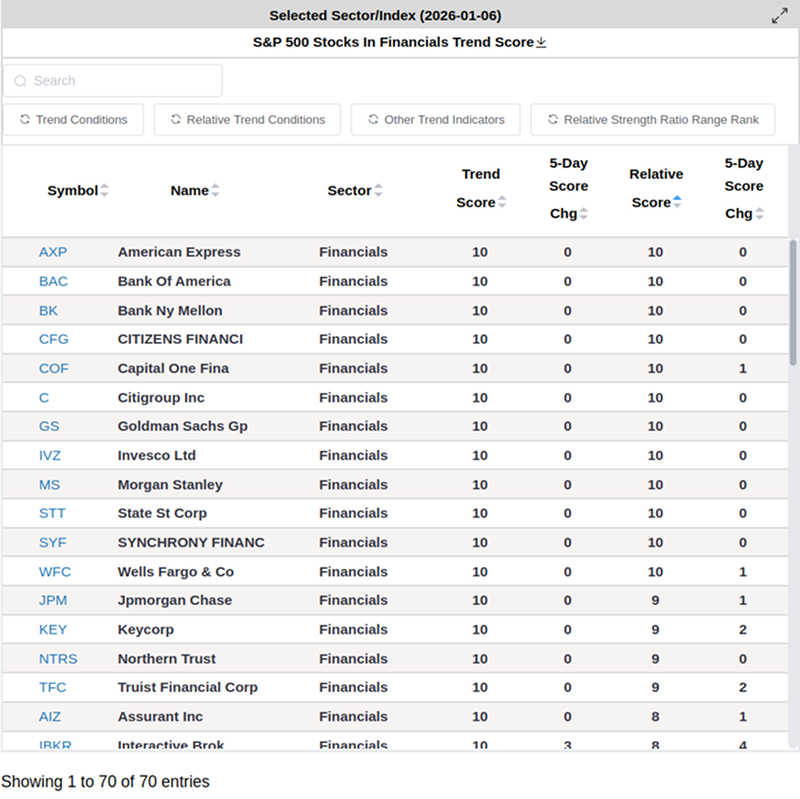
Consumer finance companies like American Express (AXP) and Capital One(COF), as well as traditional and custody banks like Bank of America (BAC) and Bank NY Mellon (BK), are showing strong absolute and relative trend scores. Click here for more details.
XLF Aggregated Put/Call Ratio
The 5-day average of the XLF Aggregated Put/Call Ratio recently triggered a buy signal. The current reading stands at 0.416.
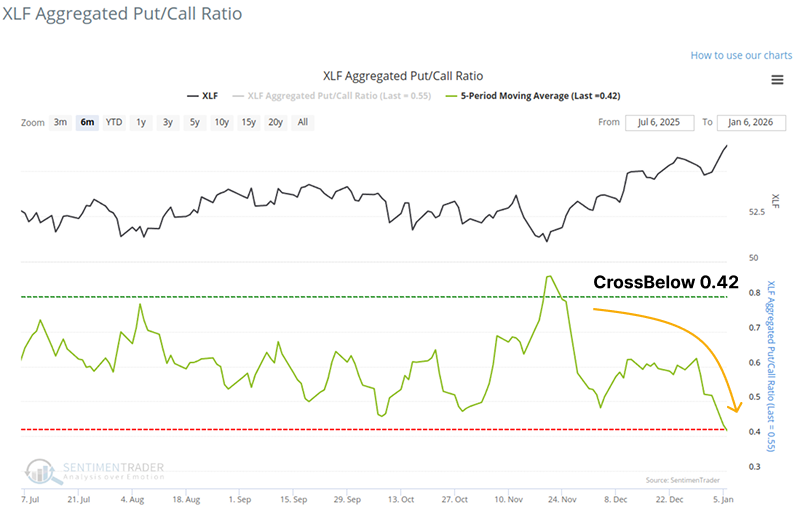
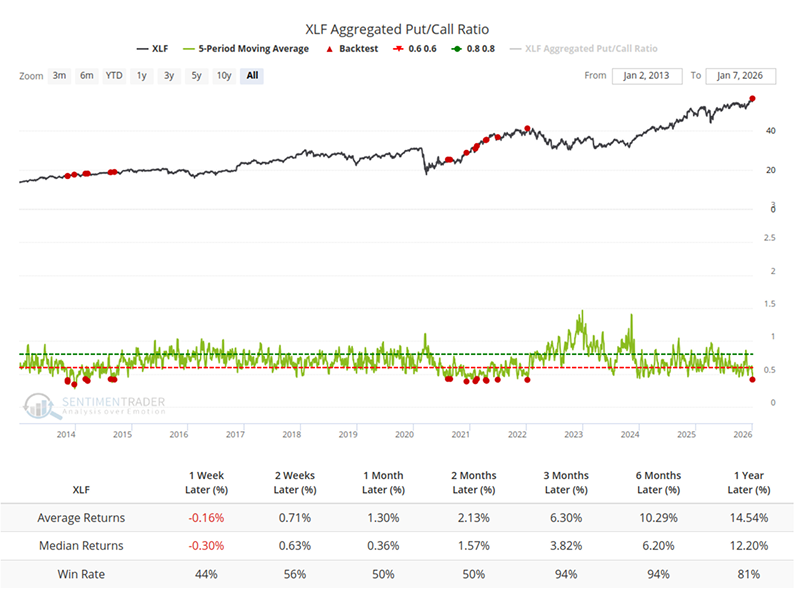
The chart and table below display the price action of XLF following periods when the XLF Aggregated Put/Call Ratio Crossbelow 0.42. As you can see, performance has been robust over medium-to-long-term timeframes, achieving a 94% win rate over both three and six months.
How about the S&P 500?
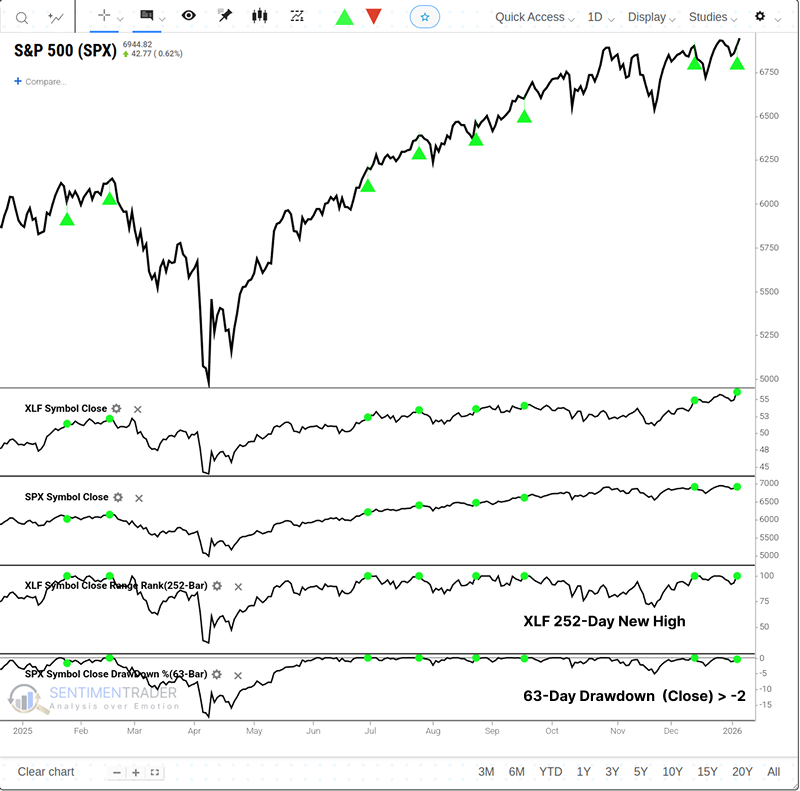
Recently, XLF has shown strong momentum, hitting all-time highs. Let's assess the prospects for the S&P 500 under similar circumstances.
The chart below displays those times when:
- XLF hit a 252-day high
- AND the S&P 500 Index was within 2% of its 63-day high
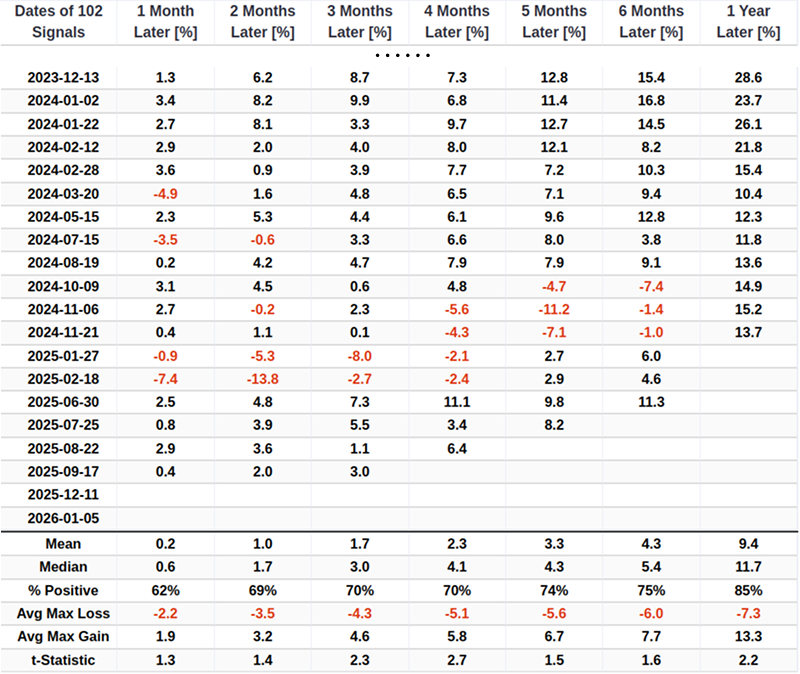
As shown in the table, the win rate increases as the time horizon extends, which is a good omen for the long-term market.
What the research tells us...
The Financial sector is exhibiting powerful signs of accumulation. Relative strength metrics are surging, establishing Financials as a clear market leader with high trend scores. This price strength is supported by constructive options sentiment, where the Put/Call ratio points to further upside potential. Furthermore, the ability of a key cyclical sector like Financials to hit new highs alongside the broader market reinforces the durability of the current bull trend. History suggests that when Financials lead in this manner, the outlook for both the sector and the S&P 500 remains positive over the coming months.
Of course, past performance does not guarantee future results. Historical win rates cannot entirely eliminate future uncertainties, and investors are advised to closely monitor the validity of key support levels.