
Financials hit resistance - now what?

Key points
- The Financials sector rallied strongly off its October 23 low but recently hit resistance and fell slightly back
- A variety of factors and indicators strongly suggest that the sector will ultimately break out to the upside
- Still, for traders, the prudent approach might be waiting for the sector to "prove it" before jumping in
The Financials sector has "bumped its head"
The chart below displays a bar chart for the Financials Select Sector SPDR Fund (ticker XLF) over the last four-plus years. As you can see, following a non-stop rally since October 2023, XLF finally pierced its all-time high from January 2021 - only to be turned back.
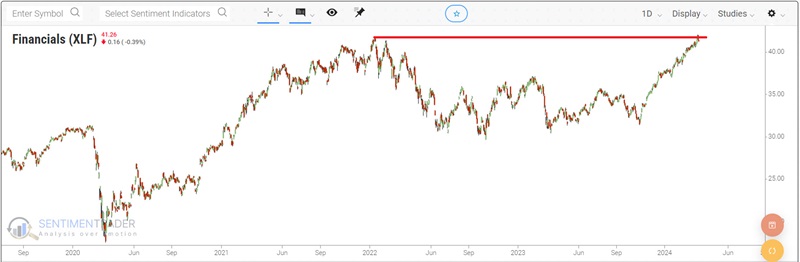
From a pure price analysis perspective, the outlook is relatively simple:
- Above the red line = GOOD
- Below the red line = BAD
At this point, the standard mode of analysis would be to "predict" whether or not XLF will break out above this obvious resistance point to meaningfully higher ground. We will take more of a "trading approach" than a "forecasting approach." The information below should not be interpreted to mean that price WILL break out to the upside. From our perspective, the information below merely suggests that IF price does break out to the upside, it should present a good entry point (also an entry point with an obvious stop-loss point, i.e., somewhere back below the red line, if a breakout fails).
A little-known signal from corporate insiders
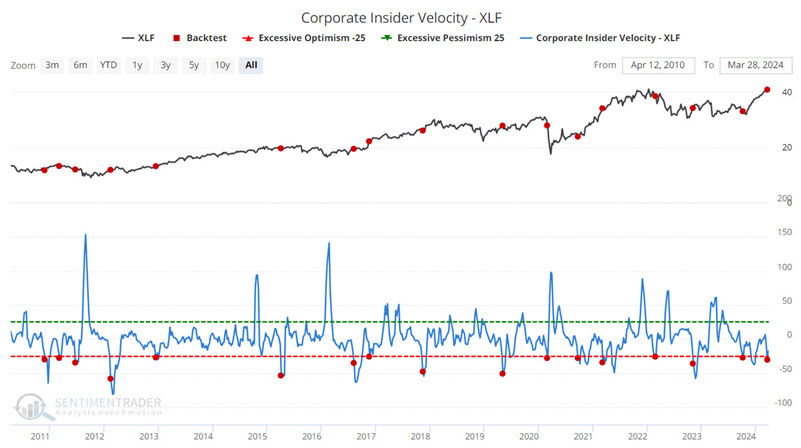
Our Corporate Insider Velocity indicator shows the velocity of corporate insider buying versus selling in XLF ETF (financial) stocks. It takes a 4-week rate of change for insider buys and subtracts a 4-week rate of change for insider sales. The chart below highlights those occasions when this indicator crossed below -25 for the first time in three months. The most recent signal occurred on 2024-03-18.
The tables below display a summary of XLF performance and signal-by-signal results.
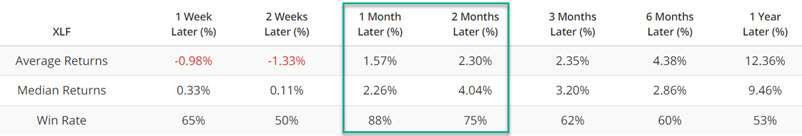
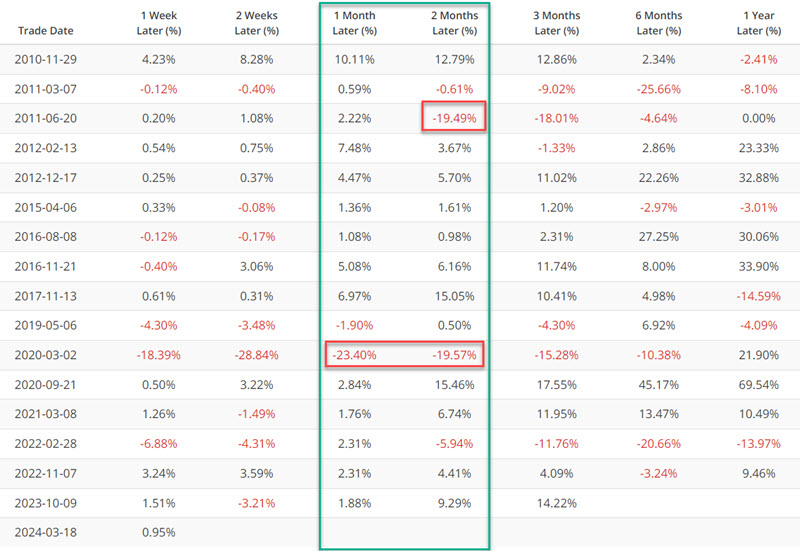
We see a favorable Win Rate for both 1 and 2 month periods following previous signals. That said, some of the signals that did not work out well (highlighted in red boxes) point out the importance of using this signal as "weight of the evidence" and not as a standalone model.
Seasonality has entered a favorable period
The chart below shows that XLF has entered a typically favorable seasonal period that extends from the close on Trading Day of the Year (TDY) #56 through TDY #88. For 2024, this period began on 2024-03-21 and extends through 2024-05-07.
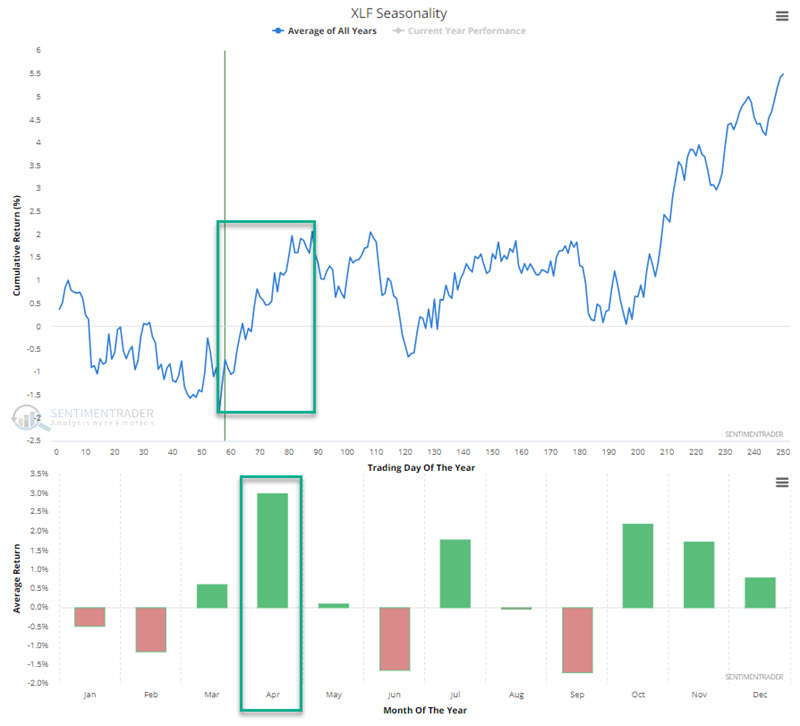
We can also see in the chart above that April has historically been the best month for financial stocks. Of course, that guarantees nothing on a year-by-year basis.
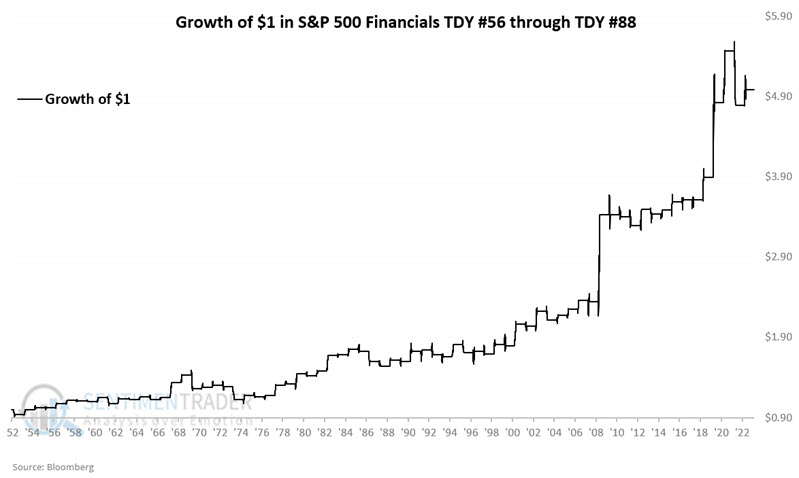
For testing purposes, we will use the S&P 500 Financial Index (which XLF attempts to emulate) starting in 1953. The chart below displays the hypothetical growth of $1 invested in the financials sector from TDY #56 through TDY #88 every year starting in 1953.
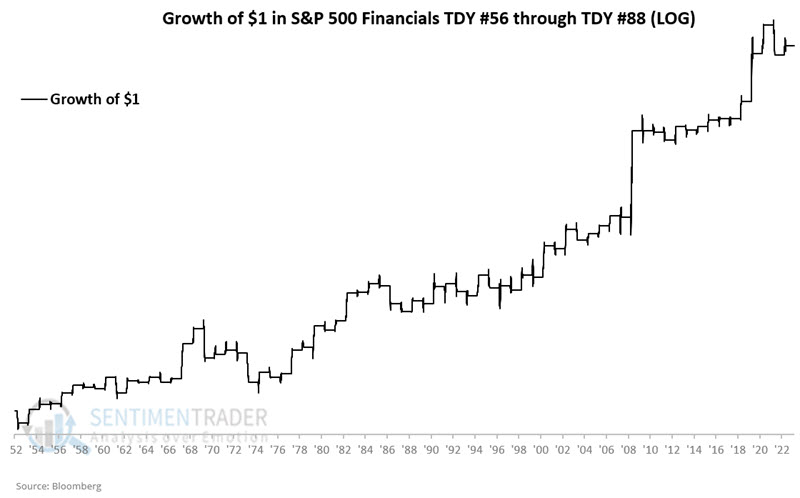
The chart below displays the same results on a logarithmic scale.
The table below summarizes the results.
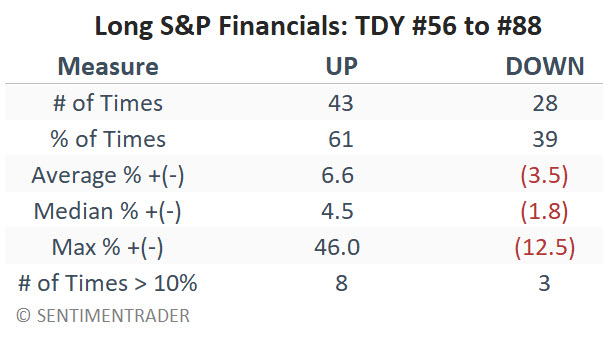
The key things to note in the information above are a) the clear long-term tendency for good performance but also b) the absolute lack of any guarantee on a year-to-year basis (61% Win Rate means roughly 2 out of every five years sees financials decline during this period).
Let's look at other factors that solidify the "buy the breakout if it happens" traders' mindset.
Breadth thrusts are still in play for financials
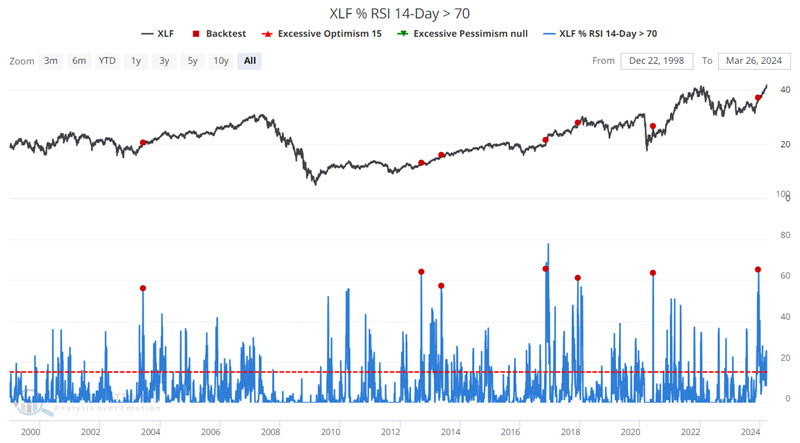
As the name implies, the XLF % RSI 14-Day > 70 indicator measures the percentage of XLF constituent stocks showing a 14-day RSI value of 70% or more. While a high reading intuitively suggests an "overbought" situation (with purportedly negative implications), the reality is quite different. "Breadth thrusts" - i.e., a situation where a stock or index exhibits a powerful thrust higher - have a long history of identifying good times to jump onto a newly established trend.
The chart below displays those dates when the XLF % RSI 14-Day > 70 indicator crossed above 56% for the first time in six months.
The screenshot below displays XLF performance results.
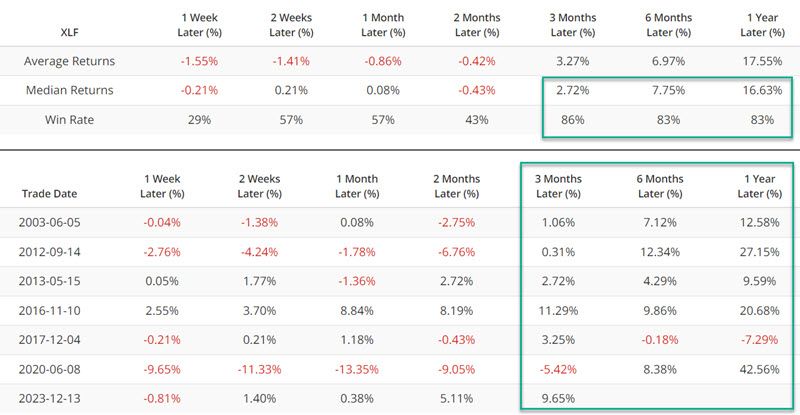
While the last signal occurred over three months ago on 2023-12-13, the critical thing to note is the favorable Win Rates for 3 to 12 months, and that following 5 of the previous six signals, XLF stood higher after 12 months than it did after three months. This, too, lends weight to the "buy the breakout if it happens" idea.
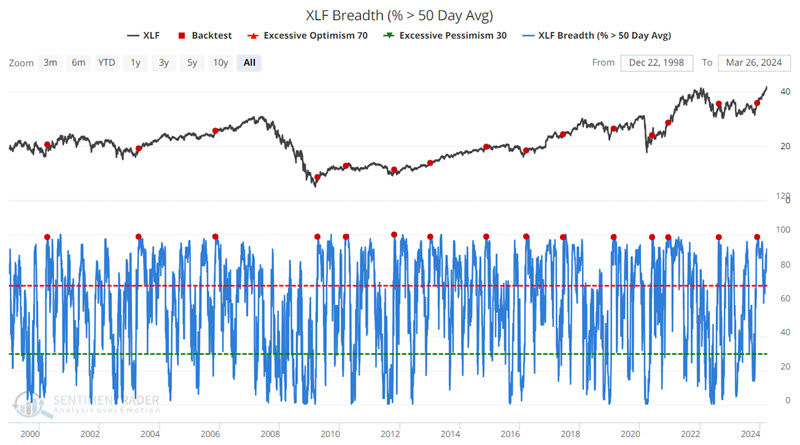
Similarly, the XLF Breath (% > 50 Day Avg) indicator measures the percentage of XLF constituents presently trading above their respective 50-day moving average. The chart below highlights those dates when this indicator crossed above 98% for the first time in six months.
The screenshot below displays subsequent XLF performance results.
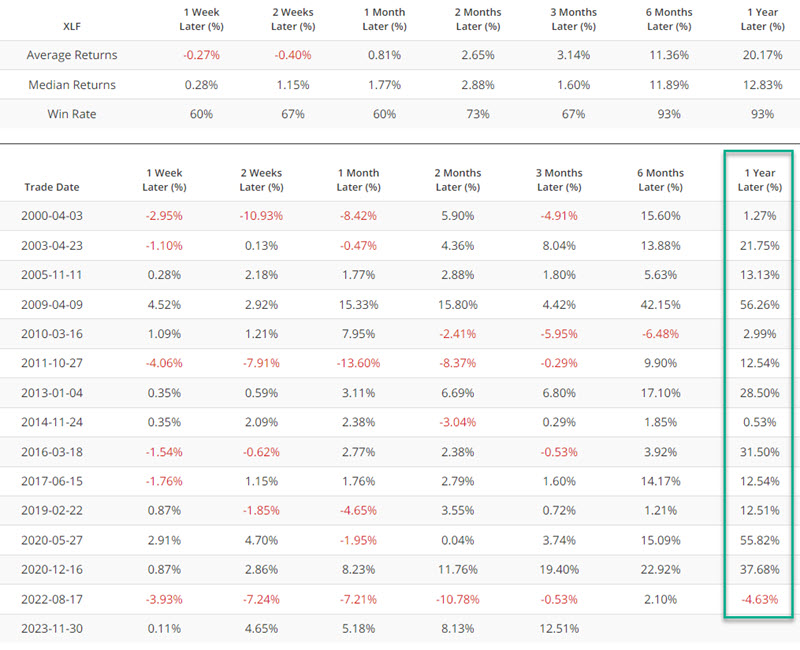
Note that XLF has already advanced +15% since the last signal on 2023-11-30. Still, we should note that XLF gained ground from three months after a signal to twelve months after a signal following 13 of the 14 previous signals.
Once again, this guarantees nothing but lends weight of the evidence to the favorable side of the ledger - particularly if XLF breaks out to a new all-time high.
Financial and S&P 500 after first all-time high after a 1-year low
Not surprisingly, the Financials sector also ended up on Dean Christians' radar. Dean generously provided me with the following charts that he had put together. These also show a history of suggesting strength for the financial sector during the two months after a signal.
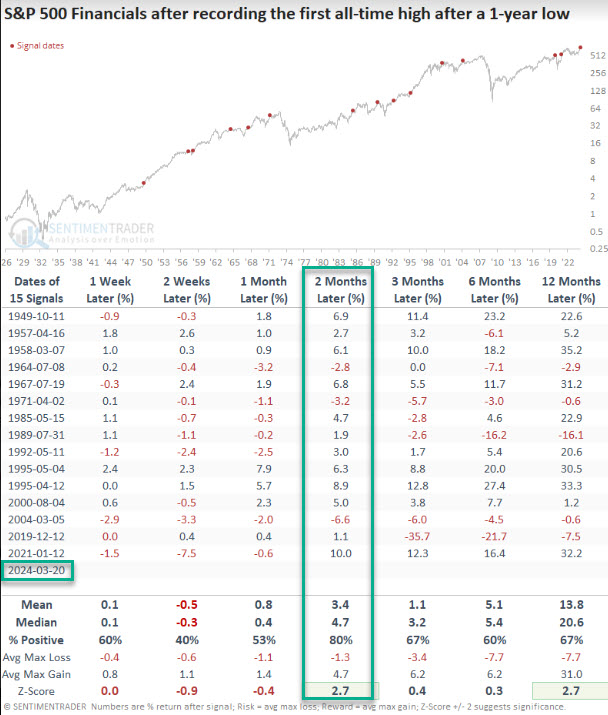
The first chart shows the performance of the S&P 500 Financials index after it makes a new all-time high for the first time after making a 1-year low. The two months after a signal has tended to show decent - and consistent - returns. The most recent signal occurred on 2024-03-20.
Dean's second chart touches on the performance of the broader market and shows the performance of the S&P 500 Index after the S&P 500 Financials index makes a new all-time high for the first time after making a 1-year low.
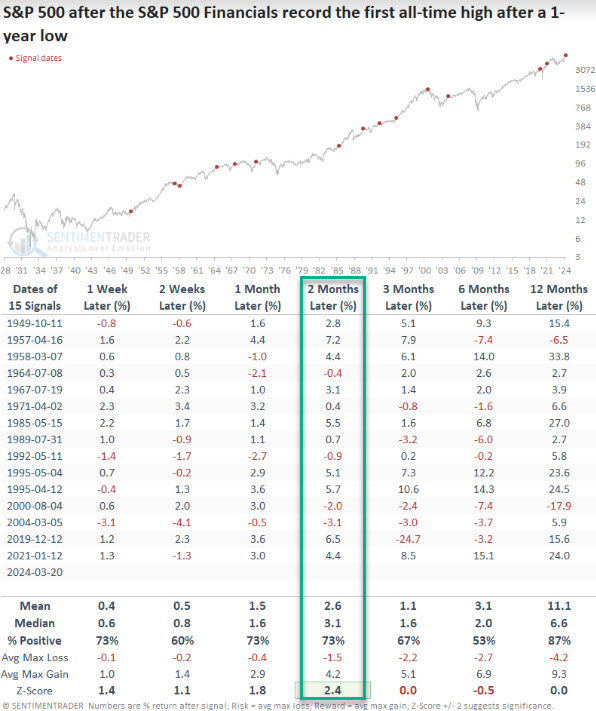
An examination of Dean's tables suggests that the S&P 500 Financials Index tends to outperform the broader S&P 500 Index during the two months after the described signal. This provides one more reason to watch ticker XLF closely for a breakout in the days and weeks ahead.
What the research tells us…
For a trader willing to jump in even in the face of an obvious overhead resistance level (and who is willing to place a stop-loss order within a reasonable distance of their entry price), the information above makes a compelling case for the "financial stocks will breakout to the upside" argument. Still, a more practical approach might be to wait for the actual breakout and then jump on board in anticipation of a run to higher ground. With this approach, a breakdown in price back below the current resistance level constitutes an obvious stop-loss point.