
Financials flash an important alert

Key Points
- The financial sector is one of the most important sectors, as strength or weakness in this sector often has a ripple effect
- The % of stocks in ticker XLF (Financial Select Sector SPDR Fund) making new 52-week lows recently crossed above 20%
- We look at result for a variety of sectors and markets following previous such occurrences
XLF New Lows above 20%
XLF New Lows % shows the percentage of stocks in the named exchange-traded fund (ETF) that are currently trading at a new 52-week low.
When the % of stocks held by ticker XLF rises above 20% it typically signals weakness and/or a breakdown in the sector. This can cause a ripple effect across a number of related markets and sectors.
What we will look for specifically is are rises above 20% that are not within 60 days of each other.
XLF
The figure below displays a chart of ticker XLF and highlights the times when XLF New Lows % was above 20% for the first time in 60 days and a summary of performance results.
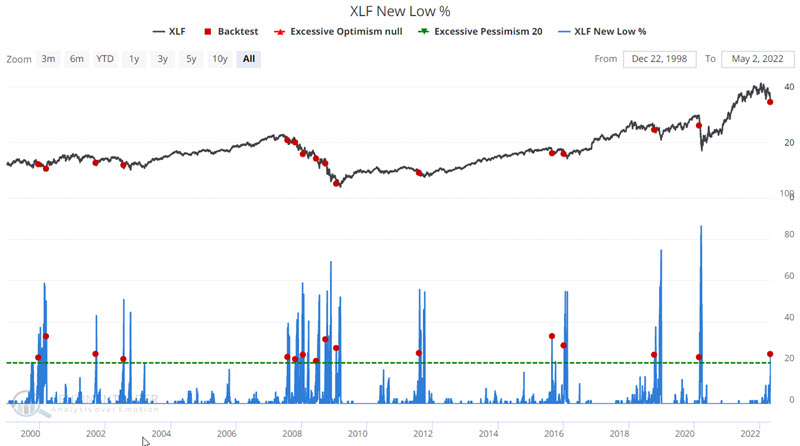
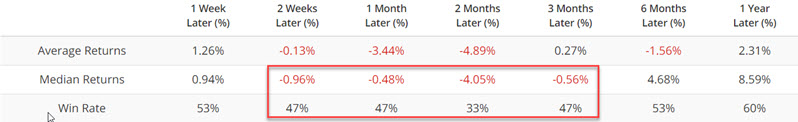
The key thing to note here (and for most of the other tickers that follow) is that while results cannot be categorized as "disastrous", they are extremely subpar and strongly suggest that a trader looking for a short-term opportunity should probably look elsewhere after XLF New Low % crosses above 20%.
For XLF, there has been weakness most notably between 2 weeks and 3 months after a signal.
SPY
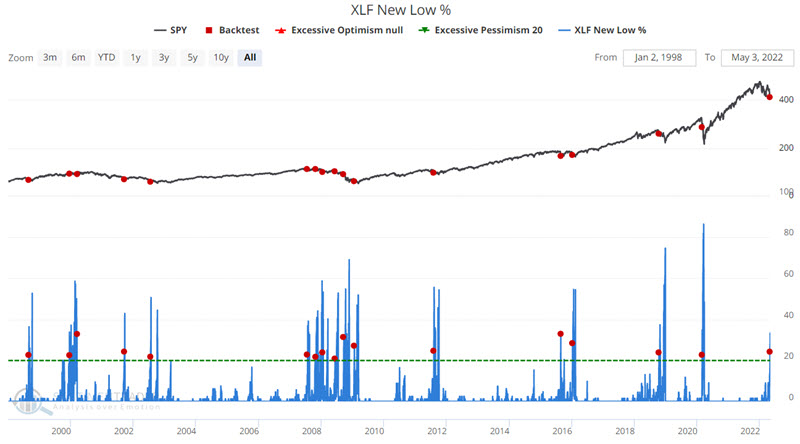
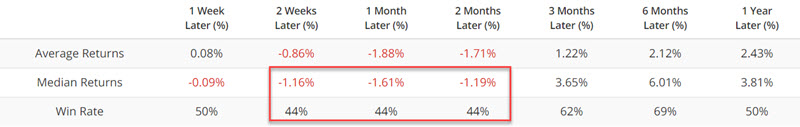
Now let's look at the impact on the broader market by looking at symbol SPY (SPDR S&P 500 ETF Trust). The figure below displays a chart of ticker SPY and highlights the times when XLF New Lows % was above 20% for the first time in 60 days and a summary of performance results.
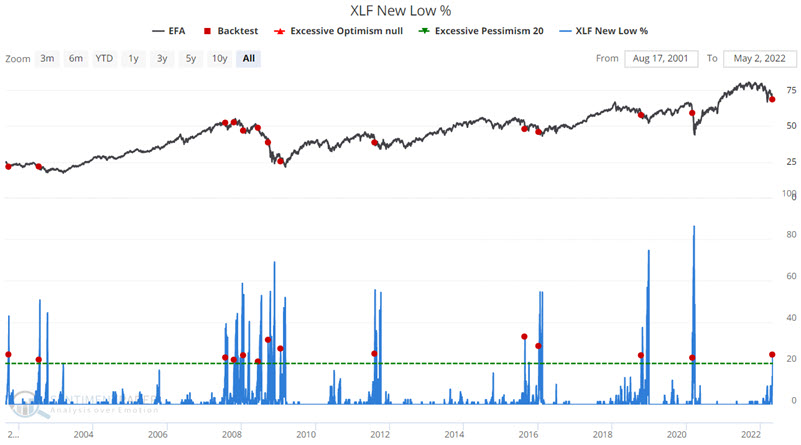
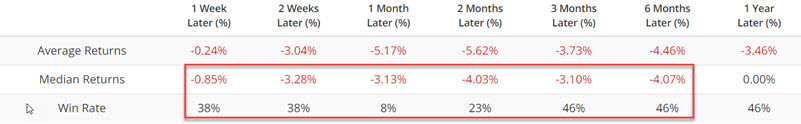
EFA
Now let's look at a broad international index. The figure below displays a chart of ticker EFA (iShares MSCI EAFE ETF) and highlights the times when XLF New Lows % was above 20% for the first time in 60 days and a summary of performance results.
Now let's look at some sectors that are heavily influenced by the action in the financial sector, and/or changes in interest rates.
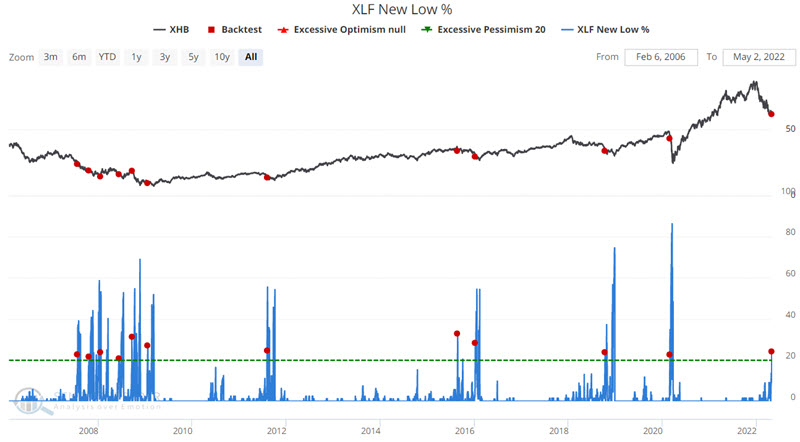
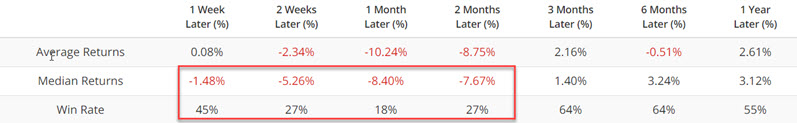
XHB
The figure below displays a chart of ticker XHB (SPDR S&P Homebuilders ETF) and highlights the times when XLF New Lows % was above 20% for the first time in 60 days and a summary of performance results.
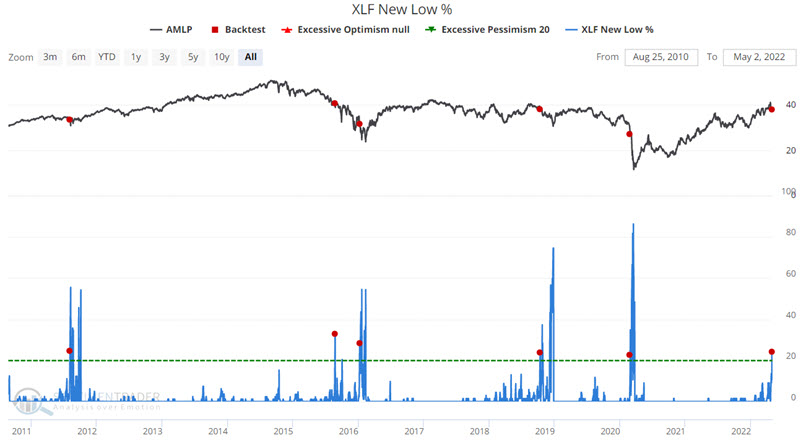
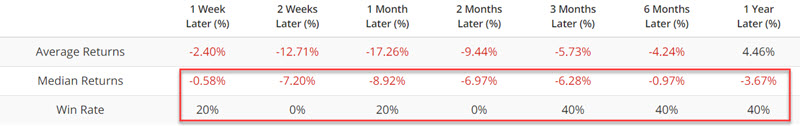
AMLP
The figure below displays a chart of ticker AMLP (Alerian MLP ETF) and highlights the times when XLF New Lows % was above 20% for the first time in 60 days and a summary of performance results.
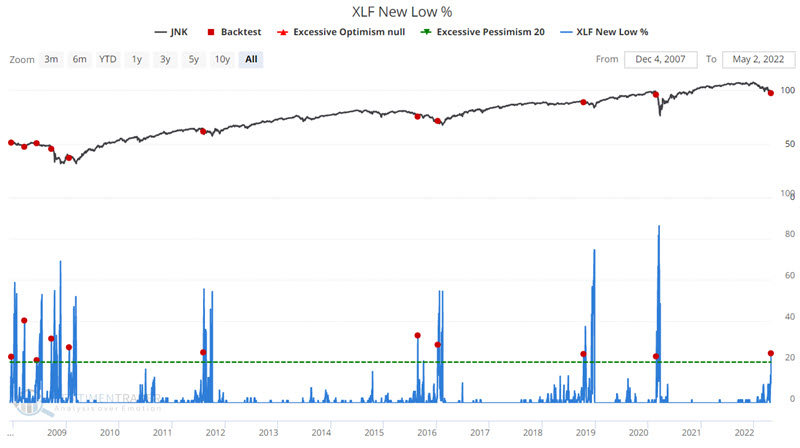
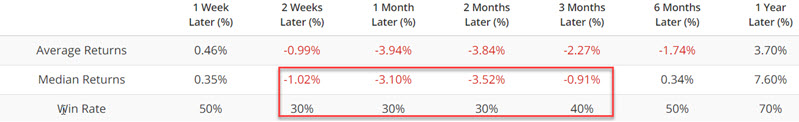
JNK
The figure below displays a chart of ticker JNK (SPDR Bloomberg High Yield Bond ETF) and highlights the times when XLF New Lows % was above 20% for the first time in 60 days and a summary of performance results.
So far, results have been pretty dismal. But an old adage states that "there's always a bull market somewhere." So now let's look at some areas that tend to react favorably to weakness in the financial sector.
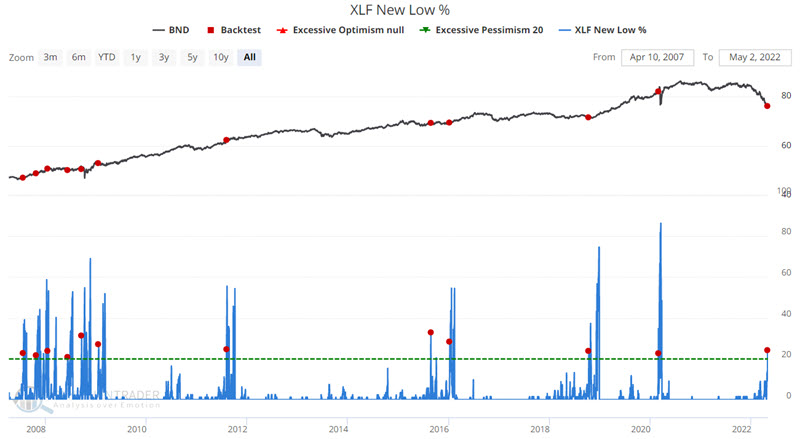
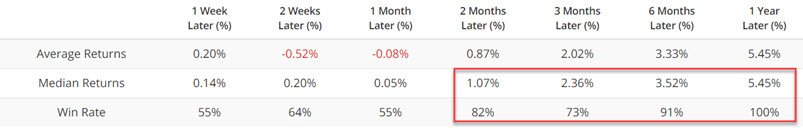
BND
The figure below displays a chart of ticker BND (Vanguard Total Bond Market Index Fund) and highlights the times when XLF New Lows % was above 20% for the first time in 60 days and a summary of performance results.
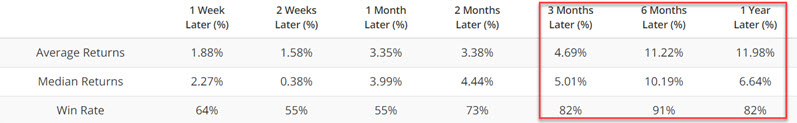
GLD
The figure below displays a chart of ticker GLD (SPDR Gold Shares) and highlights the times when XLF New Lows % was above 20% for the first time in 60 days and a summary of performance results.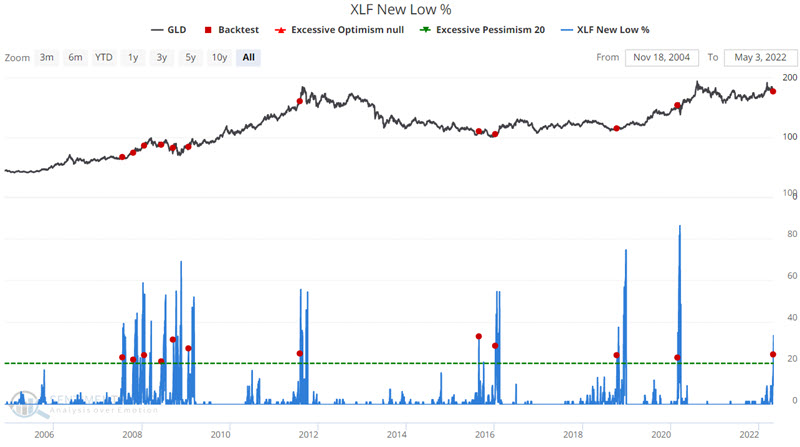
What the research tells us…
The old saying in life is that "when one door closes, another door opens." In the markets much hinges on the performance of the financial sector. When this key sector experiences significant new weakness it tends to cause a ripple effect across a variety of markets and sectors. A sign of weakness in the financial sector typically causes investors to reevaluate their holdings and generally results in short-term weakness in the stock market and slightly brighter prospects in other non-related areas.