
Financials are facing terrible sentiment and trend reversals

Key points:
- Less than a week ago, every Financial stock was trading above its 10-day average
- That has since reversed, with medium- and long-term breadth exceedingly poor
- There are compelling signs of positive long-term returns, especially with increasingly extreme pessimism
After a short-lived thrust, Financials are back to their bear market ways
Given the current focus on leverage in the financial system, this time in the U.K., traders are again worried about a repeat of the Global Financial Crisis.
No two panics are ever exactly alike, but the worry is always about the financial system for anyone who invested through that debacle. If there are systemic issues, they will probably appear in the Financial sector first.
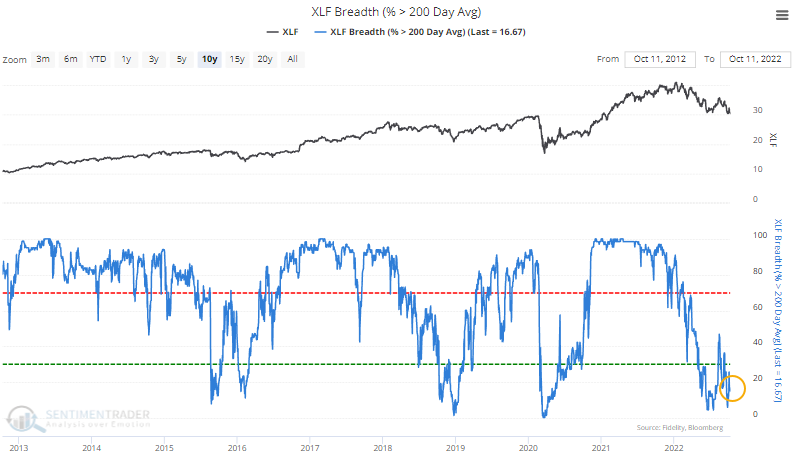
In that sector, stocks are doing what they always do in bear markets. Since February, consistently fewer than 60% of stocks in the sector have held above their 200-day moving averages.
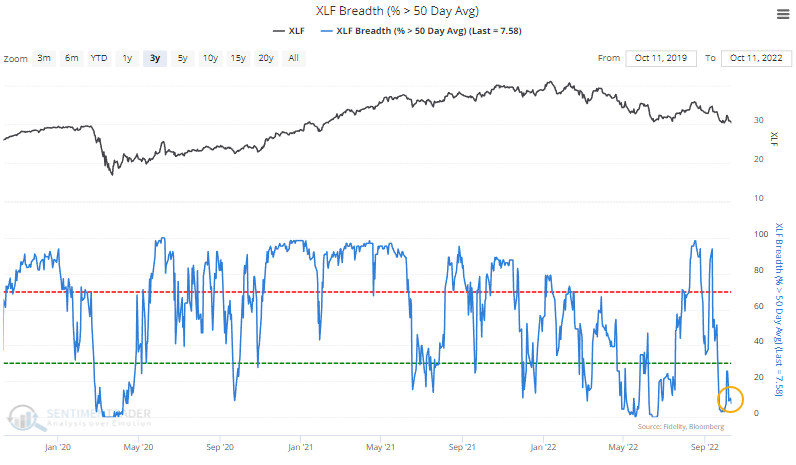
The same goes for even medium-term trends. Most of the stocks are again trading below their 50-day averages, but there have been volatile swings over the past few months.
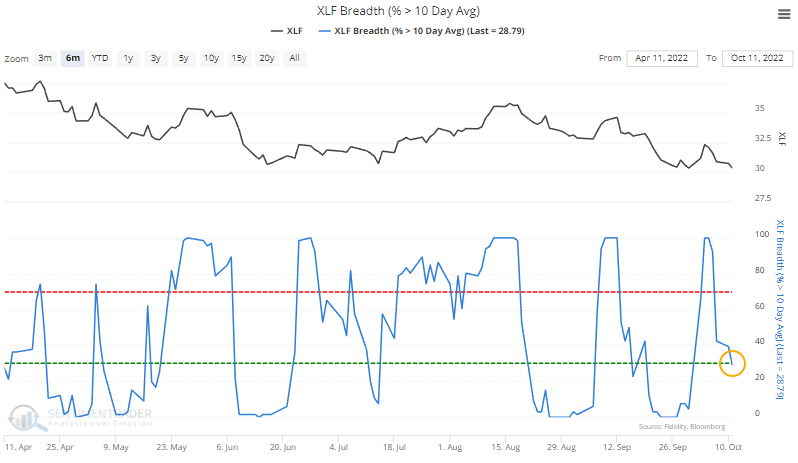
We can see that even more clearly in shorter-term trends. Not even a week ago, every stock in the sector was above its 10-day moving average. Now, fewer than 30% of them are.
Since 1990, there has been a quick about-face in short-term trends only a few times, including two just in the past couple of months. This also happened in 1997, 2011, and 2017, after which the total return in Financials was weak up to a month later, then excellent.
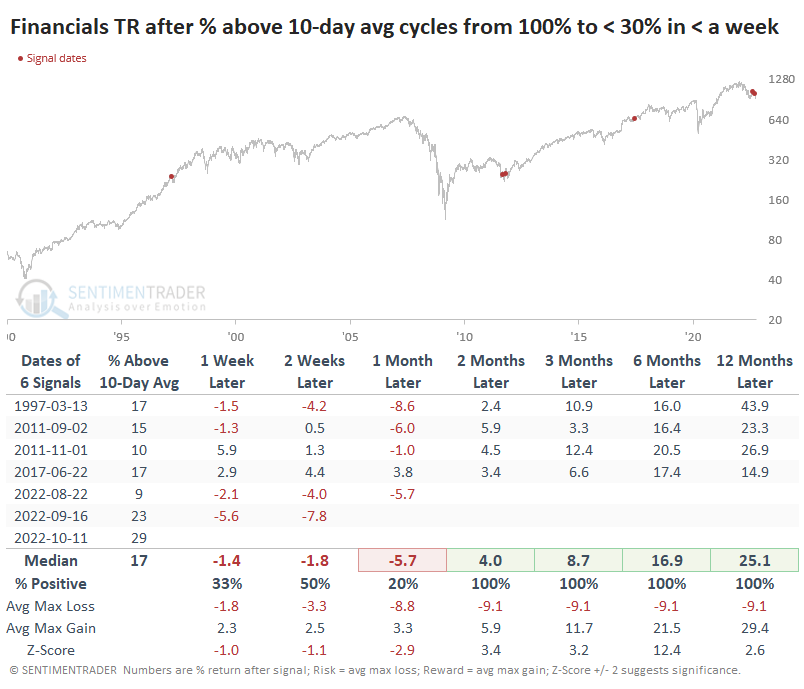
If we take a longer-term look (with less reliable data) before 1990, we can see the recent thrust in short-term trends despite poor medium- and long-term ones preceded mediocre returns for Financials in the short-term. But the sector showed excellent and consistent gains over the next 6-12 months.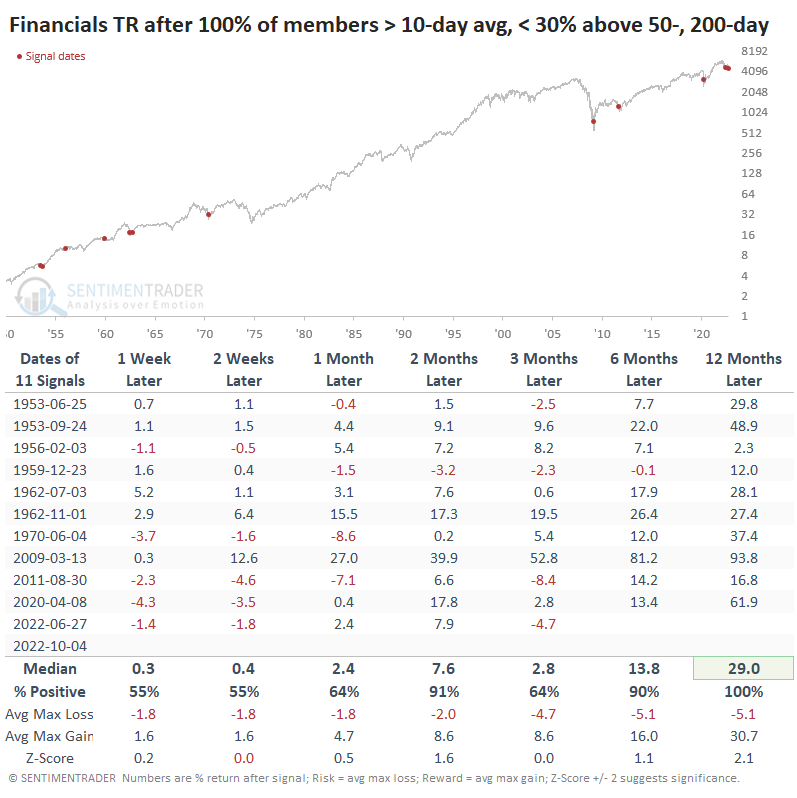
Poor trends have triggered terrible sentiment
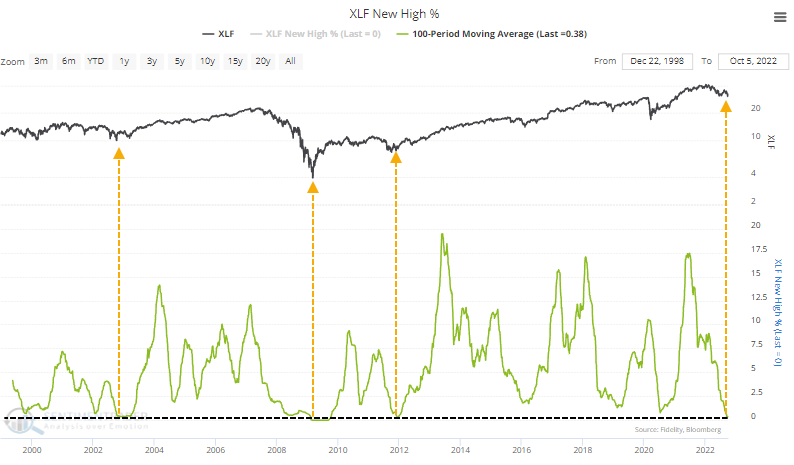
These swings in breadth come after a long drought of positive trends. Over the past 100 days, almost no Financials have managed to close at a 52-week high. On an average day over the past hundred sessions, only 0.38% of stocks in the sector closed at a new high. There have been only three similar droughts in the last couple of decades.
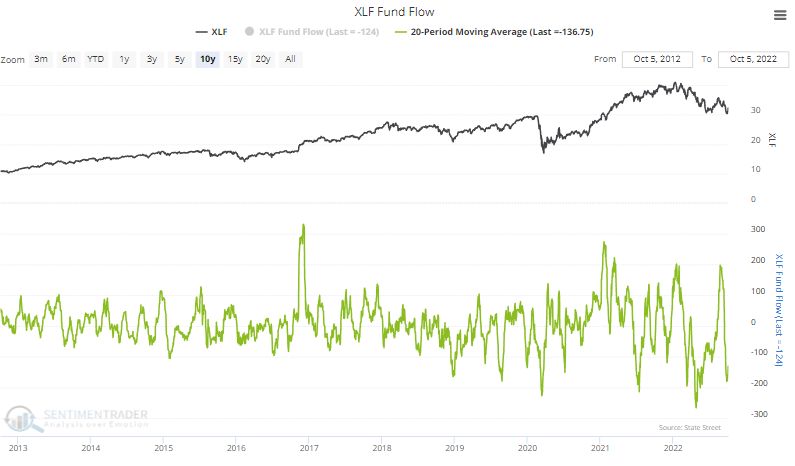
Investors have been leaving as a result. The 20-day average fund flow for the Financial Sector SPDR Fund (XLF) recently neared a $200 million outflow each day, among the worst since the fund's inception.
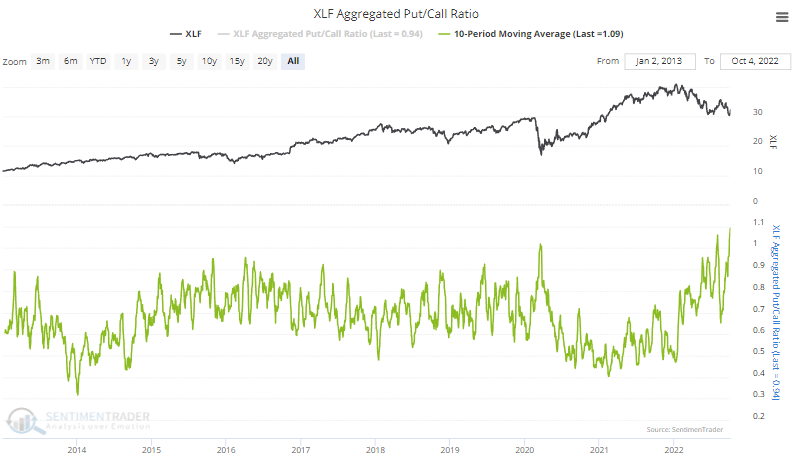
Not only are investors leaving, but options traders are betting heavily on more downside. Over the past ten days, the aggregate put/call ratio in Financials has spiked to a record high.
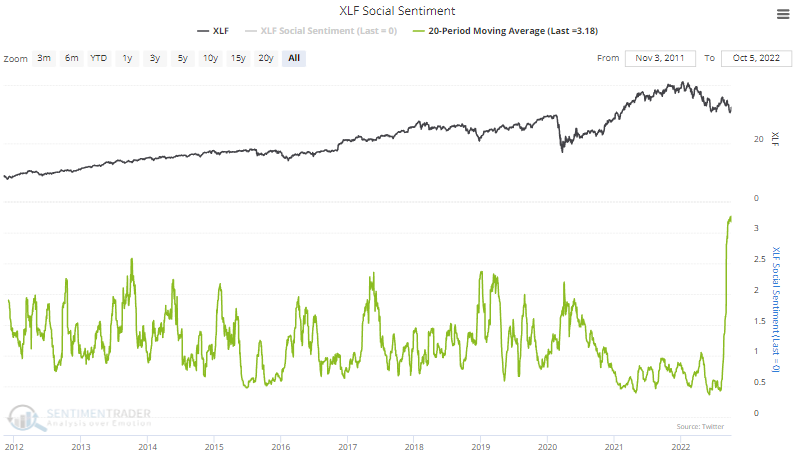
The chattering masses are even less enthused, with Social Sentiment spiking to a record of more than three bearish messages for every bullish one on an average day over the past month.
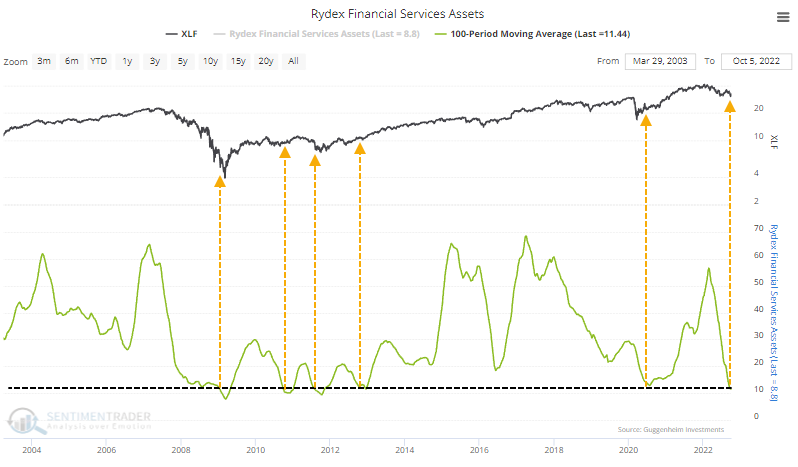
Two decades ago, we were one of the only services with an agreement with the Rydex family of mutual funds to show their asset flow data. At the time, they were about the only game in town offering leveraged funds, especially those that could be traded before the close.
They've lost their edge due to ETFs, but a loyal group of traders still use their funds, and they're still as much of a contrary indicator as they were 20 years ago. In the Financial Services fund, assets have dwindled to an average of barely $11 million over the past 100 days.
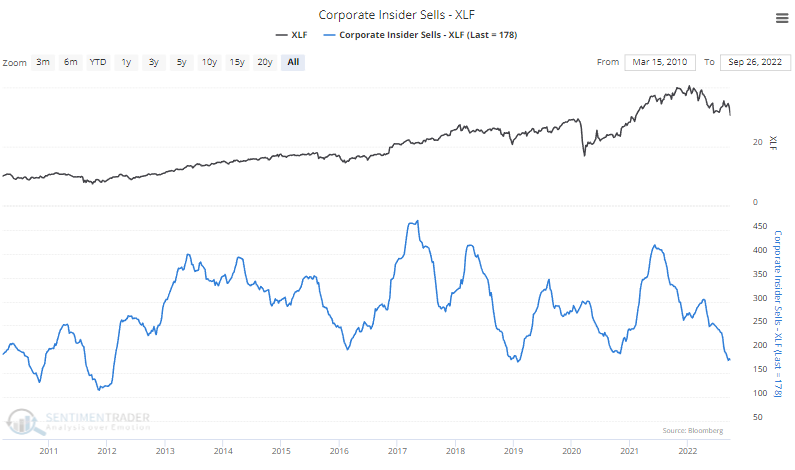
About the only group not interested in selling is corporate insiders. Open market sales among insiders in Financials have dropped to the 2nd-lowest level of the past decade.
What the research tells us...
Any dope with an internet connection can pull up a chart and see we're in a bear market. Almost all sectors are suffering the same fate, Financials among them, which is always a worry for anyone but the most newly-minted investors. There is no indication that it's over or that stocks in the sector are improving.
Despite the poor longer-term environment, the recent thrust (and decline) in very short-term trends is a modest positive for long-term returns, as is the increasing evidence that investors are giving up on ever seeing a bull market again. This is typically what long-term investors who want to add exposure should want to see. However, those with a lower risk tolerance are usually better served waiting for more solid evidence that the trends have started to reverse.