
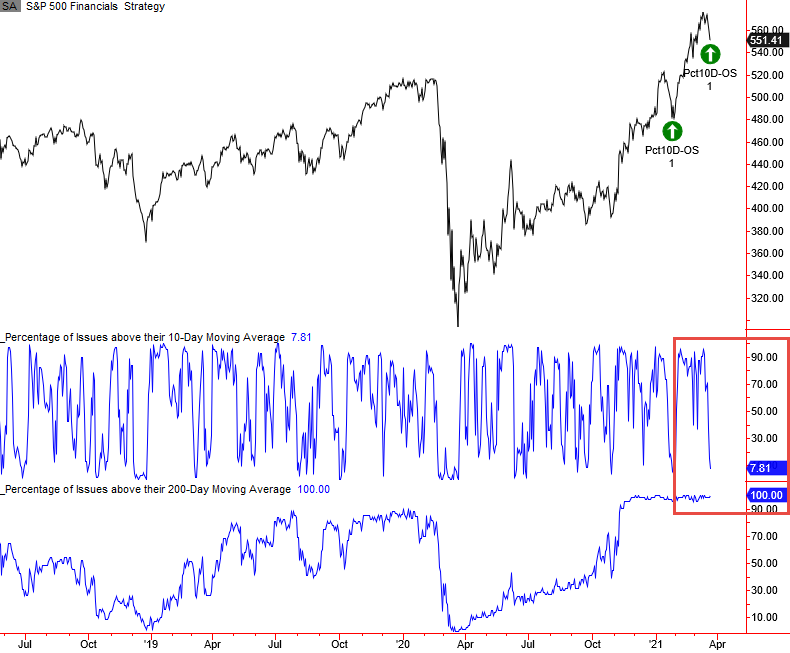
Financial Stocks - Oversold in an Uptrend

In a note last week, I shared a study on energy stocks that showed an oversold condition in an uptrend. A similar condition has now developed for the second time in less than 2 months for financial stocks. As of 3/23/21, I show 100% of financial stocks trading above their respective 200-day moving average and approximately 7.81% above the 10-day average.
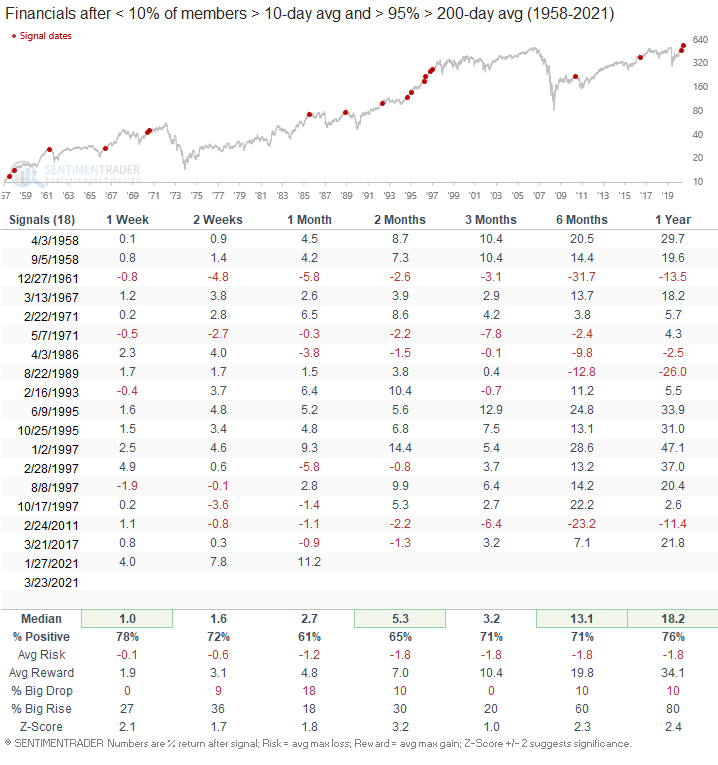
Let's conduct a study to examine forward returns when > 95% of members are above the 200-day average and less than 10% are below the 10-day average. By adjusting the thresholds, we can see more historical instances.
Current Financials Chart
Signal Performance
Except for 1961 and 1989, signal performance looks good. The risk/reward profile looks solid on almost all timeframes. I would also note that a cluster of signals leads to better outcomes. Please see the 1995-97 period.
Yield Curve with Oversold Signals
When I review trading signals for financial stocks, I like to overlap the instances on a yield curve chart. 2011 is a good example of an oversold condition in an uptrend that failed. The 10-year to 3-month yield curve contracted by almost 30 bps over a 2-week period before the signal on 2/24/11.
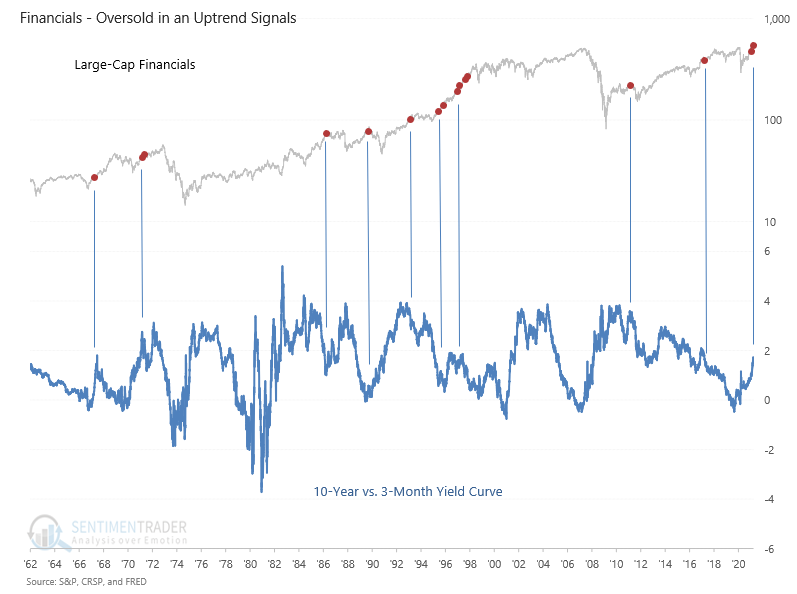
Conclusion: The Fed has indicated that they are in no rush to raise rates. Therefore, all else equal, the curve should remain in a position that benefits financials. Watch the yield curve.