
Financial conditions are still loose

Key points:
- Stock and bond investors got a scare last week as prices dripped
- While that is a sign and symptom of tightening financial conditions, overall conditions are loose and loosening further
- Under these conditions, stock prices have an enormous tailwind
Financial conditions are still loose
After six months of a stairstep pattern of rising stock prices, investors last week got a rude reminder that there are, in fact, two directions prices can go.
While rising interest rates probably played a big part in the pullback, assigning reasons for some volatility is more guesswork than anything. If you listen to the macroeconomic doomers, this is just the tip of the iceberg (again!) as stocks tumble (again!) due to a looming economic disaster (again!).
One of the first places that looming disaster will appear in economic reports is tightening financial conditions. There are many such measures, but most follow a similar methodology. They look at broad groups of financial, economic, and credit indicators to determine whether overall conditions are getting better (looser) or worse (tighter).
There is no need to subscribe to any expensive financial service to obtain this data. One of the best is provided free by the Chicago Fed in their National Financial Conditions Index:
The Chicago Fed's National Financial Conditions Index (NFCI) provides a comprehensive weekly update on U.S. financial conditions in money markets, debt and equity markets, and the traditional and "shadow" banking systems. Because U.S. economic and financial conditions tend to be highly correlated, we also present an alternative index, the adjusted NFCI (ANFCI). This index isolates a component of financial conditions uncorrelated with economic conditions to provide an update on financial conditions relative to current economic conditions.
The two versions are closely correlated, and it probably doesn't make any difference which one to use, but here, we use the adjusted version of the index.
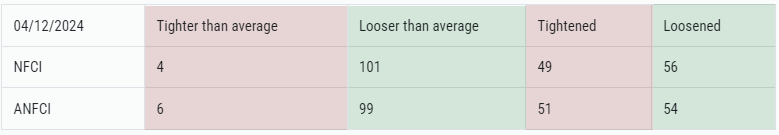
In the latest release, which is delayed for the public by a week, we can see that while some issues with stocks weren't fully reflected in the data, the vast majority of inputs are not only looser than average, they are loosening more than tightening.
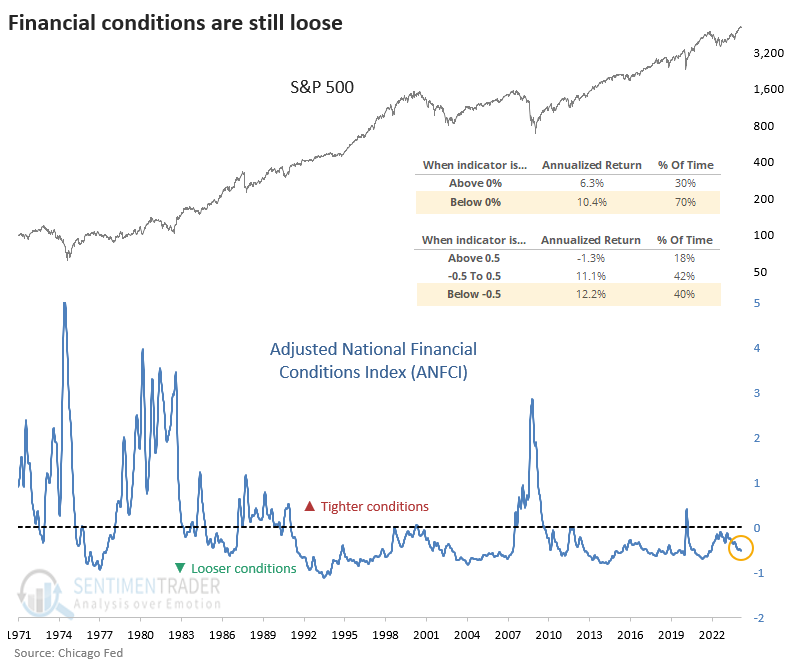
The chart below shows the ANFCI against the S&P 500 over the past 50 years. The chart shows that when the index is below zero, the S&P 500 has returned an annualized +10.4%, versus only +6.3% when the index is above zero.
And when it is below -0.5, which it was as of the latest reading, the return rises further to +12.2%. When it was above +0.5, the S&P's returns cratered to -1.3%. So, it's no surprise that the looser the conditions, the better it was for stocks.
It's important to note that using data like this can be tricky since if you're not careful, you can be misled by look-ahead bias. For all returns here, we don't assume perfect knowledge. Since the data is delayed by a week for the public, we only look at the figure from the week prior and not the current week since, as an average investor, we wouldn't know the current week's value until next week.
Looking at it another way, an investor would have done exceptionally better by holding only stocks when conditions were loosening than when they were tightening. There are numerous ways to determine those conditions, but here we'll test a couple of simple methods that anyone could follow.
Loose conditions = good for investors
We'll look at what happens to stocks when the ANFCI is above or below various weekly moving averages and its rate of change over various periods. The table below shows how $10,000 invested in the S&P 500 would have grown since 1971 using various periods for each strategy.
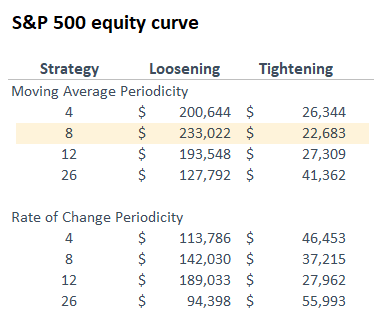
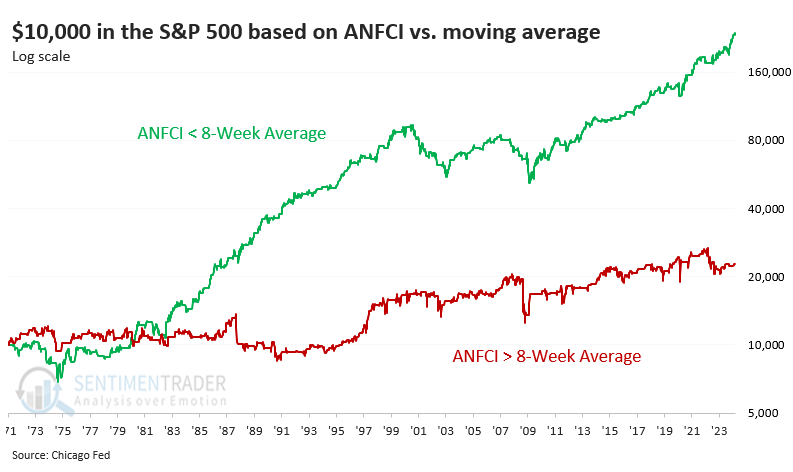
The most significant difference in returns was using an 8-week moving average. So, we'll hold the S&P for the next week only if the ANFCI is below its 8-week average (showing loosening financial conditions). We'll sit in cash if it's above its 8-week average (tightening conditions). We're assuming no return on cash.
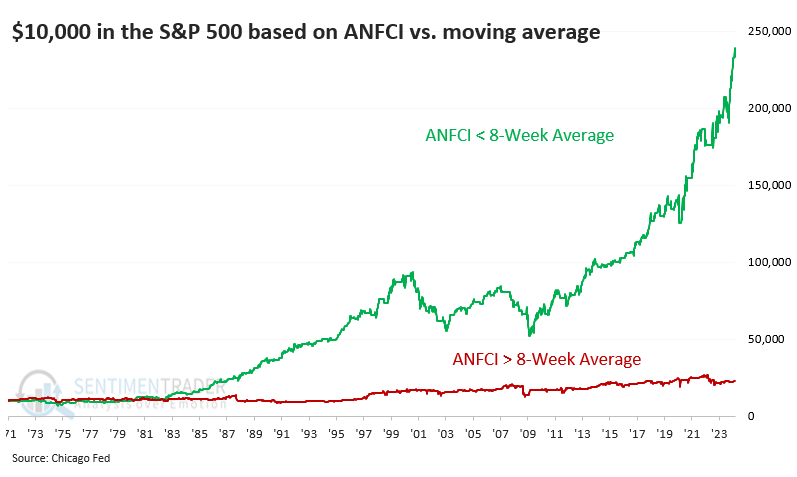
Using this method, an investor's $10,000 would have turned into $233,022 during loosening conditions but only $22,683 when conditions tightened. They would have still suffered some drastic drawdowns, so it's not like it was a no-risk ride to utopia. However, it is a reminder that as long as conditions are loose - especially if the trend is still loosening - forward returns tend to be drastically better.
For sticklers, here's the same chart using a log scale.
What the research tells us...
Every Wednesday morning, the Chicago Fed updates the public on its model of financial conditions. This week, it will be interesting to see how a dip in stock and bond prices may have affected these conditions, but those are only some of the inputs into a comprehensive model.
So far, it appears that it would take a much broader and more severe drop across the spectrum to reflect tightening economic conditions, and we're very far from a scenario where those conditions could be considered objectively tight. As long as that's the case, stocks have a favorable tailwind.