Products
SentimenTrader Trading Tools
‍
Backtest Engine
My Trading Toolkit
Correlation Analysis
Seasonality
Market Prediction
Indicators & Data API
‍
Proprietary Indicators & Charts
Market Data API
Strategies & Scanner
‍
50+ Trading Strategies
Smart Stock Scanner
Smart Option Scanner
Research Reports
‍
Research Solutions
Reports Library
Free Resources
Simple Backtest Calculator
Simple Seasonality Calculator
The Kelly Criterion Calculator
Sentiment Geo Map
Public Research Reports
Education
Sentiment Indicators
Technical Indicators
Pricing
Company
About
In the News
Testimonials
Client Success Stories
Contact
Log inLoginSign up
< BACK TO ALL REPORTS

Few industries have escaped severe selling pressure

Dean Christians
2022-09-30
Stocks have been under severe selling pressure of late, propelling several breadth-based series to new extremes for the cycle. More than three-fourths of sub-industry groups are at least 20% off their peaks, suggesting the selling may be overdone in the near term.

Key points:

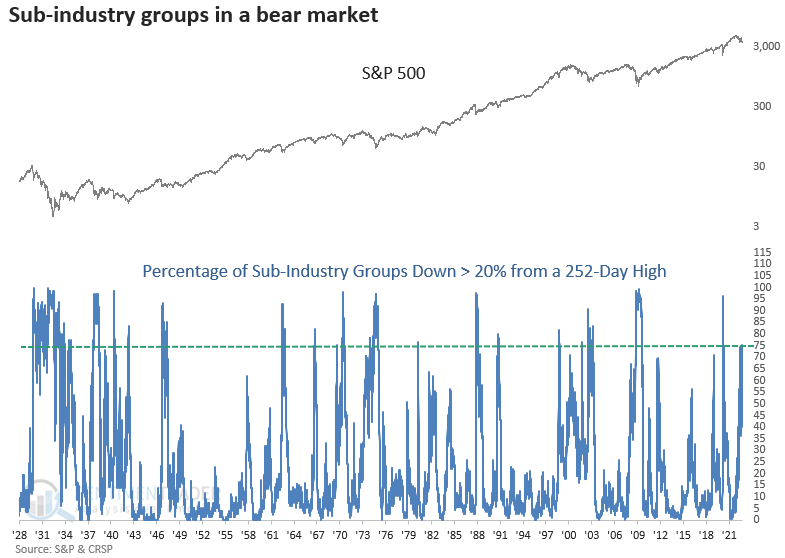
  • More than 75% of sub-industry groups have declined > 20% from a 252-day high
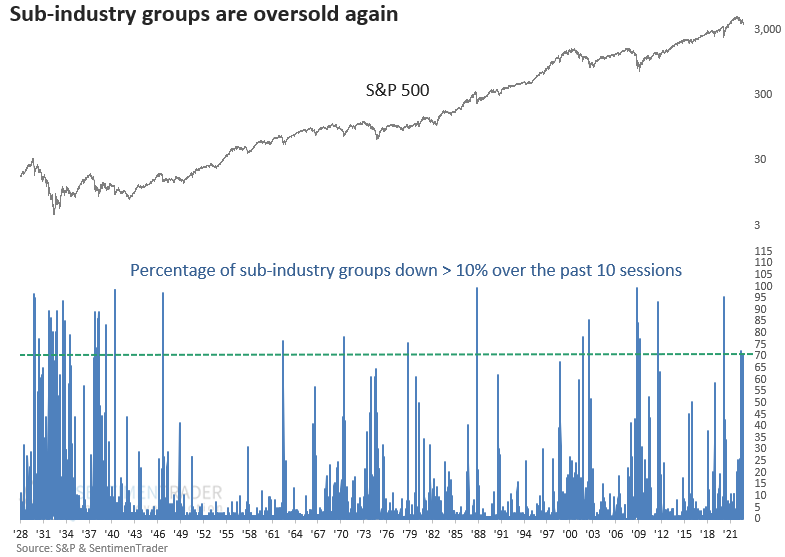
  • Over a 10-session period, more than 70% of sub-industry groups declined > 10%
  • After similar bouts of selling pressure in a bear market, stocks tended to bounce in the near term

A potential counter-trend rally after another stretch of selling pressure

This week, the S&P 500 fell to a new cycle low on a closing and intraday basis. Few industries have been spared.

The selling pressure pushed several breadth indicators to new lows (or highs, depending on the series). One of those is the percentage of sub-industry groups down 20% or more from a 252-day high. That exceeded the previous extreme from June.

For only the 18th time since 1929, the percentage of sub-industry groups down 20% or more from a high has exceeded 75%. I screened out repeats by requiring the indicator to fall below 15% before a new alert could occur again.

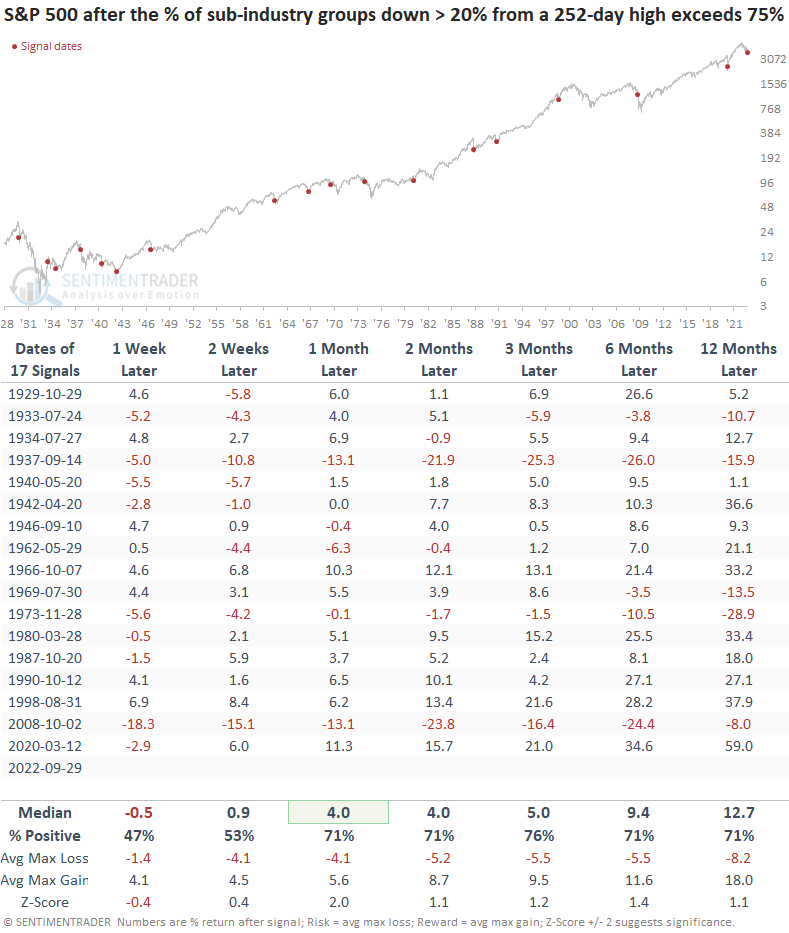
Similar readings preceded near-term bounces

After this many sub-industries fell into bear markets, the S&P 500 struggled over the next week.

However, a month later, the S&P 500 was higher 71% of the time with a favorable z-score. The two outlier signals occurred in 1937 and 2008. So, cash is king if you think we're about to have a Lehman event. 

An indicator that measures short-term selling pressure

On Monday, more than 70% of sub-industry groups' declined by 10% or more over the past 10 sessions. The short-term selling pressure has now occurred twice, with the other instance triggering on June 16, which marked the low for a powerful multi-month counter-trend rally.

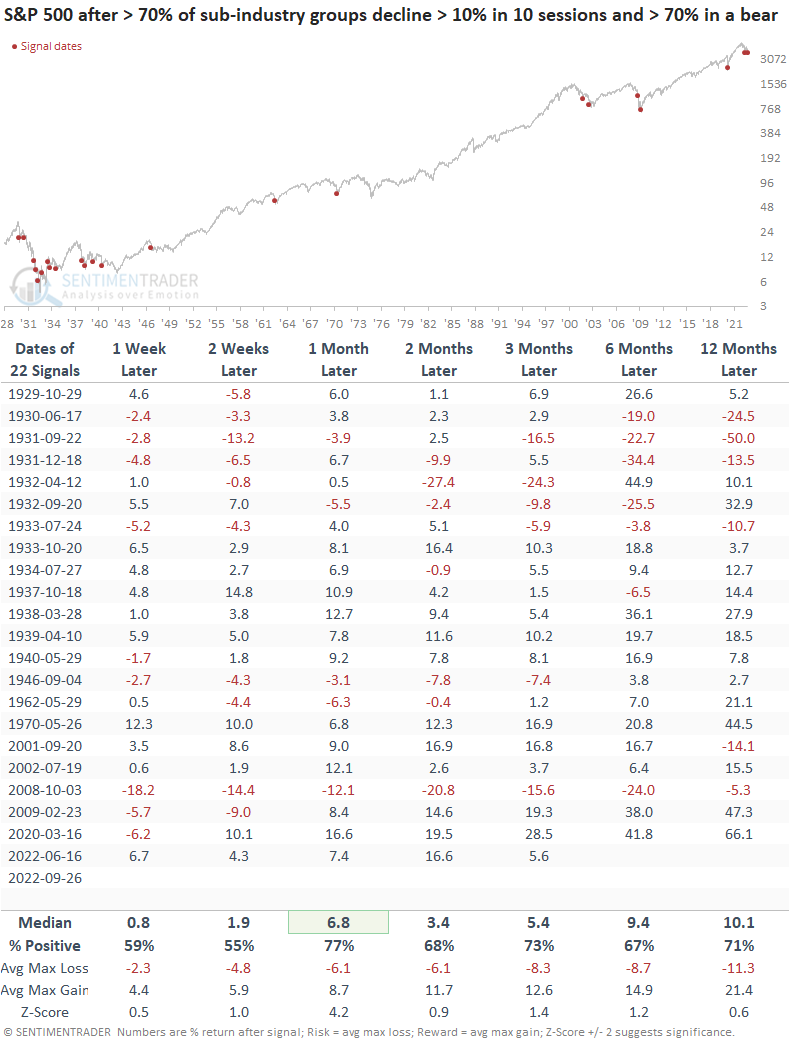
Suppose we combine the two sub-industry group series, using a threshold of 70% for both indicators. In that case, the outlook improves, especially in the near term. A month later, the S&P 500 was higher 77% of the time with an excellent z-score. Once again, a 2008 type of free fall is the risk if you think something is about to break.

What the research tells us...

As we close out the 3rd quarter, stocks continue to struggle as the Federal Reserve tightens financial conditions with one of the most aggressive hiking cycles in history. The selling has pushed several breadth-based indicators to new extremes. After similar bouts of short-term selling pressure within a severe bear market environment, stocks tend to bounce, especially a month later.

PRODUCTS
SentimenTrader
Trading Tools
Indicators & Data API
‍
Strategies & Scanner
‍
Research Reports
FREE
RESOUrCES
Simple Backtest
Calculator
Simple Seasonality
Calculator
The Kelly Criterion
Calculator
Sentiment Geo Map
‍
Public Research Reports
‍
Education
Sentiment Indicators
‍
Technical Indicators
‍
Pricing
Bundle pricing
‍
FAQ
‍
Announcements
‍
COMPANY
‍
About
‍
In the News
‍
Testimonials
‍
Client Success Stories
CONTACT
‍
General Inquiries
‍
Media Inquiries
‍
Financial Professionals Inquiries
‍
© 2026 Sundial Capital Research Inc. All rights reserved.
Setsail Marketing
TermsPrivacyAffiliate Program
Risk Disclosure: The information and tools provided are for research and analytical purposes only and are not intended as investment advice. Market analysis involves uncertainty, and outcomes may differ from expectations. Users should conduct their own due diligence and consider their individual circumstances before making any financial decisions. Past performance is not necessarily indicative of future results.

Hypothetical Performance Disclosure: Hypothetical performance results have many inherent limitations, some of which are described below. No representation is being made that any account will or is likely to achieve profits or losses similar to those shown; in fact, there are frequently sharp differences between hypothetical performance results and the actual results subsequently achieved by any particular trading program. One of the limitations of hypothetical performance results is that they are generally prepared with the benefit of hindsight. In addition, hypothetical trading does not involve financial risk, and no hypothetical trading record can completely account for the impact of financial risk of actual trading. for example, the ability to withstand losses or to adhere to a particular trading program in spite of trading losses are material points which can also adversely affect actual trading results. There are numerous other factors related to the markets in general or to the implementation of any specific trading program which cannot be fully accounted for in the preparation of hypothetical performance results and all which can adversely affect trading results.

Testimonial Disclosure: Testimonials appearing on this website may not be representative of other clients or customers and is not a guarantee of future performance or success.