
Fear returns to average

Key points:
- The VIX cycled from under 12 to above 18 in recent weeks
- Similar cycles preceded strong returns in stocks over the next 3-6 months
- The VIX rarely continued to rise much higher without a major external catalyst
A return to normal levels of fear
After a historically long stretch of calm and uncorrelated conditions, fear levels returned to normal in less than a calendar month.
The VIX "fear gauge" cycled from suppressed levels under 12 to jump above 18 last week, slightly exceeding its median value since 1986. Other times the indicator went from under 12 to above 18, it took an average of 24 trading days, as opposed to 29 days this time around, so we're right about average.
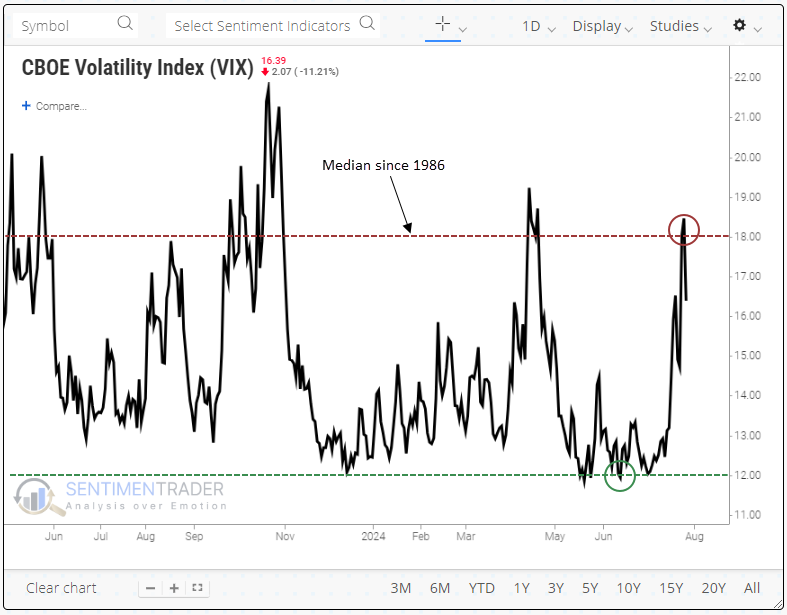
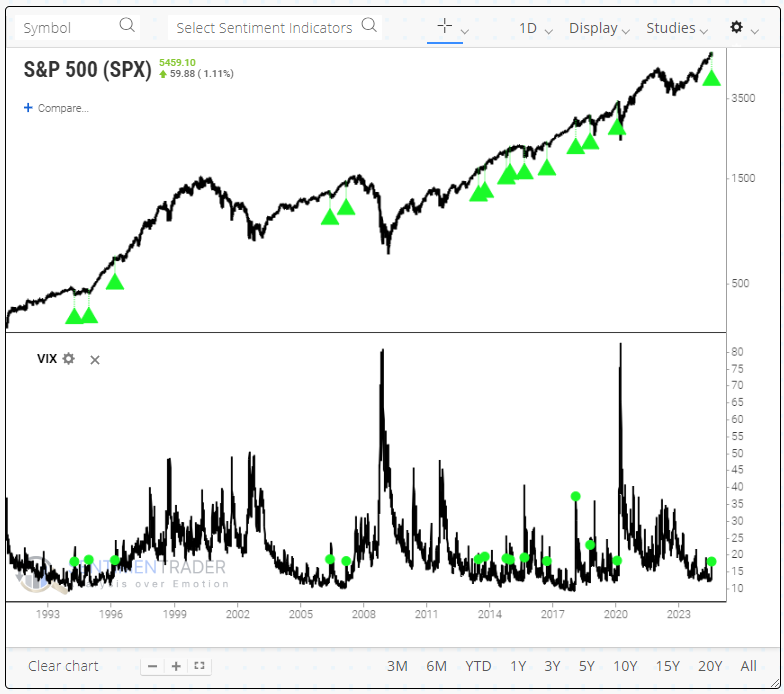
The indicator has behaved this way about a dozen times, the last one being in 2020 as we were sliding into the pandemic panic. The chart below highlights those dates when the closing level of the VIX went from below 12 to above 18.
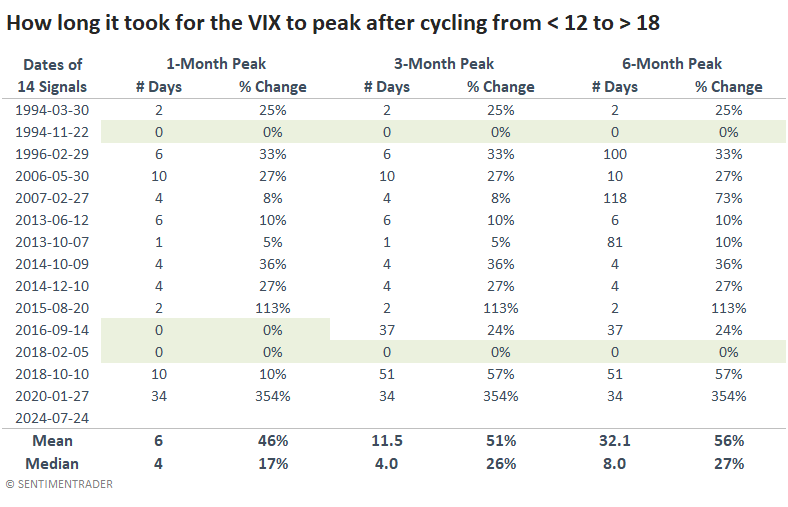
Regarding the VIX, the concept of "average" is tricky because although it is a mean-reverting data series, it is highly skewed in one direction. Still, on average, it took the VIX another week or so before peaking after it cycled from low to median levels.
The table below shows the number of trading days and percentage change before the VIX peaked for the next 1, 3, and 6 months. These are using closing levels, not intraday highs.
There were three dates when these cycles ended up being the peak for the next month. Based on how markets have acted the last couple of days, our current one could be the fourth. But on average (using the median), it took four days and another 17% rise before it formed at least a 1-month peak.
We can use Backtest Engine 2.0 to see how markets performed after these cycles in the VIX (click here to load the test, then click the Run Backtest button).
For the S&P 500, returns were modestly better than random in the short term and gradually improved over the ensuing months. Over the next 6-12 months, returns and consistency were well above any random time, with only minor losses, if any.
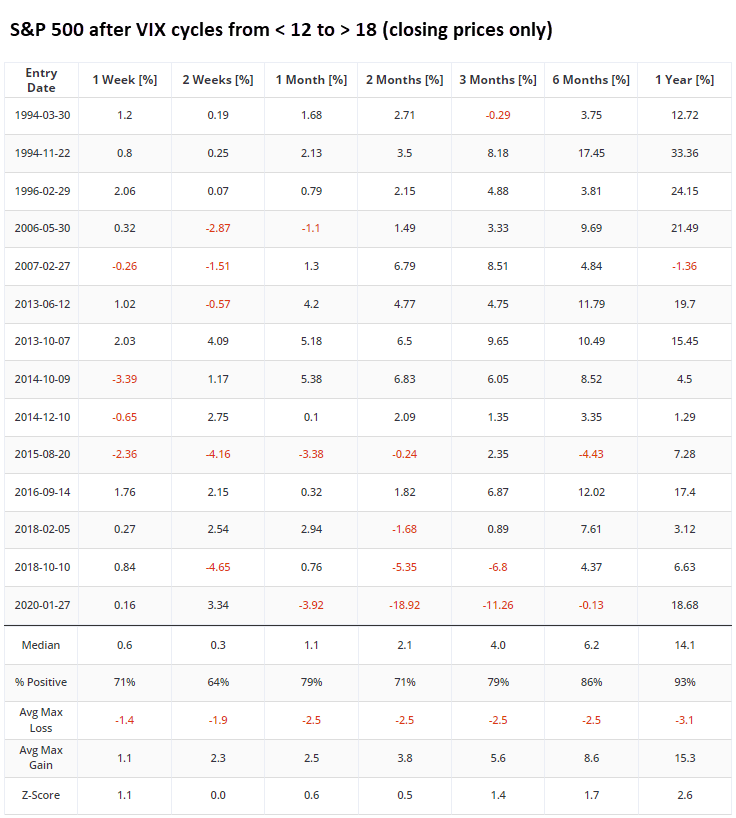
If you use the Backtest Engine to run the test, you can click the Max Gain and Loss tab to view a table of maximum gains and losses across time frames. It shows that within the next three months, there were only three signals when the S&P lost more than -3.5%. Each of them was quite painful and unfolded quickly.
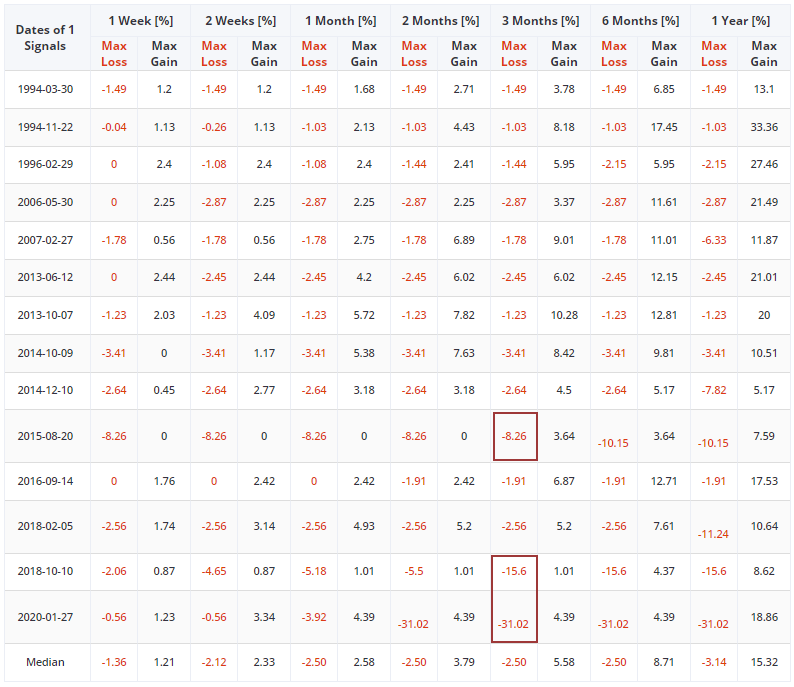
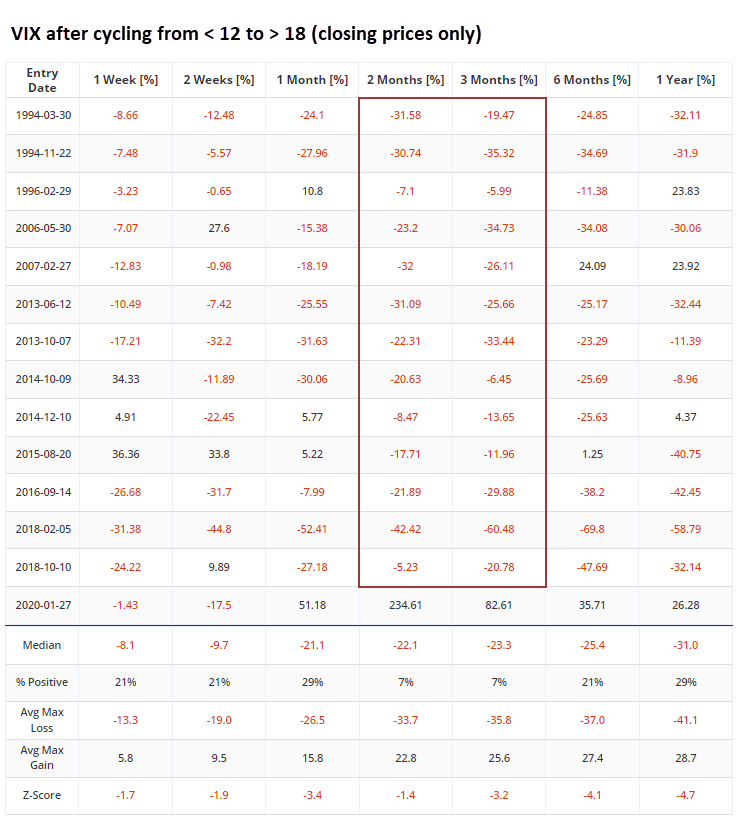
Trying to buy the VIX or its related products after it has already spiked has always been a dicey proposition. The best time to buy hedges is when nobody wants them, not after they've become front of mind again. The only signal when the VIX showed a gain 2-3 months later was during the pandemic shutdown.
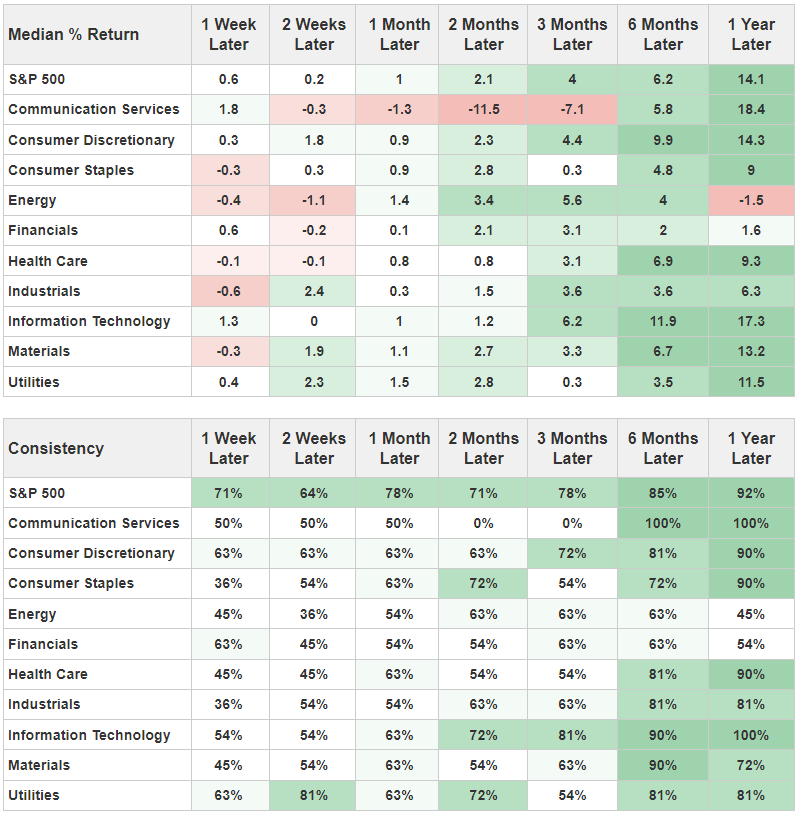
Click the Major Sectors tab to see how the ten main sectors performed after these VIX cycles. As investor fear started to ebb again, discretionary and technology stocks performed well.
No reset
Looking at cycles provides important context because it lets us understand how investors behave after a market shift from one regime to another. But it also restricts the sample sizes.
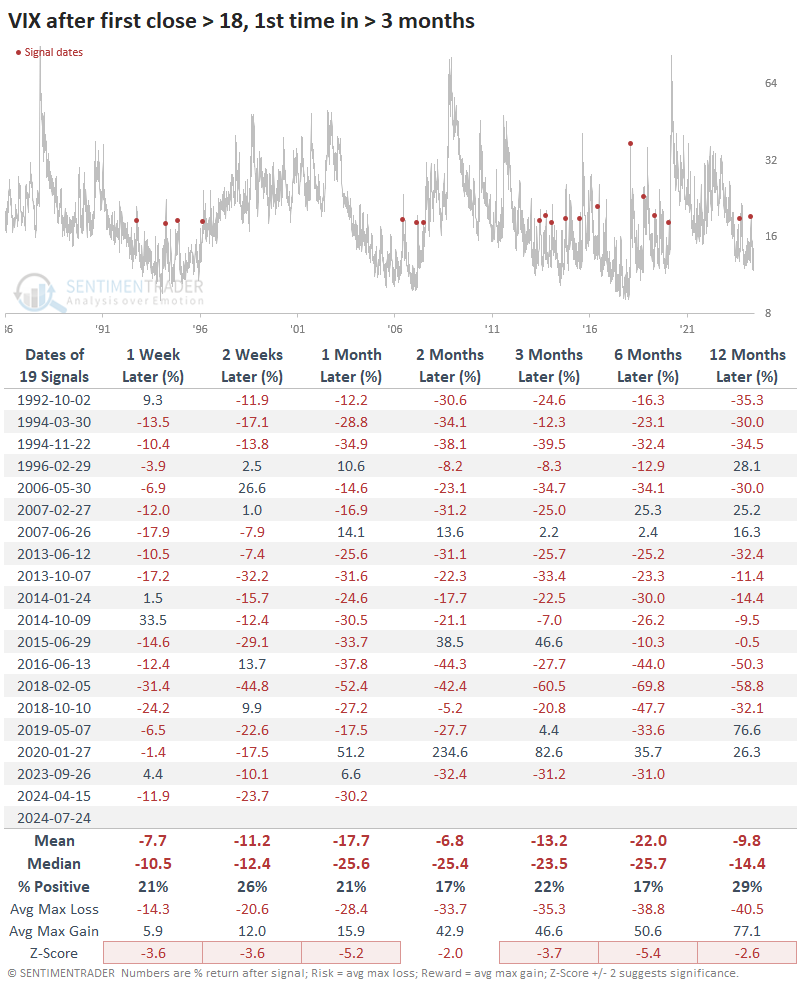
So, let's relax the parameters by looking for any time the VIX jumped above 18 for the first time in at least three months, regardless of what level it dropped to in the months prior. That gives us another handful of precedents that remain relatively positive for stocks. Over the next six months, the S&P 500 suffered only two minuscule losses.
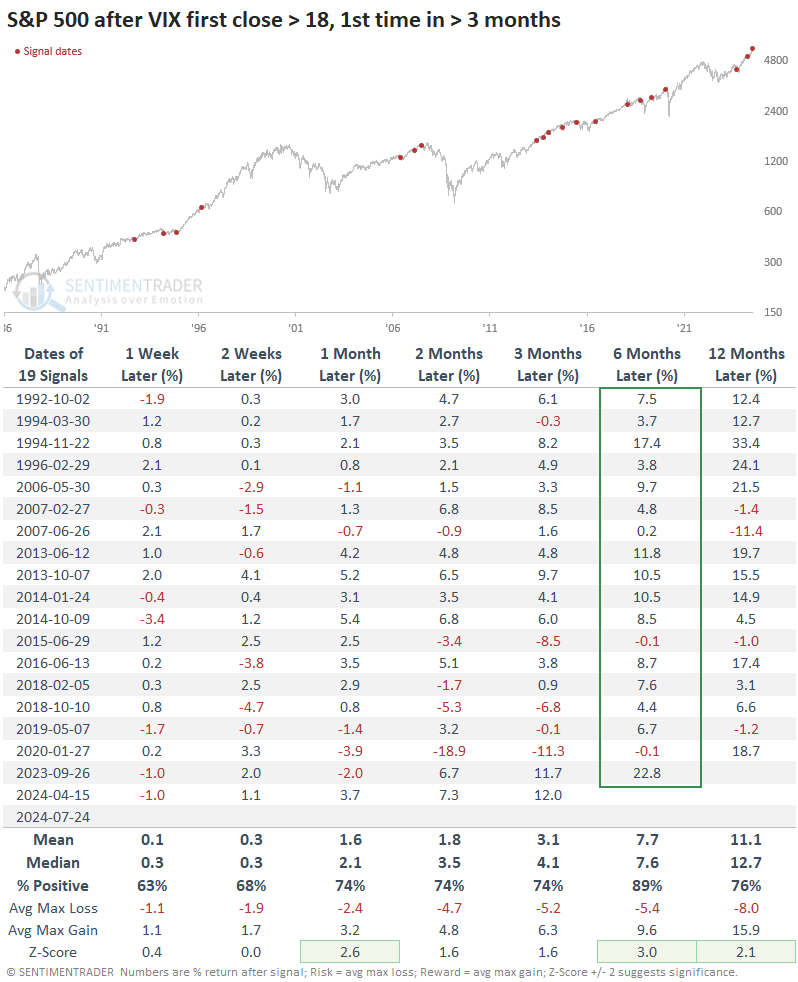
The VIX was still a sea of red. Over the next few months, the only times it showed substantial gains were during the 2015 summer volatility due to a crash in China and other overseas volatility and the pandemic.
What the research tells us...
Investors had enjoyed a long stretch (a very long stretch) without having to suffer the indignities of a big down day, much less a string of them. That changed over the last week and a half, and investors reacted the way they always do - by panicking. They rushed to lock in some gains and protect against the possibility of a developing correction.
Most of our sentiment measures have only dipped modestly from extreme optimism, so it's not like there's rampant fear out there. There's just moderately less optimism than there was a couple of weeks ago. The VIX is an important and widely watched measure, and it says basically the same thing- that there has been enough of a regime change indicating the risk/reward has tilted more in favor of stocks over the medium to long term.