Products
SentimenTrader Trading Tools
‍
Backtest Engine
My Trading Toolkit
Correlation Analysis
Seasonality
Market Prediction
Indicators & Data API
‍
Proprietary Indicators & Charts
Market Data API
Strategies & Scanner
‍
50+ Trading Strategies
Smart Stock Scanner
Smart Option Scanner
Research Reports
‍
Research Solutions
Reports Library
Free Resources
Simple Backtest Calculator
Simple Seasonality Calculator
The Kelly Criterion Calculator
Sentiment Geo Map
Public Research Reports
Education
Sentiment Indicators
Technical Indicators
Pricing
Company
About
In the News
Testimonials
Client Success Stories
Contact
Log inLoginSign up
< BACK TO ALL REPORTS

Fear Is Slipping As Moving Averages Show Extreme

Jason Goepfert
2019-02-07
null

Fear is slipping

Even while the S&P 500 remains below its 200-day average, the VIX has slipped to a multi-month low and is well below its long-term average of 20.

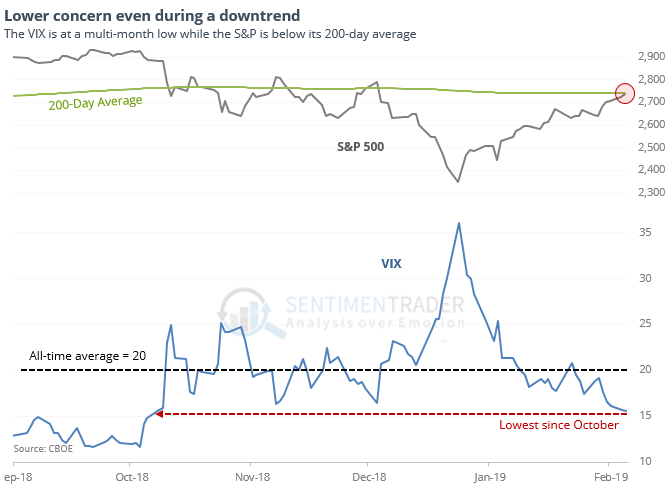
This has consistently led to trouble over the short- to medium-term as the ebbing of concern showed that investors were too quick to price in lower volatility. Most notably, over the next six months only two days managed to sport a positive return, and those were small.

Anything but average

The thrust in stocks over the past few weeks has taken almost all S&P 500 stocks above their 10- and 50-day averages, while fewer than 60% of them have managed to climb above their 200-day averages.

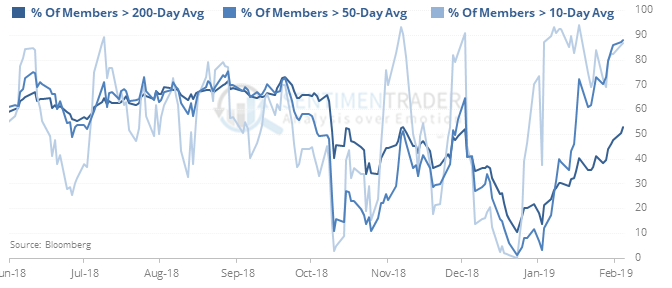
Over the next month, it was quite negative, with only 3 gains versus 6 losses, and risk twice as large as reward. But after that, the thrusting nature of the signals led to generally positive returns. Momentum does not die easily.

Glittery

Optimism on gold has been ticking higher and is now above 60. During bear markets, optimism often peaks before getting much beyond 60 (during bull markets, it usually stays above 40). During gold’s bad 7-year stretch, when the Optimism Index was this high, its average return over the next month was -1.4% with only 28% of the days showing a positive return according to the Backtest Engine.

A little less strong

The McClellan Oscillator has ended its streak above 50 after 22 days. That was the longest streak in history. The only ones nearing it ended after 19 days on 1962-11-30 and 1966-11-11.

This post was an abridged version of our Daily Report. For full access, sign up for a 30-day free trial now.

PRODUCTS
SentimenTrader
Trading Tools
Indicators & Data API
‍
Strategies & Scanner
‍
Research Reports
FREE
RESOUrCES
Simple Backtest
Calculator
Simple Seasonality
Calculator
The Kelly Criterion
Calculator
Sentiment Geo Map
‍
Public Research Reports
‍
Education
Sentiment Indicators
‍
Technical Indicators
‍
Pricing
Bundle pricing
‍
FAQ
‍
Announcements
‍
COMPANY
‍
About
‍
In the News
‍
Testimonials
‍
Client Success Stories
CONTACT
‍
General Inquiries
‍
Media Inquiries
‍
Financial Professionals Inquiries
‍
© 2026 Sundial Capital Research Inc. All rights reserved.
Setsail Marketing
TermsPrivacyAffiliate Program
Risk Disclosure: The information and tools provided are for research and analytical purposes only and are not intended as investment advice. Market analysis involves uncertainty, and outcomes may differ from expectations. Users should conduct their own due diligence and consider their individual circumstances before making any financial decisions. Past performance is not necessarily indicative of future results.

Hypothetical Performance Disclosure: Hypothetical performance results have many inherent limitations, some of which are described below. No representation is being made that any account will or is likely to achieve profits or losses similar to those shown; in fact, there are frequently sharp differences between hypothetical performance results and the actual results subsequently achieved by any particular trading program. One of the limitations of hypothetical performance results is that they are generally prepared with the benefit of hindsight. In addition, hypothetical trading does not involve financial risk, and no hypothetical trading record can completely account for the impact of financial risk of actual trading. for example, the ability to withstand losses or to adhere to a particular trading program in spite of trading losses are material points which can also adversely affect actual trading results. There are numerous other factors related to the markets in general or to the implementation of any specific trading program which cannot be fully accounted for in the preparation of hypothetical performance results and all which can adversely affect trading results.

Testimonial Disclosure: Testimonials appearing on this website may not be representative of other clients or customers and is not a guarantee of future performance or success.