
Favorable signs continue to fall on the good side of the ledger

Key points
- A variety of breadth, price action, and risk level measures have recently been flashing green
- Individual indicators are not "trading systems" and should never be expected to be perfect (even if they have been in the past)
- The key is to note when indicators are stacking up on the favorable side of the weight of the evidence ledger
Not every indicator is a trading system (and not every red dot is an automatic "buy" signal)
Human nature often leads traders to view "signals" from a given indicator as a "buy" or "sell" signal and/or to view every indicator as a "trading system." But this does a disservice to many good indicators. No indicator is infallible - even the most reliable will likely give a signal at some point that is not followed by the hoped-for rally (or decline). The natural inclination is to peruse the signals generated by a given indicator, find the outlier that fired too soon before a price decline, and say, "Ah, but this signal was terrible!" In the next instant, the mind dismisses or diminishes the indicator as "not useful because it gave a signal right before this one particular significant decline" - even though the overall Win Rate from all signals is 90% or higher.
This is unfortunate - but again, perfectly understandable in the context of human nature.
A different approach to consider is to view each indicator not as a "standalone trading model firing off buy and/or sell signals" (which is not what indicators are typically meant to be) but rather as merely "weight of the evidence." The more reasonably reliable indicators firing similar signals, the better - or worse - the outlook for the overall market.
With that in mind, below are the actions of a cluster of "reasonably reliable indicators."
Nasdaq 100 Buying Climaxes…
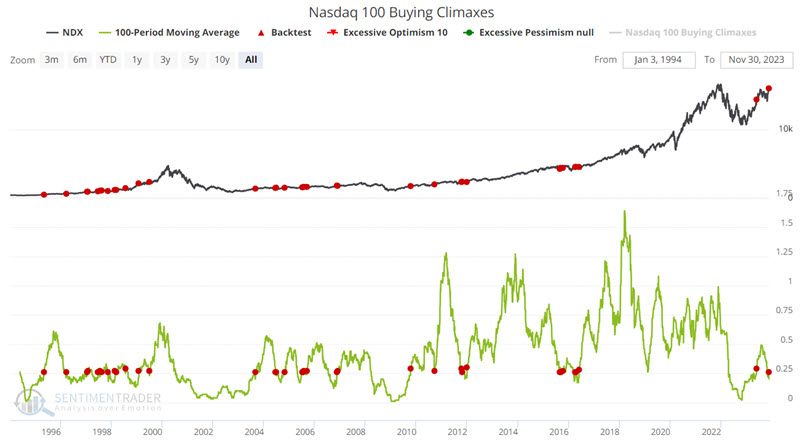
The Nasdaq 100 Buying Climaxes indicator shows the number of stocks in the Nasdaq 100 that reached a 52-week high during the week and then closed below the prior week's close. It suggests a climax in buying interest among investors, generally considered a sign of buying exhaustion. In theory, as the number of buying climaxes reaches an extreme, it indicates a large amount of buying exhaustion in the market, which should intuitively lead to subpar returns in the medium term.
Interestingly, if this indicator is smoothed over many days, the implication is just the opposite. The chart below displays those dates when the 100-day moving average of the Nasdaq 100 Buying Climaxes indicator crossed above 0.25.
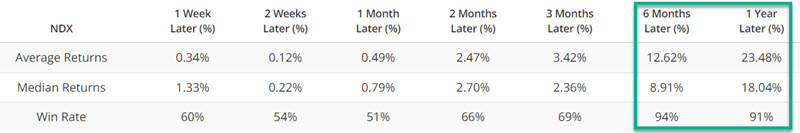
The table below summarizes Nasdaq 100 performance following the dates highlighted in the chart above. The key things to note are the exceptionally high Win Rates for six-month and twelve-month periods and the well-above-average Median Returns for twelve months.
S&P 1500 RSI 14-day RSI > 70
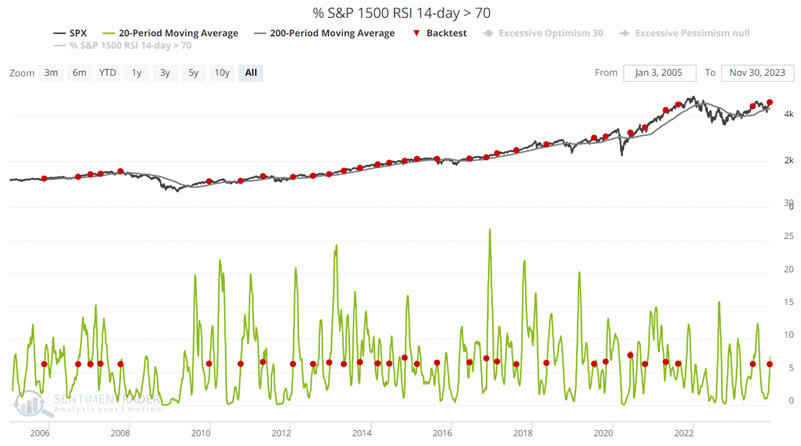
The S&P 1500 RSI 14-day > 70 indicator is calculated by determining the 14-day RSI values for each of the S&P 1500 symbols and then calculating the percentage of them at extreme values.
The chart below displays those dates when the 20-day moving average of the S&P 1500 RSI 14-day > 70 indicator crossed above 6.2% for the first time in three months while the S&P 500 index is above its 200-day moving average. This scenario essentially highlights a reversal from an oversold condition within an ongoing uptrend.
The table below summarizes the S&P 500 index following the signals above.
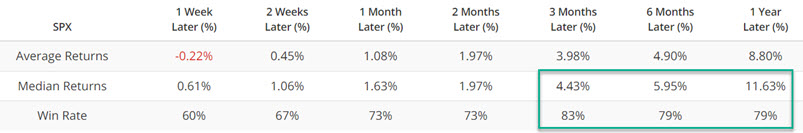
The results are best categorized as "solidly favorable" but not necessarily wildly bullish. This iteration of this indicator is likely best used not as a standalone model but as weight of the evidence. As such, the most recent signals - on 2023-06-27 and 2023-11-27 - add weight to the bullish case over the next one to twelve months.
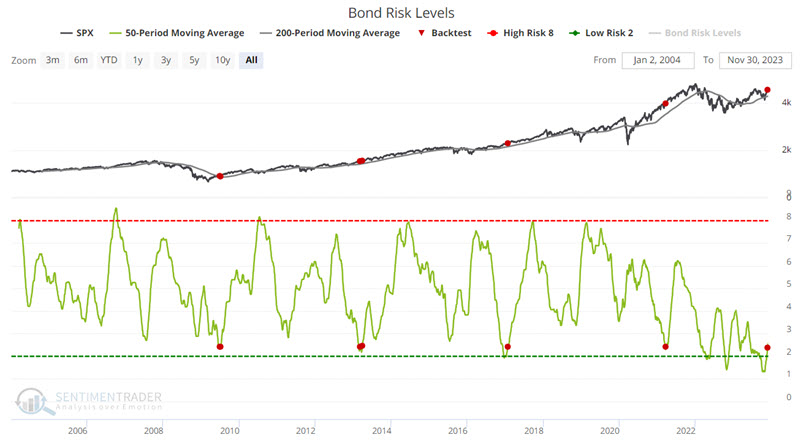
Bond Risk Levels
Interest rate movements obviously affect bond prices. But they also affect stock prices as well. Our Bond Risk Levels indicator has some surprisingly useful applications as a stock market indicator.
The chart below displays those dates when the 50-day moving average of the Bond Risk Levels indicator crossed above 2.4% while the S&P 500 index is above its 200-day moving average.
The table below summarizes the S&P 500 index performance following the signals above.
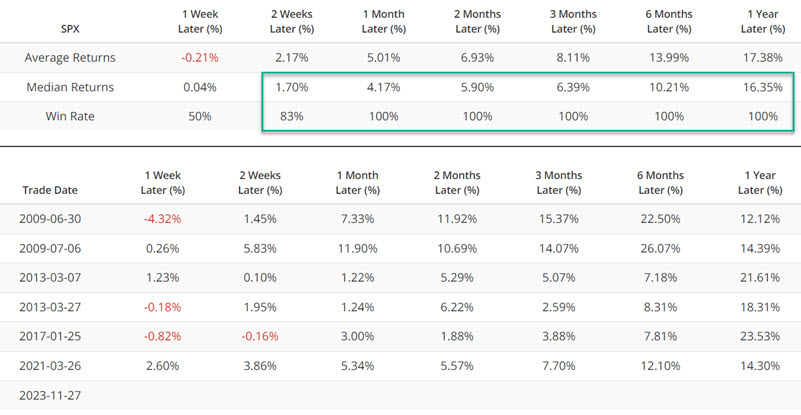
The sample size is very small - so once again, this is not a signal that should be relied upon as an "automatic" buy signal. Nevertheless, the consistently high Win Rates across all timeframes make this a useful weight of the evidence piece of the puzzle.
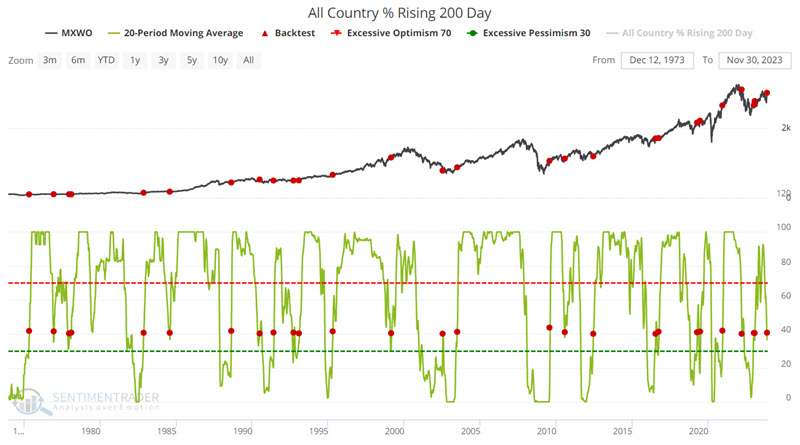
All Country % Rising 200 Day
As the name implies, the All Country % Rising 200-Day indicator shows the percentage of major country equity indexes (currently numbering more than 20) with a rising 200-day moving average.
The chart below displays those dates when the 20-day moving average of the All Country % Rising 200 Day indicator crossed above 40%. This action often occurs in the relatively early stages of a bull market as the number of country equity indexes reverses higher from a low level.
The table below summarizes the MSCI All-World Index performance following the signals above.
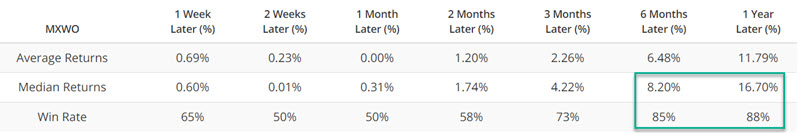
The key things to note are the exceptionally high Win Rates for six-month and twelve-month periods and the well-above-average Median Returns for twelve months.
What the research tells us...
Taken individually, each of the recent signals from the indicators highlighted above may or may not prove useful. When taken together, however, they amount to a considerable amount of "weight of the evidence," lending itself to the favorable side of the stock market outlook ledger. These actions suggest that investors continue to give the bullish case the benefit of the doubt (albeit, as always, with a risk management plan in place, just in case "this time around" turns out to be an outlier).