
Favorable momentum indicators pile up - Part II

Key points
- In two previous pieces, we highlighted that momentum is an important factor in the stock market
- At the end of March 2024, a variety of momentum signals were rated as favorable for stocks
- Here, we look at the history of stock market performance depending on whether one or more of these signals are in force
Combining signals above different momentum indicators
In this article dated 2024-03-28, I highlighted the S&P 500's performance after the S&P 500 Index closed with a monthly gain for five consecutive months.
In this article dated 2024-04-01, we highlighted two more momentum indicators (SPX up 15+% in three months and SPX up 25+% in five months)
Let's combine that signal with the two highlighted above.
The rules:
- If the S&P closes higher for five straight months OR
- If the S&P closes a month with a 3-month gain of 15% or more, OR
- If the S&P closes a month with a 5-month gain of 25% or more
- We buy and hold the S&P 500 Index for twelve months
- If any of the above generates a new signal within the initial twelve months, we extend the holding period another twelve months
NOTE: While we are using systematic rules, from our view, the rules above DO NOT constitute a 199% in the market OR 100% out of the market standalone trading model and should be considered merely as the weight of the evidence. An active favorable signal (i.e., one or more of the signals is favorable) does not guarantee a bull market, AND a lack of an active signal does not guarantee a bear market. Remember, momentum is only one factor among many that can affect the trend of stock prices.
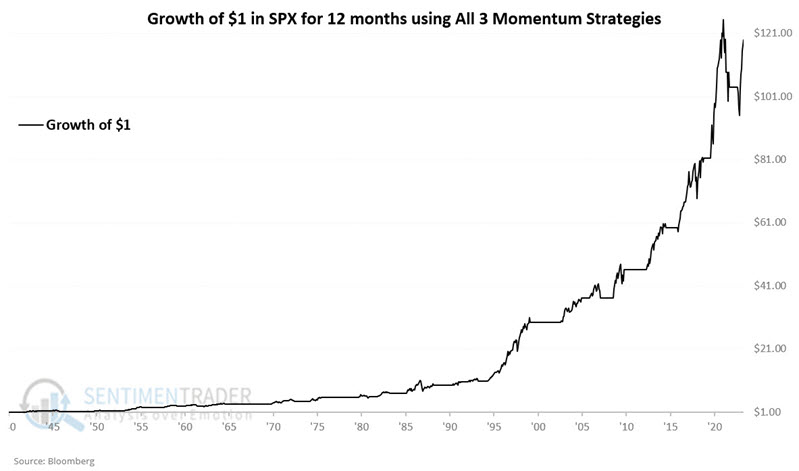
The chart below displays the hypothetical growth of $1 invested in the S&P 500 Index using the rules above since 1941.
The chart below displays the same results on a logarithmic scale.
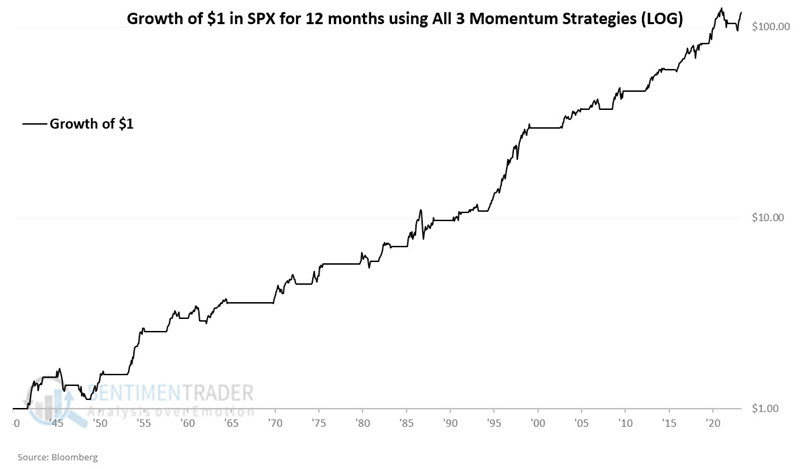
The results are far from perfect (long during the late 1940's decline, the Crash of '87, and much of the 2022 decline), but the equity curve's long-term "lower left to upper right" nature is undeniable.
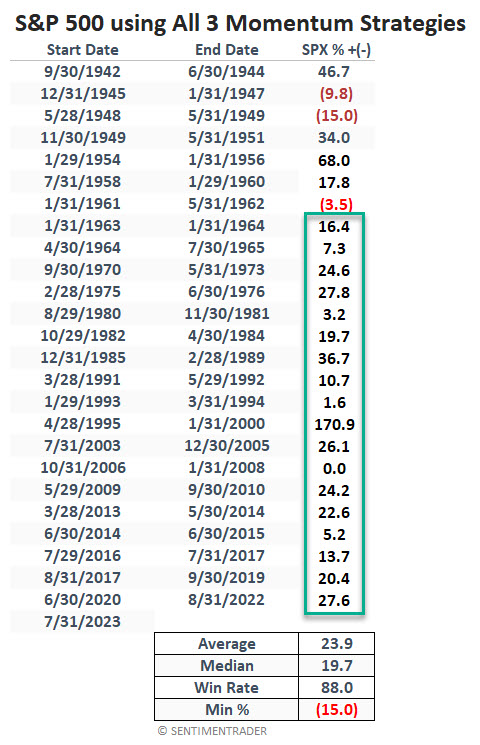
The table below displays all periods when at least one of the above signals was in effect and S&P 500 performance. Note that there has not been a negative period since 1962. The most recent favorable period began on 2023-07-31, when the S&P closed higher for five straight months. After an initial -8.6% decline during August through October 2023, the S&P 500 has rallied over 25% and closed March 2024 up 14.5% since the initial July 2023 signal.
With the two signals detailed above, this particular "model" (such as it is) will be rated as "favorable" at least through March of 2025.
When NONE of the indicators are favorable
The chart below displays the hypothetical growth of $1 invested in the S&P 500 ONLY when NONE of the signals are active.
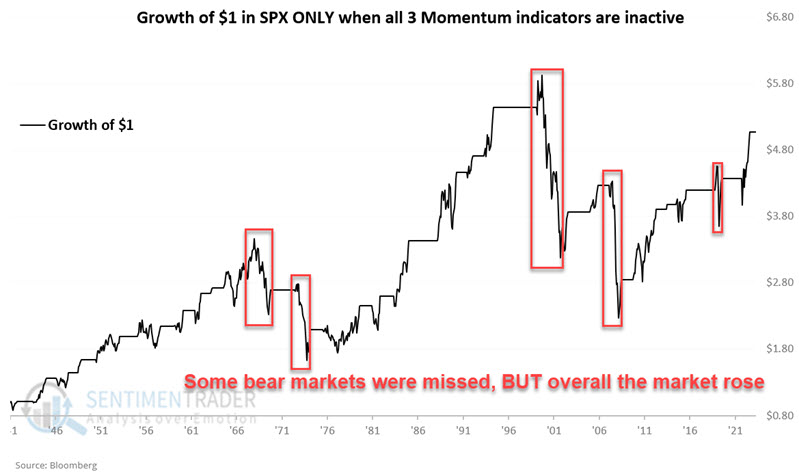
As you can see, while systematically avoiding the stock market during zero readings avoided significant losses during several bear markets, the stock market gained ground overall in the long run.
This tells us two things:
- Momentum is only one factor that affects stock prices. Using the three-indicator model detailed above as a standalone strategy (i.e., 100% in the market when one or more indicators were active, 100% out of the market if all three indicators not active) would have significantly underperformed a buy-and-hold approach and is not recommended
- The proper use of the model above is to note that the probability of favorable stock price action improves when one or more of the highlighted momentum indicators is favorable
As of 2024-03-31, all three momentum indicators are rated as favorable. The chart below displays the hypothetical growth of $1 when all three momentum indicators are active at the same time.
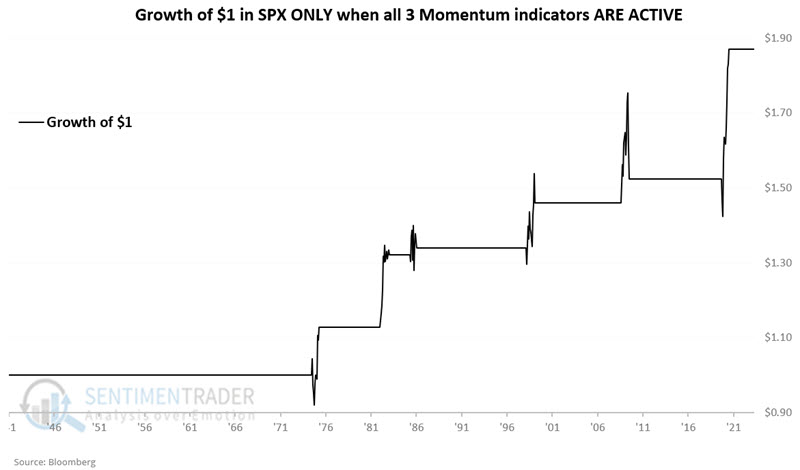
The table below summarizes S&P 500 performance when all three momentum indicators are active.
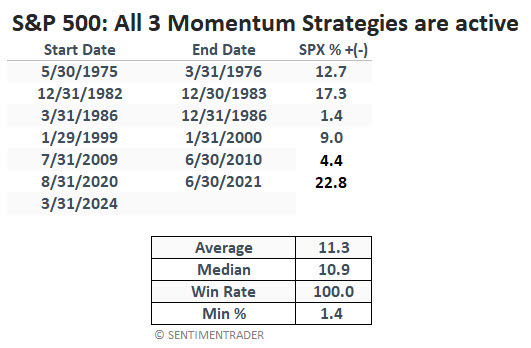
Note that five of the six supposedly "maximum bullish" periods experienced either a sharp initial drawdown or some significant price volatility along the way. Remember, this is weight of the evidence and NOT a sure thing.
What the research tells us...
To reiterate, momentum is a valuable tool for stock market investors. However, it is not the only factor influencing stock prices at any given time. Therefore, it should not be relied upon as the sole factor in deciding whether to be in or out of stocks. When a variety of momentum factors turn favorable, it typically pays to give the bullish case the benefit of the doubt (although outliers can and will happen, a risk management plan is still necessary even under the most favorable circumstances). A lack of favorable momentum signals typically only matters when other factors (especially price trend) are flashing warning signs.