
Favorable insider action in Financials and Staples

Key points
- The most bullish actions a corporate insider can take is to buy shares of their own company on the open market and limit selling
- Both the financial sector and the consumer staples sector have seen meaningful insider activity recently
- While no indicator is ever infallible, insiders are rarely wrong over a 1 to 3-year time frame when they act decisively
Insiders buying the financial sector
Our Corporate Insider Buys - XLF indicator tracks the total number of corporate insiders of companies covered by the Financial Select Sector SPDR Fund ETF ticker XLF) that have bought shares on the open market during the past six months. Because insiders typically only buy if they have confidence that their company (and stock) will do well, insider buying is considered a stronger signal than insider selling. When buying picks up quickly and dramatically, it tends to be a very good sign for the stock market.
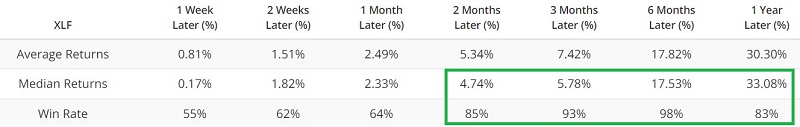
The chart below highlights all weeks when the indicator stood at 60 or higher. The table summarizes subsequent XLF performance.
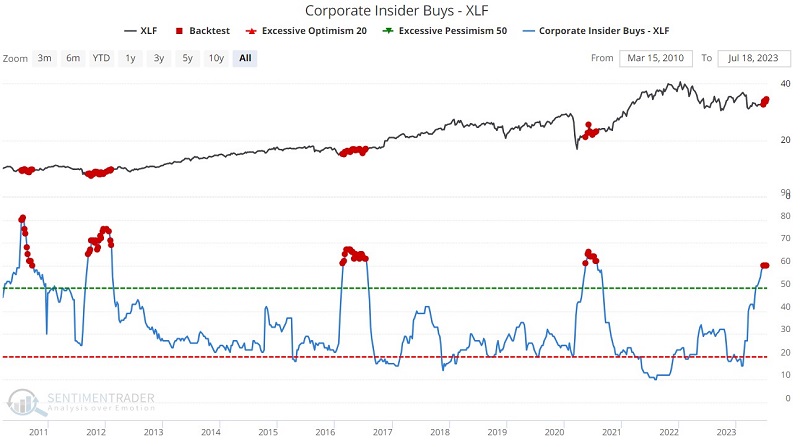
Note that heavy buying tends to occur in clusters and that these clusters tend to occur after sharp selloffs in the sector. Not long after the SIVB panic-induced selloff in early 2023, sector insiders ramped up their buying significantly. Whether they will prove right or wrong remains to be seen, but the buying spike announces that they collectively saw the selloff as a buying opportunity.
For a slightly different perspective, let's look only at those times when the indicator crossed above 60 for the first time in a year. The results following those occurrences appear in the chart and table below.
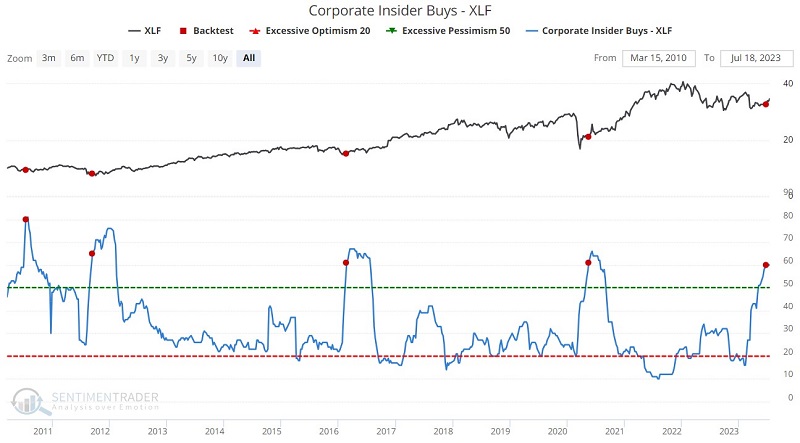
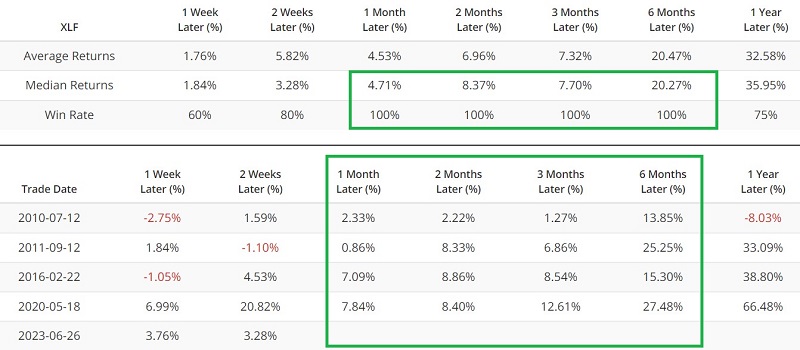
The critical thing to note here is the robust returns one to six months after a signal. The most recent new signal occurred on 2023-06-26. Historical results suggest the potential for continued strength in the financial sector through the end of the year.
Insider buy/sell ratio in the consumer staples sector soars
Consumer staples are considered a "defensive" sector and tend to outperform during market weakness and underperform during market strength. Given the current state of the market, many investors will ignore staples and focus on sectors more likely to outperform within the context of a bull market. That said, recent insider action suggests that less aggressive investors who seek a favorable tradeoff between upside potential and downside risk might do well to look at staples.
Our Corporate Insider Buy/Sell Ratio - XLP indicator shows a ratio of the total number of corporate insiders of companies covered by the Consumer Staples Select Sector SPDR Fund ETF (ticker XLP) that have bought shares on the open market during the past six months versus those that have sold shares. Because insiders typically only buy if they have confidence that their company (and stock) will do well, insider buying is considered a stronger signal than insider selling. When buying picks up quickly and dramatically, it tends to be a positive sign for the sector.
The chart below highlights all weeks when the indicator crossed above 0.12, and the table summarizes subsequent XLP performance.
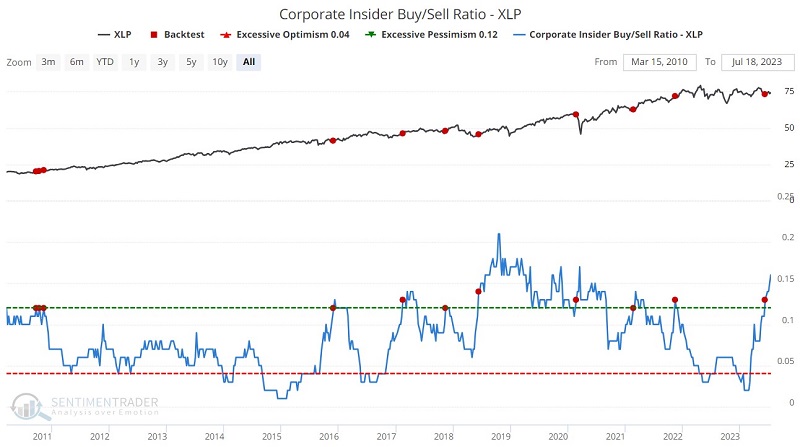
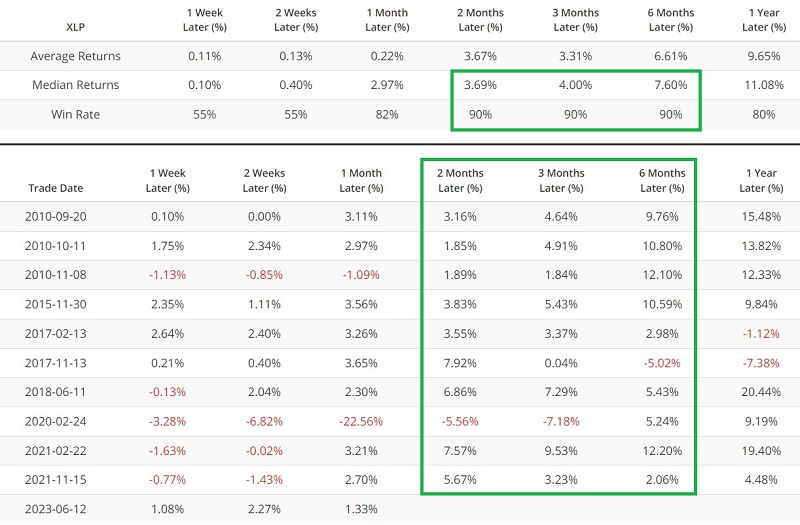
The critical thing to note here is the high Win Rates for two to six months after a signal. Note also that the indicator has continued to rise since first crossing 0.12 on 2023-06-12. This suggests that sector insiders are loading up on their own shares in anticipation of even better sector performance over the next one to three years.
What the research tells us…
It is important to note that insider buying and selling trends do not represent "sure things" - nothing does. Insider indicators are also not always useful for those seeking "precision market timing." In many cases, insiders have acted too soon. Nevertheless, history has shown that when individuals who know their own companies best act concertedly, it typically pays to follow their lead. While insider actions are not always timely, they are rarely wrong over one to three years. And as we saw above, in some cases, even sooner.