
Falling Bond Volatility can be Good for Stocks

Key points:
- The MOVE Index is considered by many to be the VIX Index for the bond market, i.e., a measure of overall volatility
- However, as it turns out, this indicator may be more useful to stock investors than to bond investors
- The MOVE Index recently dropped to a level that has tended to occur during an ongoing bull market for stocks
The Bond MOVE Index has fallen to a significant level
Merrill Lynch developed the MOVE index to measure the implied volatility of options on US Treasury markets, intended to reflect collective expectations for future volatility in the fixed-income market. It is a yield-curve weighted average of the normalized implied volatility of 30-day options on 2-year, 5-year, 10-year, and 30-year Treasuries. It is similar to the VIX for stocks that most people are familiar with, in that during periods of high uncertainty, options traders will price in wider moves, and the MOVE index will rise, suggesting some fear in the bond market. During periods of relative quiet and calm conditions, the MOVE index will decline. It's not as consistent a contrary indicator as the VIX, but it is still typically considered one.
The interesting aspect of the MOVE Index is that it has proven to be a valuable stock market indicator in certain situations. The stock market often takes its cue from the credit markets. Essentially, when turmoil arises in the bond market (i.e., a rising MOVE Index), it frequently signals potential trouble for stocks. Conversely, when there is relative calm in the bond market (i.e., a falling MOVE Index), it portends a favorable environment for stocks.
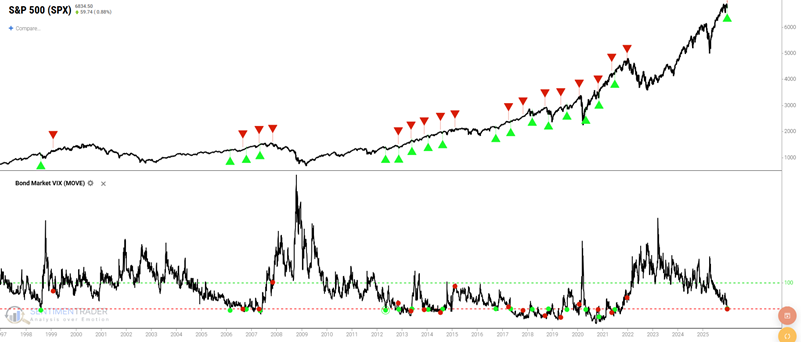
Historically, the MOVE Index has ranged from a low of 36.6 to a high of 264.6. The chart below highlights all dates when the MOVE Index was below 60.1, compared to the S&P 500 Index. The most recent signals occurred on December 18th and 19th.
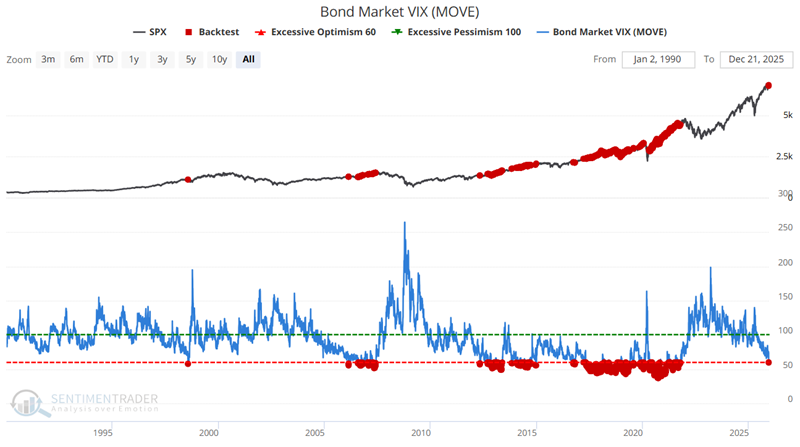
What we notice in the chart above is the tendency for these signals to occur in conjunction with a rising stock market. The table below summarizes results for all signal dates, including the many overlapping signals.
Now, let's take a closer look at how to use this signal on a more systematic basis. Let's next create a strategy in BacktestEdge to utilize this setup for trading.
Building a strategic approach in Backtest Edge
The test below can be found in BacktestEdge under Analyst Backtests. The following screens show the Setup steps to create a "Single Symbol Backtest" (which is already done for you under Analyst Backtests). The first screen names the strategy and sets a Start Date.
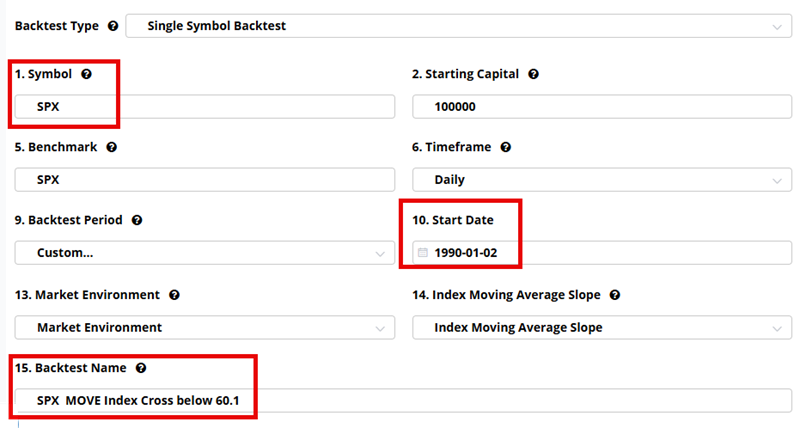
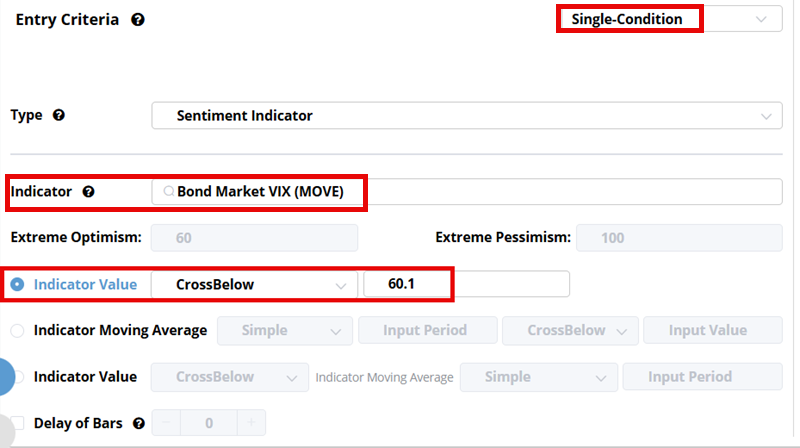
The screen below sets the entry criteria whereby the Bond MOVE Index crosses below 60.1.
In the screen below, we set up to exit the trade after 126 trading days (i.e., 6 months). We could also consider setting a stop-loss (In real-world trading, it is essential to assess and utilize stop-loss points). However, for the purpose of testing this setup, no stop-loss is used.

Once everything is set up, we can click "Run Test" to generate results.
Analyzing the Strategy Test Results
The chart below displays all entry and exit signals for this test. A casual perusal reveals that signals, which are based solely on T-bond option volatility and have no connection to the stock market, tend to occur repeatedly within the context of stock market advances.
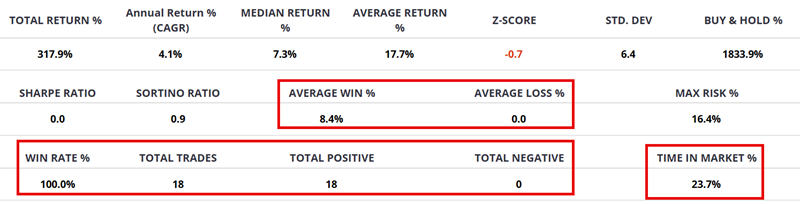
The table below summarizes the results of the entry and exit signals. The strategy is in the market less than 24% of the time, with a six-month Win Rate to date of 100%. The Average Win was 8.4%.
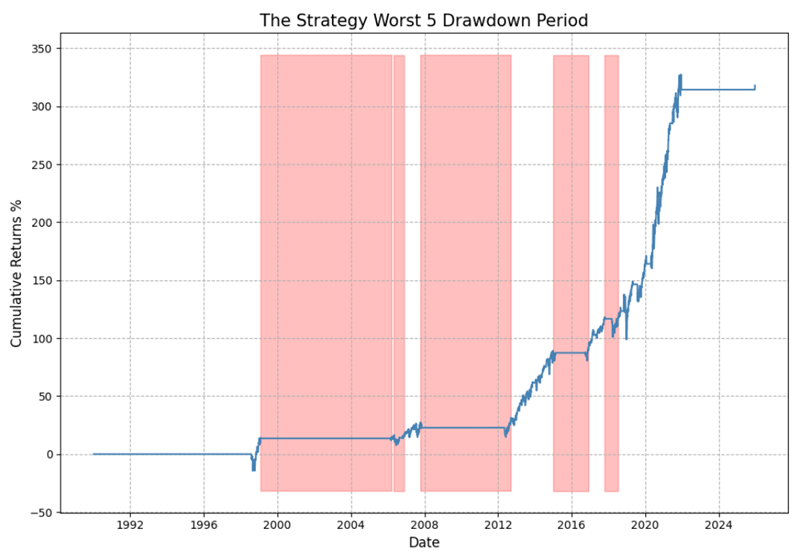
The chart below displays the hypothetical equity curve (i.e., the Cumulative % +(-)) achieved by holding the S&P 500 for 126 trading days after each new signal. The key thing to note is the "lower left to upper right" nature of the equity curve. This suggests that this "strategy" may be helpful for stock-index swing traders.
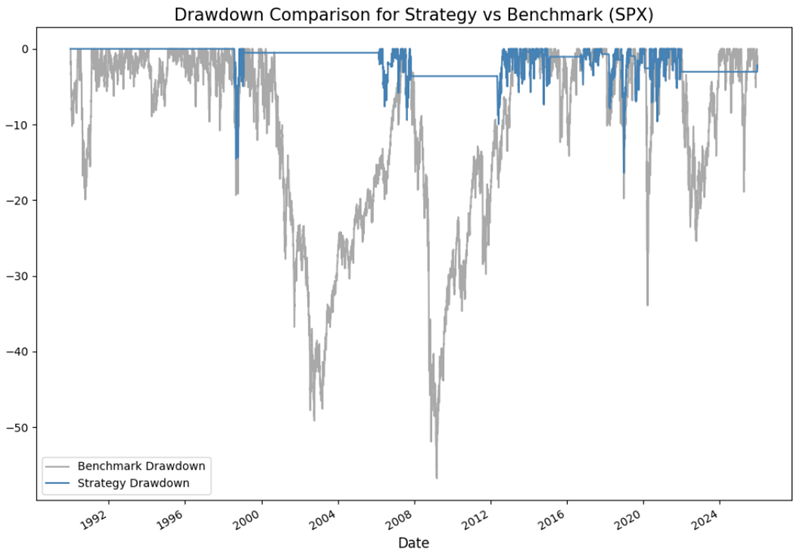
The chart below displays the hypothetical % drawdowns that would have been incurred while holding a long position in the S&P 500 between all entry and exit signals (blue line) versus the hypothetical % drawdown incurred using a buy-and-hold approach. The maximum intratrade drawdown for the strategy was -17.6%, compared to -55% for the buy-and-hold strategy.
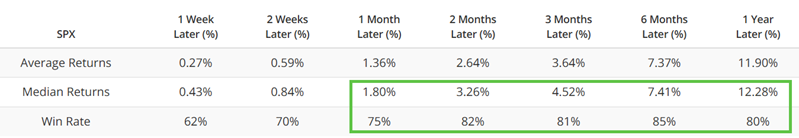
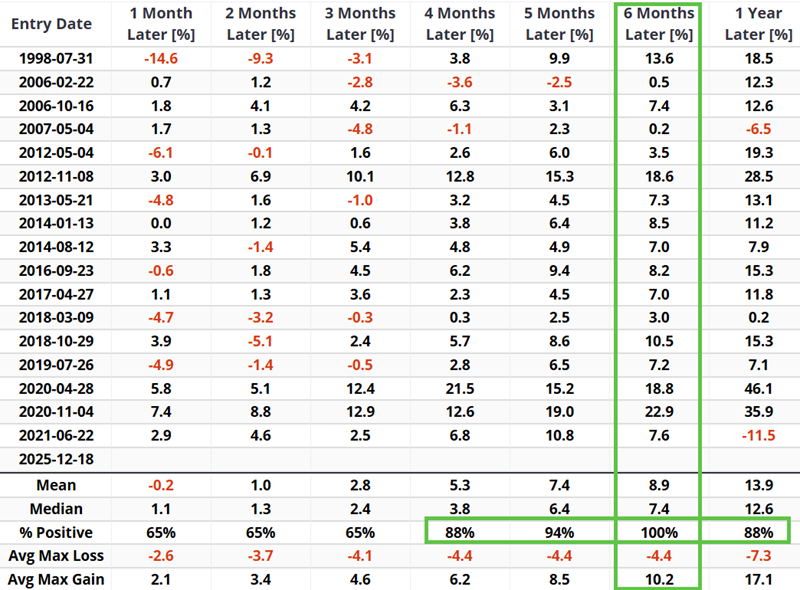
The table below displays returns by timeframe following each entry signal generated using the rules above. The 6-month returns are highlighted in a green box, as are the Win Rates for four months to one year.
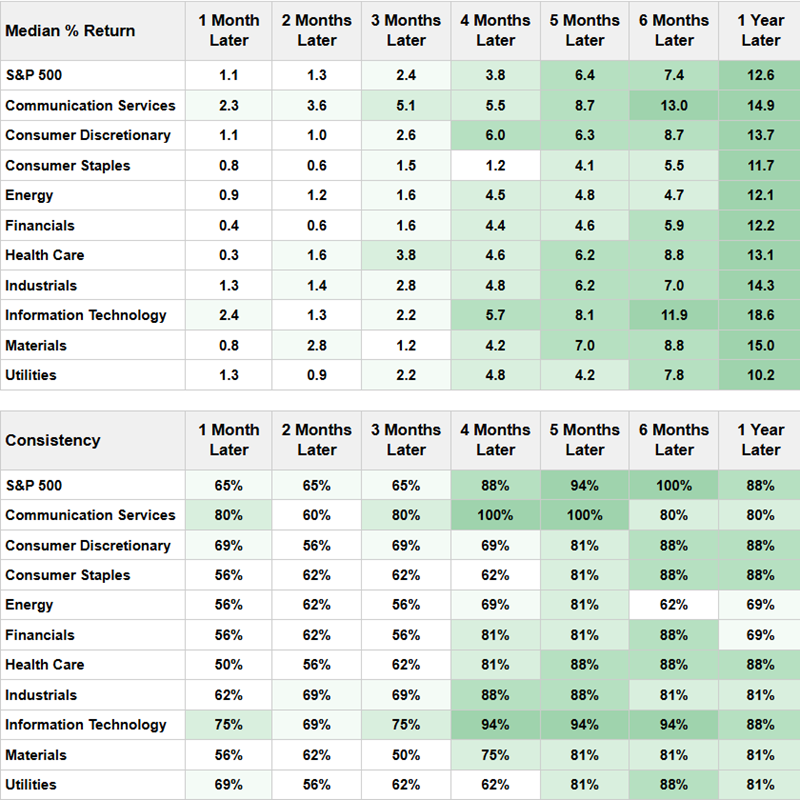
For comparison purposes, the performance of the S&P 500 and its various sectors is presented in the table below. The S&P 500 Index has the highest six-month Win Rate (100%, versus 94% for second-best Technology), but technology shows a higher Median Return (11.9% versus 7.4%).
What the research tells us…
This seems like a good time to invoke - Jay's Trading Maxim #212: Ironically, the only certainty in the stock market is that the stock market hates uncertainty. A low and/or declining MOVE Index alerts us to a sense of calm in the bond market. This has historically signaled favorable conditions for the stock market. Does the recent signal highlighted above mean smooth sailing for stocks over the next six months? Not necessarily. However, for now - and until proven otherwise - it lends weight to the favorable side of the evidence ledger.