
Extreme Crowding in Defensive Sectors

Key Keywords
- Capital is pouring into the Utilities sector in a "panic buying" pattern
- More than 80% of constituent stocks have broken above the upper Bollinger Band
- Over 70% of constituent stocks have an RSI above 70
Offensive Performance of Defensive Assets
In our recent market scan, we observed the following phenomenon: across breadth indicators for various sectors, the heatmap of XLU sector indicators is almost entirely red. Subscribers can click here to view details.
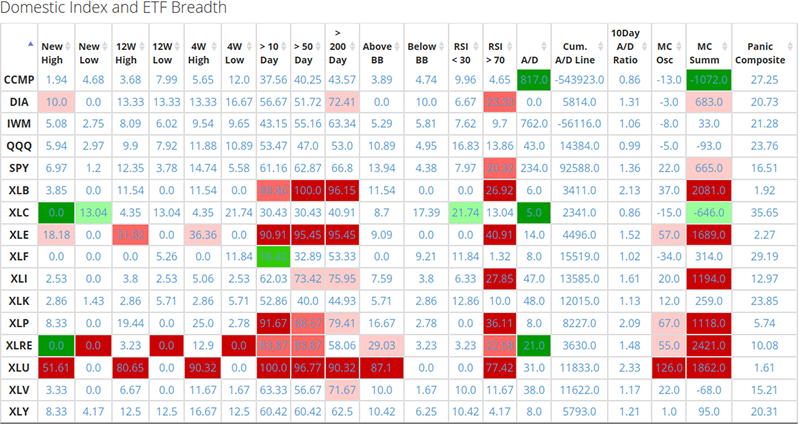
The XLU sector is experiencing an extreme buying frenzy internally. The most striking data point is that as much as 87.1% of its constituent stocks are trading above the upper Bollinger Band (Above BB). Meanwhile, 77.42% of stocks in the sector have a Relative Strength Index (RSI) above 70, and 90.32% of constituents are trading above their 200-day moving average.
Rising Proportion of Stocks Breaking Above Upper Bollinger Band
To assess the sustainability of this "extreme strength", we backtested historical instances where the proportion of XLU constituents breaking above the upper Bollinger Band exceeded 80%.
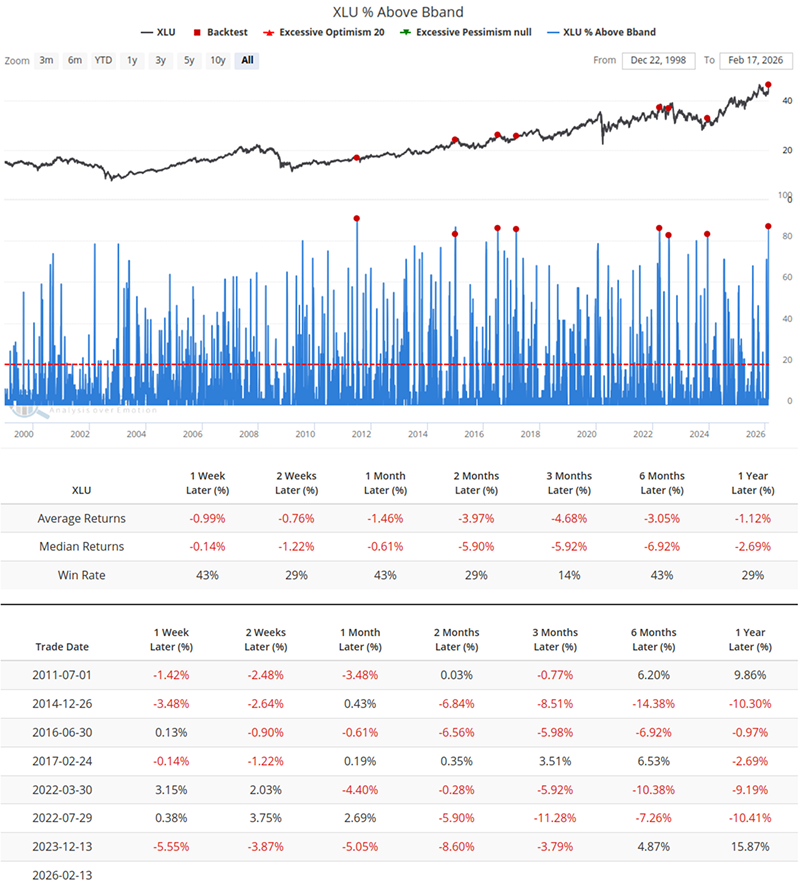
Within the 3-month window following signal triggers, XLU posted a win rate of only 14%. Even in the subsequent 1-week and 2-week periods, the average returns were negative.
This backtest result suggests that when a sector uniformly surges toward the upper Bollinger Band, in the absence of sustained strong macro drivers, prices typically face gravitational pull toward technical correction or mean reversion.
Overheated RSI Momentum
Echoing the Bollinger Band signal, the distribution of RSI indicators also points to "crowded trading" in the short term. We examined scenarios where over 70% of XLU constituents simultaneously had an RSI above 70.
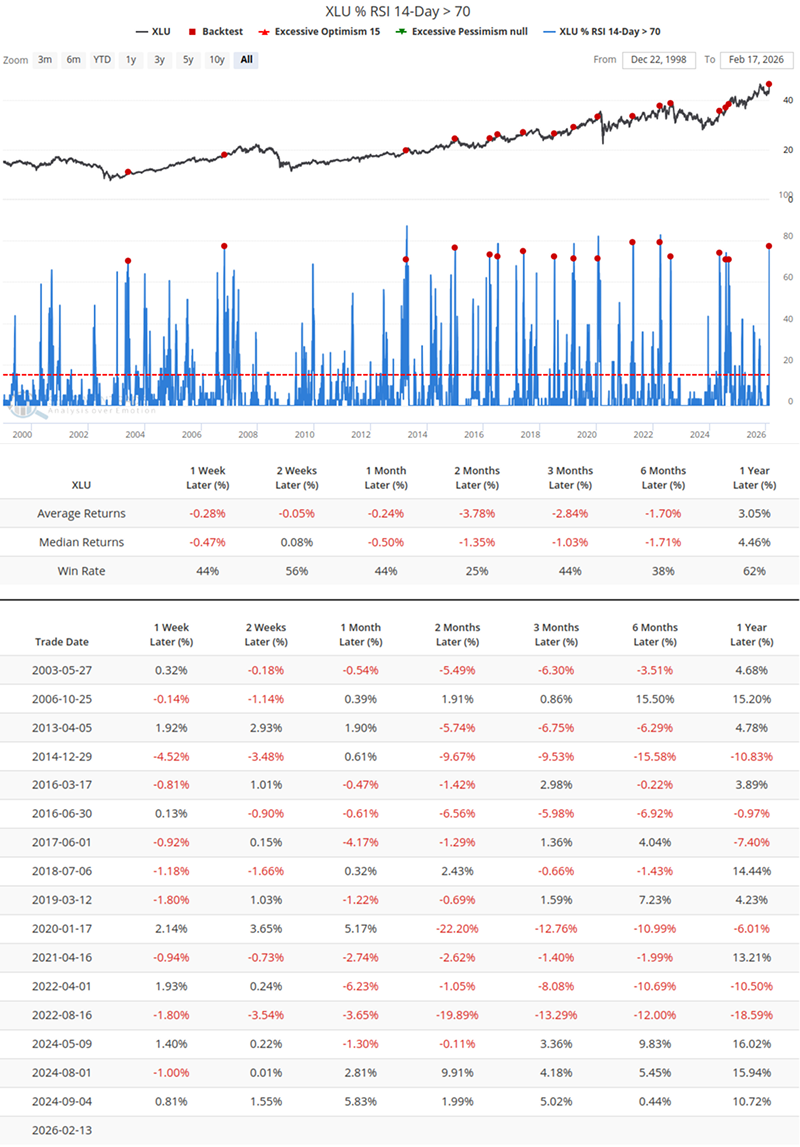
Backtest data shows that while this high-momentum state confirms a strong trend, it is also accompanied by characteristics of short-term pullbacks. Within 2 months of signal triggers, the historical win rate dropped to 25%.
Notably, however, there is a divergence in long-term performance. Despite poor short-term results, the win rate rebounds to 62% over a 1-year time horizon, with positive average returns. While the long-term trend may remain favorable, short-term volatility risks persist.
Breadth Thrust
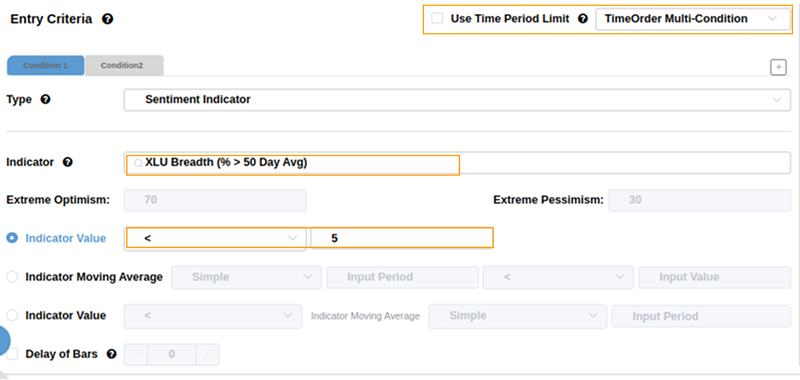
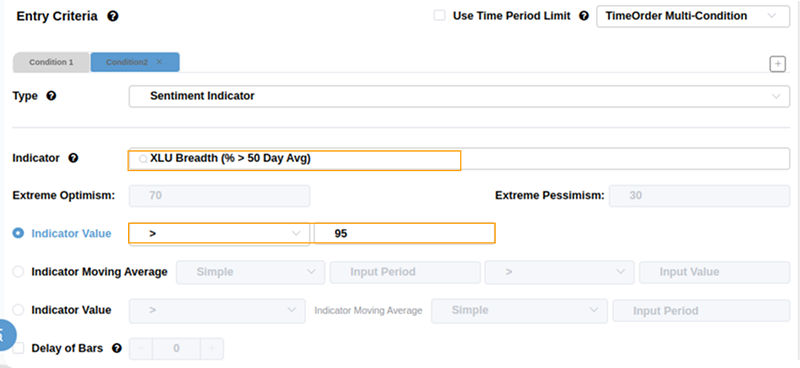
Beyond risk warnings, we also captured a positive long-term signal - "Breadth Thrust". The proportion of XLU constituents above their 50-day moving average recently completed a rapid shift from <5% to >95%.Related Backtest Click Here.
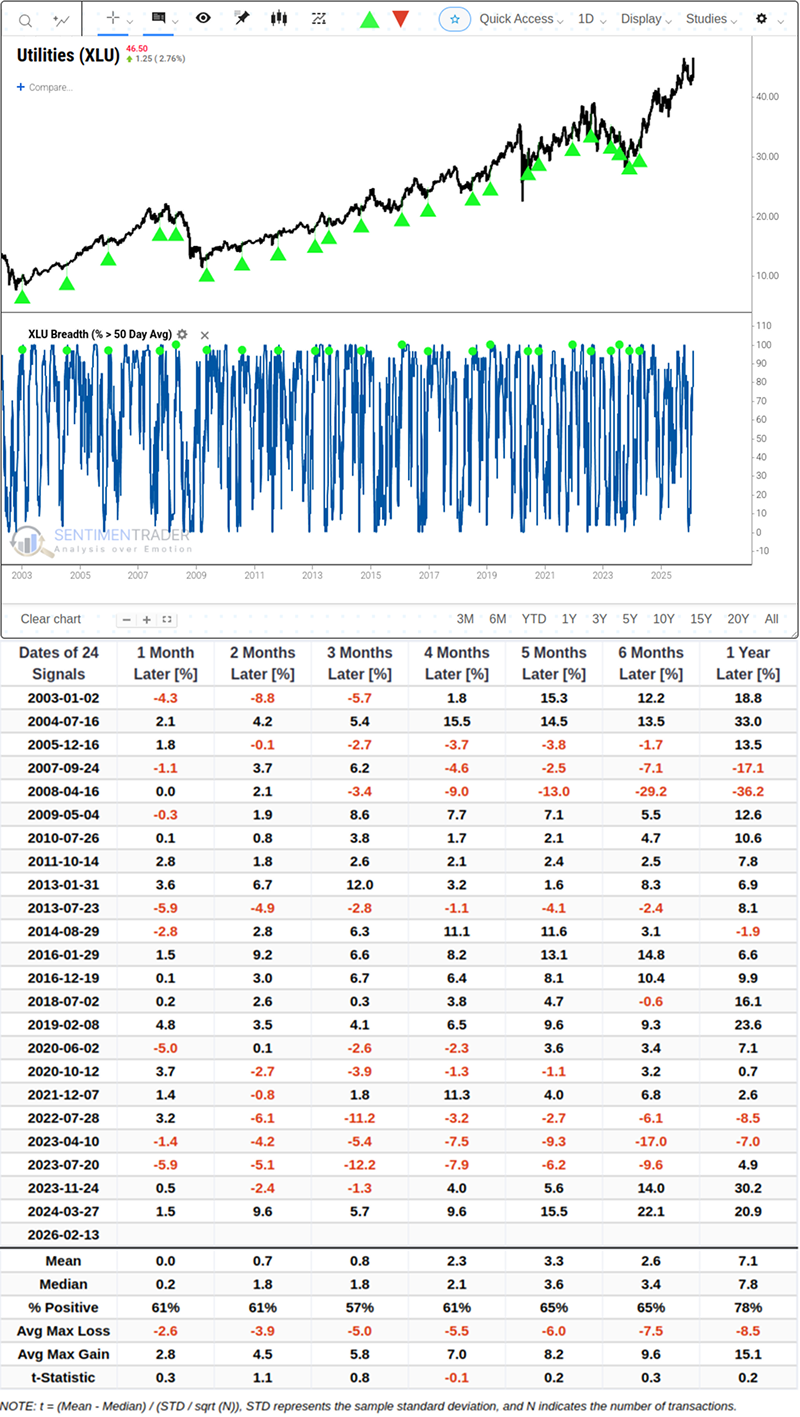
Statistics show that one year after this signal is triggered, XLU records a positive return probability of 78%, with an average return of 7.1%.
It is important to note, however, that this long-term constructive outlook has not historically been a straight upward path, and is sometimes accompanied by short-term "washouts" for confirmation. In the first month following signal triggers, historical data shows an average maximum drawdown of -2.6%.
You can achieve this sequential signal trigger condition by following the settings below.
Practical Considerations of Seasonal Factors
Finally, we turn our attention to calendar effects. The current market is in mid-to-late February, which is not historically a "sweet spot" for the Utilities sector.
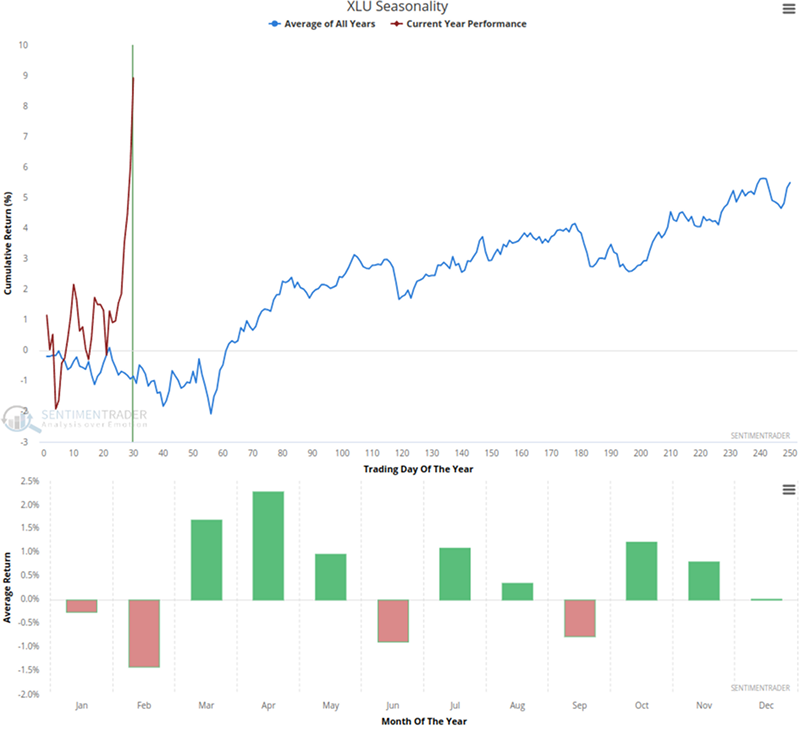
Observing the annual average performance path, the sector has historically tended to post negative returns in February, often forming a cyclical low, before re-entering a window with higher probability of positive returns in March-April. The current counter-seasonal surge demonstrates extremely strong independent momentum; while deviating from historical averages, it also means chasing highs at this time faces dual headwinds of "mean reversion" and "seasonal weakness".
What the Research Tells Us
Based on historical backtests and the current data snapshot, we believe market pricing for defensive assets may have entered a region of "relatively elevated sentiment" in the short term. The Breadth Thrust signal provides logical support for a long-term structural bullish stance, but current overbought indicators and seasonal deviations suggest that, in the absence of new catalysts, the statistical probability of price corrections or sideways consolidation in the coming period is high.
For market participants, these data indicate that in the current extreme zone, the risk-reward ratio of short-term chasing highs is declining. A rational approach is to monitor whether this momentum can translate into a sustained trend, while remaining vigilant of volatility risks in the extreme zone. Of course, the stock market does not rely entirely on a specific set of indicators and signals; extraordinary events or drastic changes in the macro environment can also lead to unanticipated trends.