
Extreme Crowding in Consumer Staples Stocks

Key Points:
- Geopolitical uncertainty has driven capital inflows into the consumer staples sector
- Multiple indicators point to intense buying activity in the consumer staples space
- When so many indicators show extreme readings simultaneously, XLP tends to deliver weak performance in the subsequent period
"Safe Haven" Crowding in Defensive Assets
Amid recent market volatility, investors have shifted their focus to the defensive consumer staples sector. While technology stocks faced sell-offs over the past week, the consumer staples sector moved higher against the trend. However, this one-way capital inflow has pushed various XLP indicators into historical extreme territory.
For safety-seeking investors, this presents a paradox: strong price gains are typically viewed positively, but extreme short-term strength in defensive sectors often signals crowding.
Extreme Readings Across Multiple Indicators
This buying pressure has triggered extreme readings across several key indicators:
XLP Panic Breadth Composite measures panic levels within the sector. On January 14, 2026, the indicator fell below 9, indicating an absence of panic.
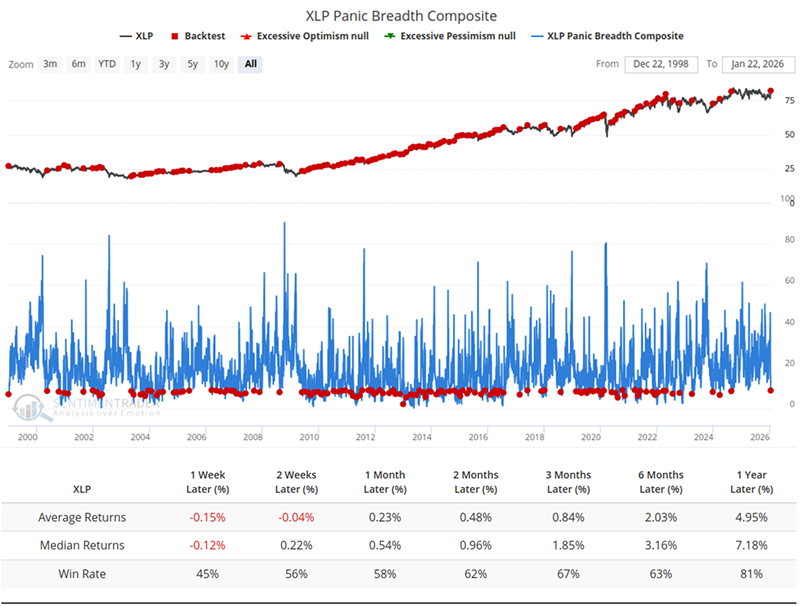
Historical performance data for XLP in such scenarios shows that excessive short-term market complacency is usually followed by a "cold shower" (price correction).
Another indicator measuring buying frenzy is Staples - % of Stocks with a 10-Day RSRR >= 80%. On January 20, 95% of XLP constituent stocks had a 10-day RSRR ranking in the top 20% of the market.
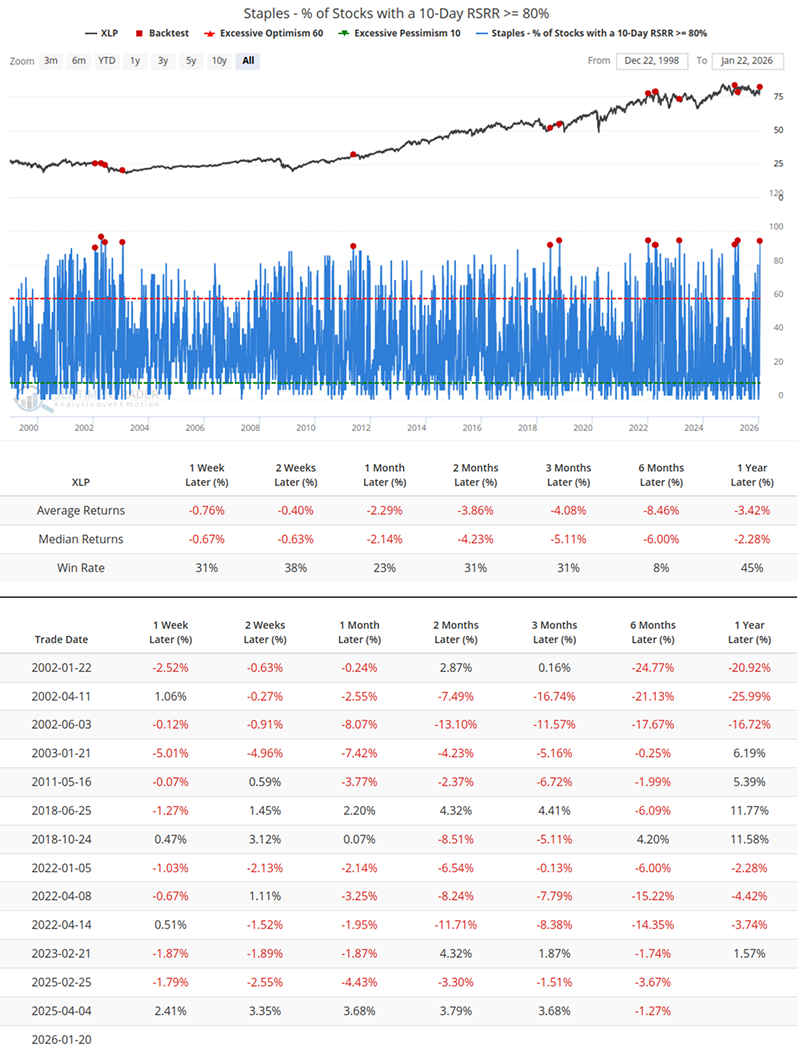
Historical data reveals that when nearly all stocks become leaders, there is no room for rotation within the sector. In the short term, the sector posted an average return of -8.46% over the subsequent 6 months in past similar cases, with a win rate of only 8%.
The sharp price surge has created statistical anomalies. Earlier this week, approximately 50% of XLP stocks broke above the Bollinger Bands upper band simultaneously.
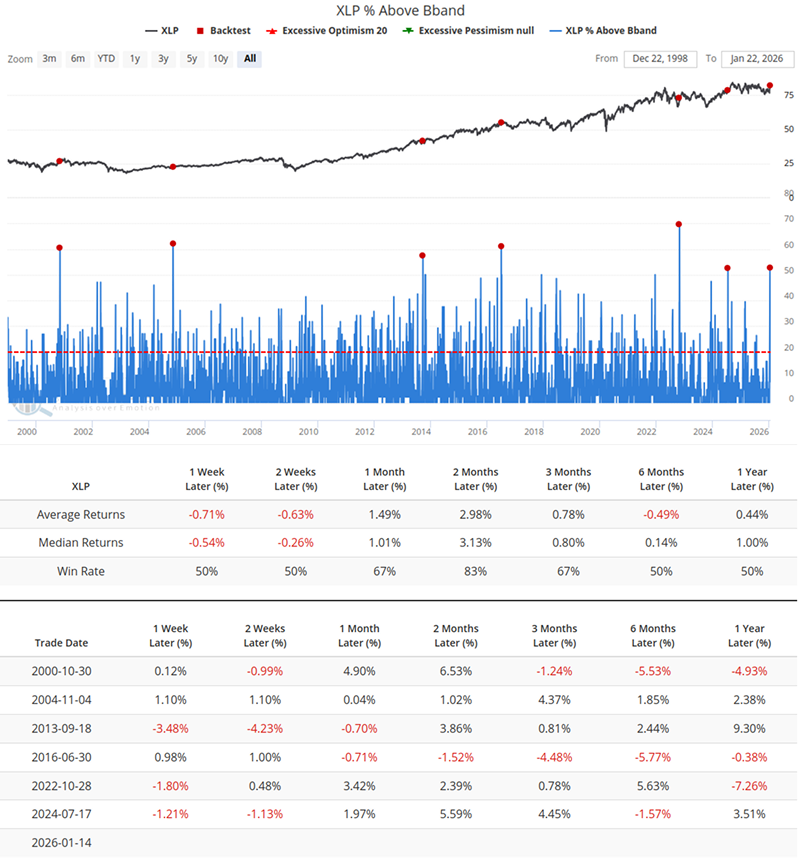
Historical backtesting indicates that such signals are typically followed by short-term correction pressure, with long-term returns tending to be mediocre or negative.
Momentum indicators have also issued overbought alerts: around 35% of XLP constituents had a 14-day RSI exceeding the 70 overbought threshold.
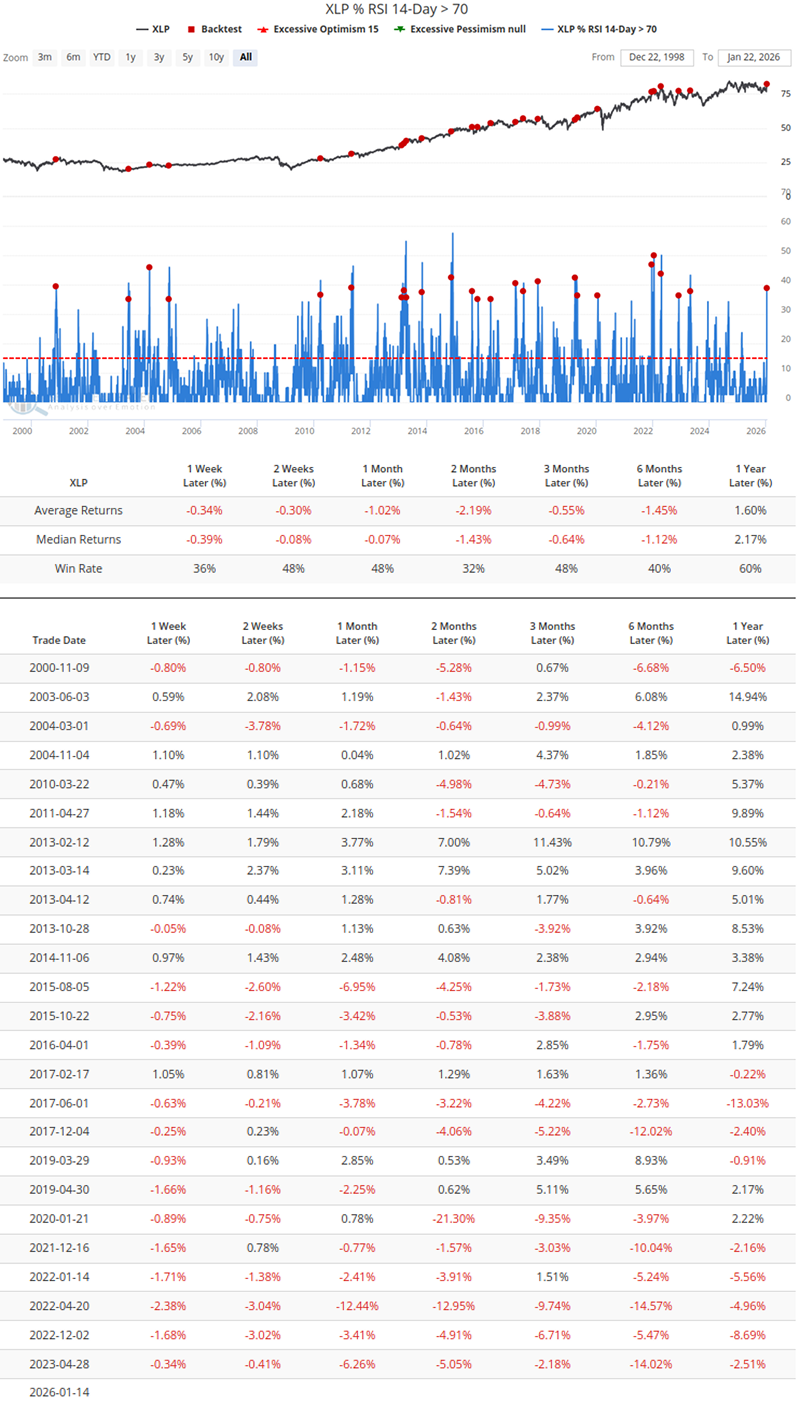
Data analysis shows that XLP's average returns turned negative over both 3-month and 6-month horizons following such signals.
Market optimism is further reflected in the disappearance of weak stocks: the proportion of XLP stocks with short-term relative weakness (10-day RSRR <= 20%) has dropped to 0%. This creates a "no one left behind" rally, where even companies with the worst fundamentals are rising.
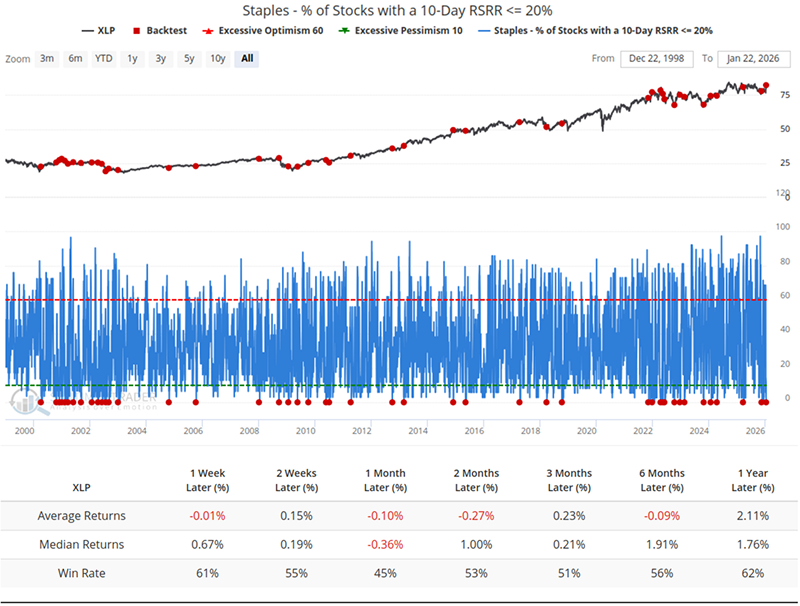
In the long run, this perfect state is unsustainable, with an average 6-month return of just -0.09% following such conditions.
Breadth indicators measuring medium-term trend health have also peaked: as of January 21, approximately 85% of XLP constituents were trading above their 50-day moving average. Extremely high breadth is typically a bullish characteristic, indicating rallies driven by broad participation rather than just a few heavyweight stocks.
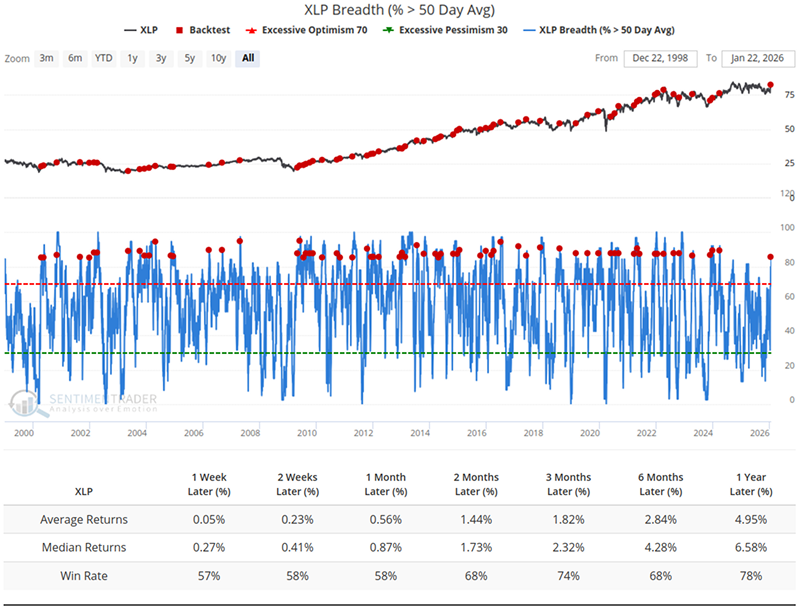
Historical data partially confirms this, with XLP delivering an average 6-month return of 2.84% (68% win rate) after such signals.
The McClellan Oscillator has recently soared to a high around 100. This indicator measures market breadth momentum, and such elevated readings represent an extremely strong pulse of capital inflows.
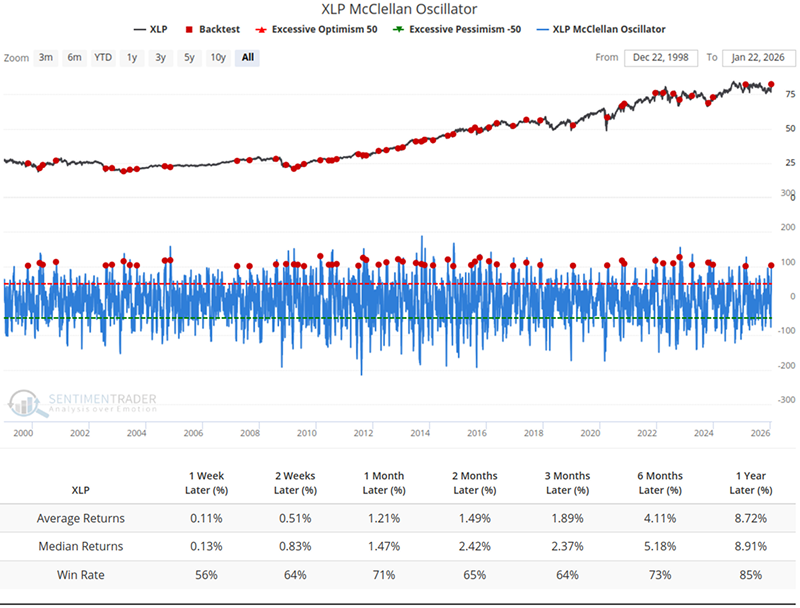
Historical data shows this indicator is typically associated with positive long-term returns (+4.11% over 6 months).
Convergence of Signals
To quantify this multi-dimensional crowding, we constructed a composite count model using all the above indicators. Simultaneous extreme readings across multiple indicators are extremely rare. The chart below shows that the number of indicators triggering "extreme conditions" reached 4 over the last 5 trading days. Such resonance (Count >= 5) has occurred only a handful of times in the past 25 years.Related Backtest Click Here.
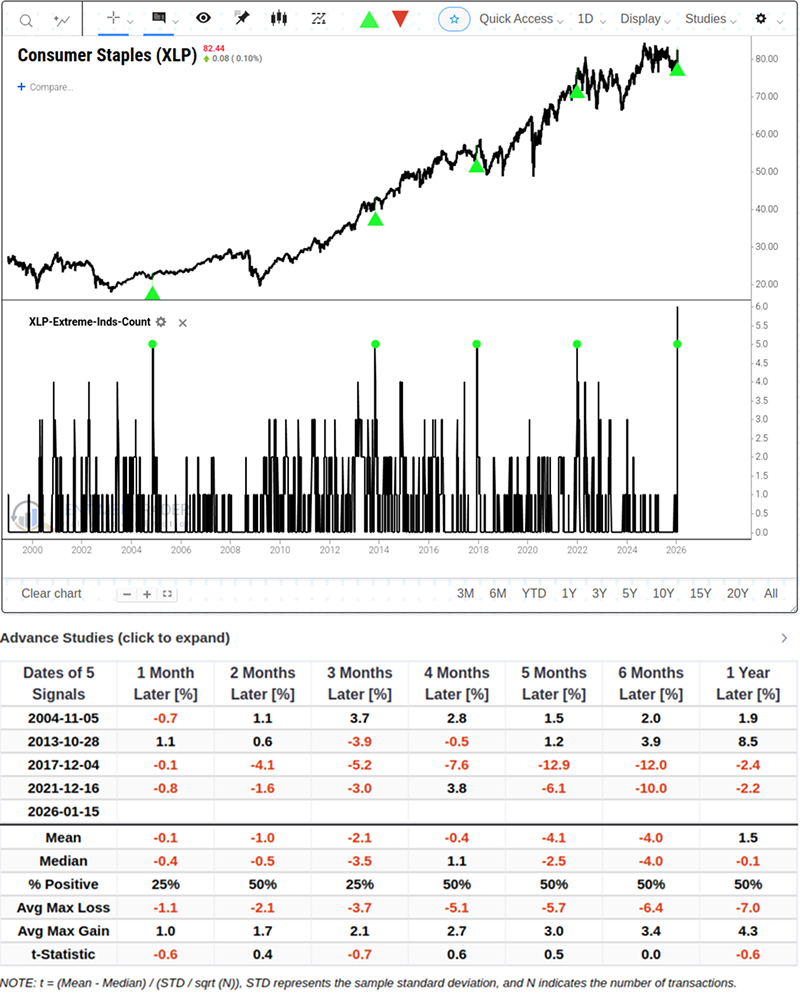
Our composite count indicator reveals that when markets reach such crowded levels, XLP's average returns turn significantly negative over the next 3 months (-2.1%) and 6 months (-4.0%). This multi-indicator resonance serves as a strong medium-term risk warning.
If we slightly relax the criteria to include cases with at least 4 indicators triggering extreme conditions, the sample size increases from 4 to 12 instances.Related Backtest Click Here.
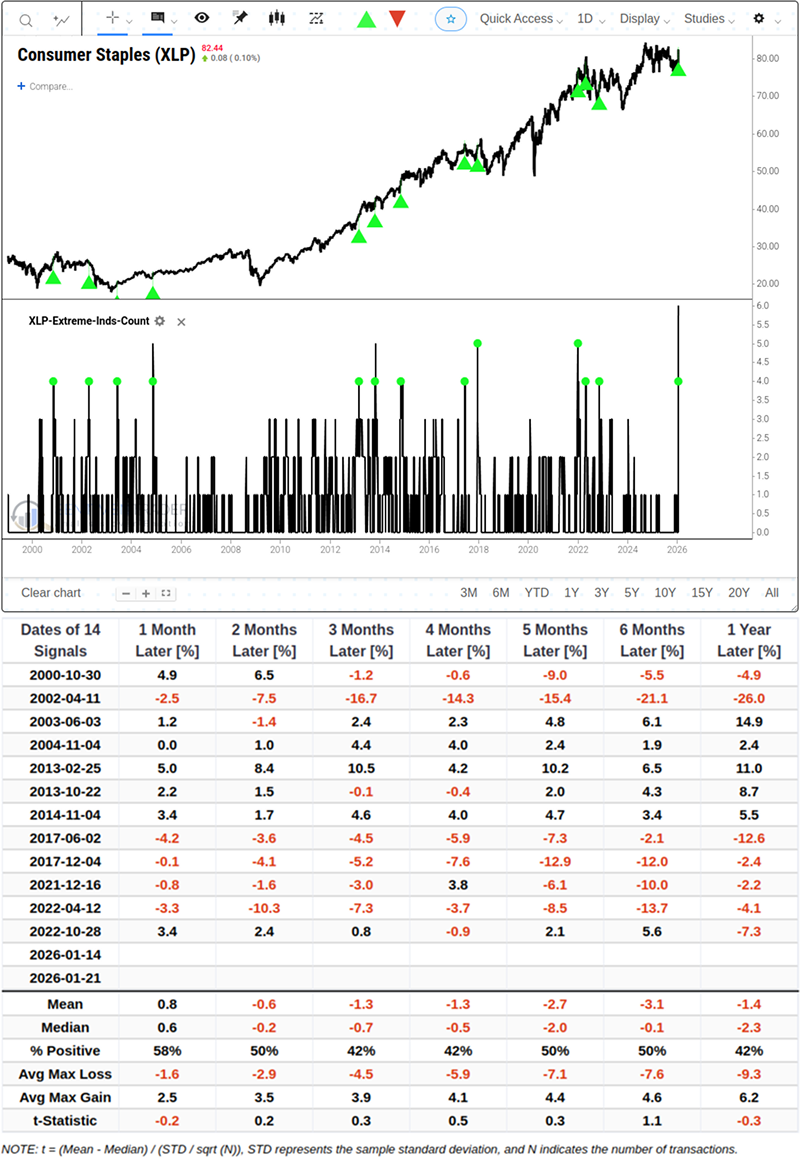
Analysis shows that 3 months after signal triggers, average returns quickly turn negative to -1.3%; by 6 months, average losses expand to -3.1%, with an average maximum potential loss of -7.6% - and win rates below 50% in both periods.
What the Research Tells Us...
Recently, geopolitical uncertainty has prompted investors to rapidly adjust their asset allocations, making the consumer staples sector a primary capital safe haven. This concentrated inflow - both rapid and intense - has pushed the sector's technical profile from its usual "stable" state to historically rare "crowded" levels.
When the composite count indicator shows such extreme readings, historical data suggests the sector's usual "defensive" characteristics may face challenges in the coming months. Looking back at similar historical scenarios, when defensive assets are driven higher by overcrowded trading, XLP typically struggles to maintain excess returns over the subsequent 3-6 months, even facing mean reversion pressure.
This does not signal an inevitable crash, but it does remind us that increasing exposure at current historically extreme levels may require taking on higher volatility risk than normal.