
Extreme bearishness in gold creates bullish scenario for GLD

Key points
- Trader sentiment for the SPDR Gold Shares (GLD) just touched an extreme level
- Following similar sentiment washouts, GLD has posted an 89% win rate over the subsequent 12 months, with median returns over 10% and a risk/reward profile that heavily favors the upside.
- GLD recently suffered a rapid ~18.5% drawdown from its 52-week highs. Historically, sell-offs this intense have been a reliable signal that an intermediate-term bottom is in.
- Gold miners are in a state of total capitulation. Internal breadth has evaporated with 95% of constituents now technically in a bear market (down 20%+ from highs). This magnitude of capitulation typically precedes robust mean-reversion rallies in the miners (GDX).
The Crowd is Fleeing Gold
Since the late 1970s, gold pundits have promoted the yellow metal as "a store of value" and a "hedge against uncertainty." Recently, however, escalating geopolitical events have injected severe volatility into gold pricing. The overarching market narrative suggests that prolonged conflict raises the probability of an inflationary rebound, which in turn could force interest rates higher. Higher real rates historically act as a headwind for non-yielding assets like gold. Furthermore, history shows that on many occasions when stocks and/or bonds have experienced turmoil, gold either did very little or followed suit.
The flush-out of gold presents a compelling quantitative setup. The Optix indicator for the SPDR Gold Trust (GLD) is now severely oversold, with its latest reading at 19.11. Crucially, despite the recent plunge, GLD remains above its 200-day moving average, indicating the secular uptrend remains intact. Our analysis focuses on this sharp unwinding of bullish sentiment and the opportunity it creates.
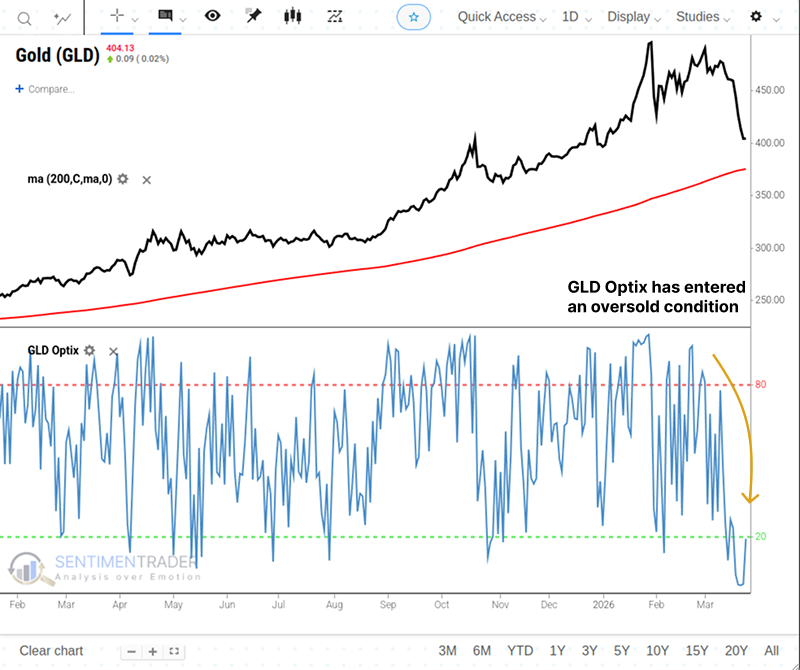
GLD Optix flashes a potentially favorable signal
Our GLD Optix indicator is a proprietary composite based on the following data points:
- Trading activity in put options versus call options
- Future volatility expectations
- Average discount of the fund to its NAV
- Price behavior
Each measure is ranked against its historical norms to determine whether the current level is at an extreme, then totaled to come up with an overall score. The Optix ranges from 0 (maximum pessimism) to 100 (maximum optimism), typically oscillating between 20 and 80.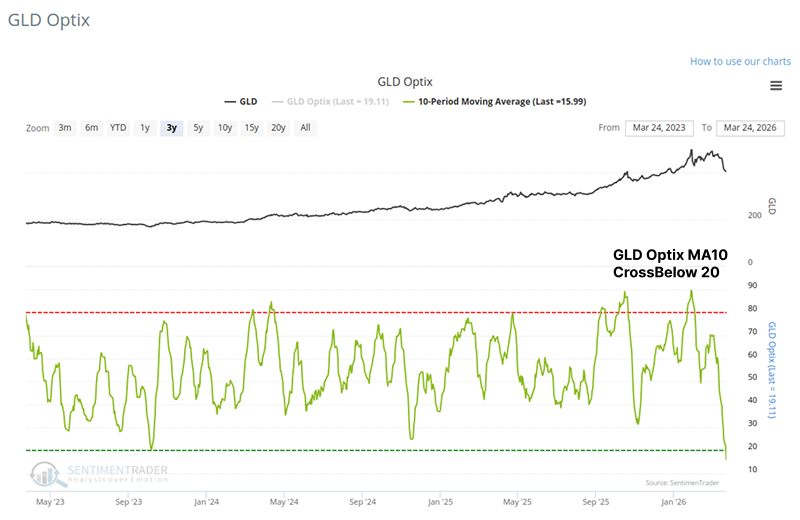
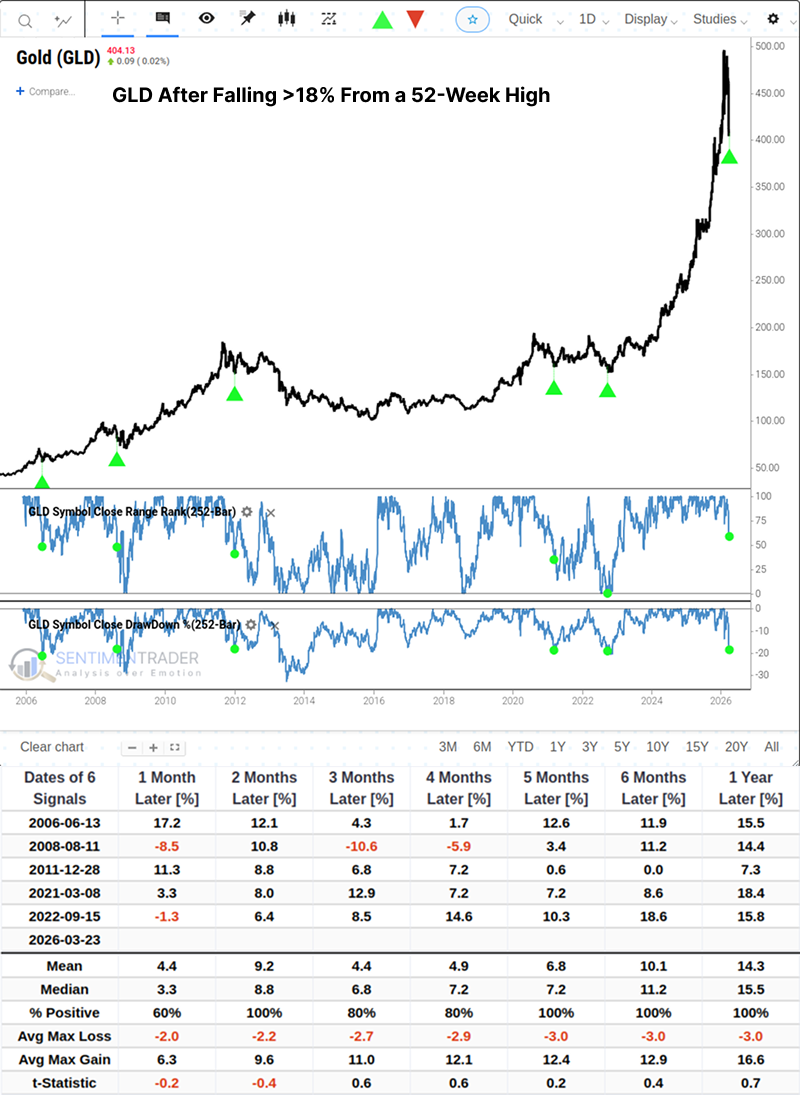
For this study, we applied a 10-day moving average to the daily GLD Optix readings. The chart below highlights all dates when the 10-day average of GLD Optix dropped below 20% (meaning 80% of traders were persistently bearish over a two-week period). The most recent signal triggered yesterday, Mar 24, 2026.
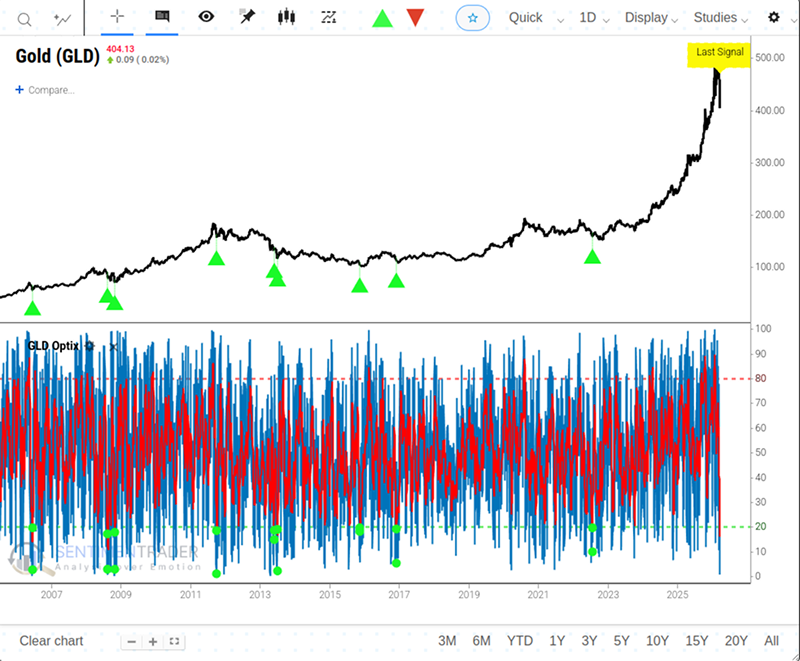
The table below summarizes GLD's forward performance following these extreme pessimism readings. The most striking takeaway is the robustness of the long-term data: an 89% win rate over a one-year horizon with a median return of +10.1%.
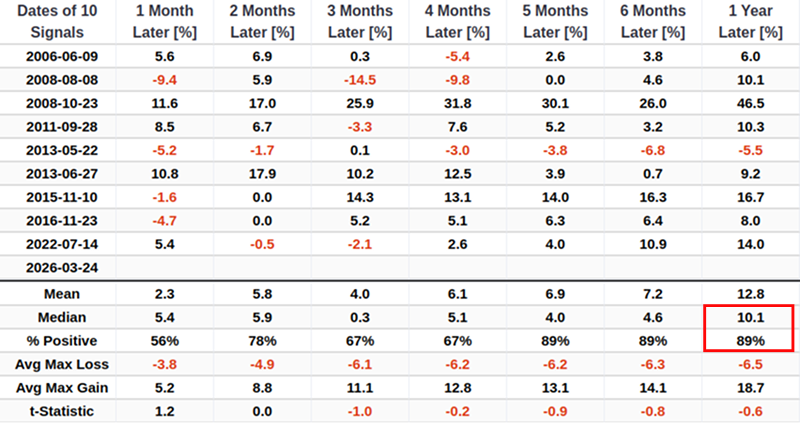
Over the one-year windows, GLD is roughly four times more likely to experience a 10% gain than a 10% drawdown. Across virtually all timeframes, the magnitude and frequency of maximum gains eclipse maximum losses.
A Familiar Pattern for GLD
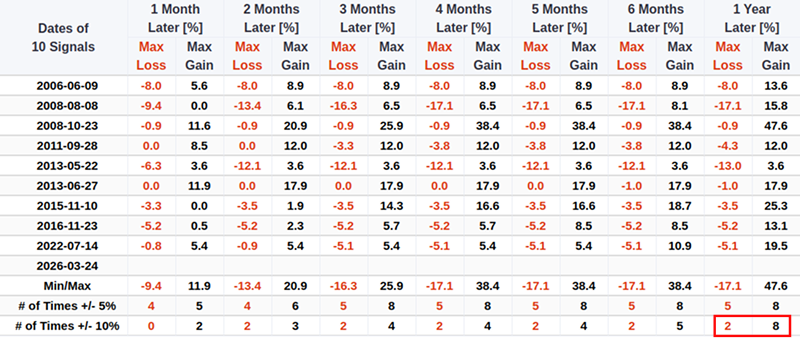
The heavily traded GLD fund has suffered a rapid drawdown of approximately 18.5%, though we observed minor stabilization on Tuesday. At least gold bugs can hang onto the idea that quick bear markets haven't been a bad time to bet on a rebound. The table below outlines historical precedents where gold fell more than 18% from a 52-week high. While the sample size is small, the forward returns show no significant downside over the following 5 months to one year. All of them rolled over quickly after that.
Additional context
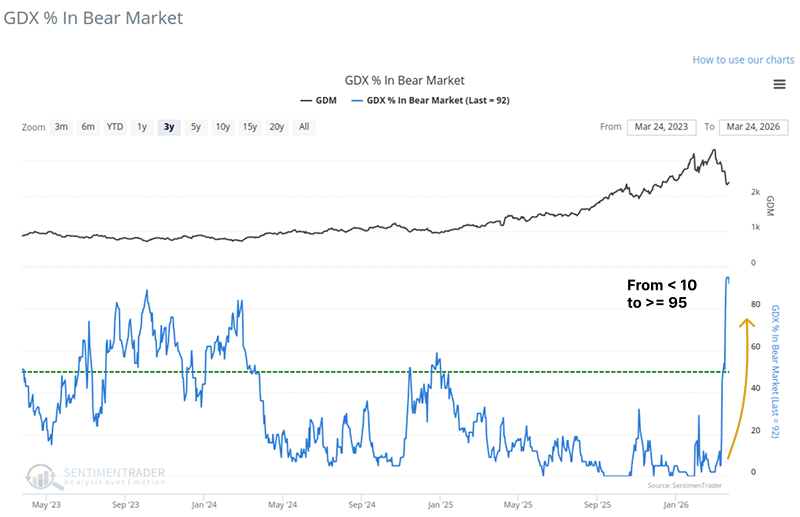
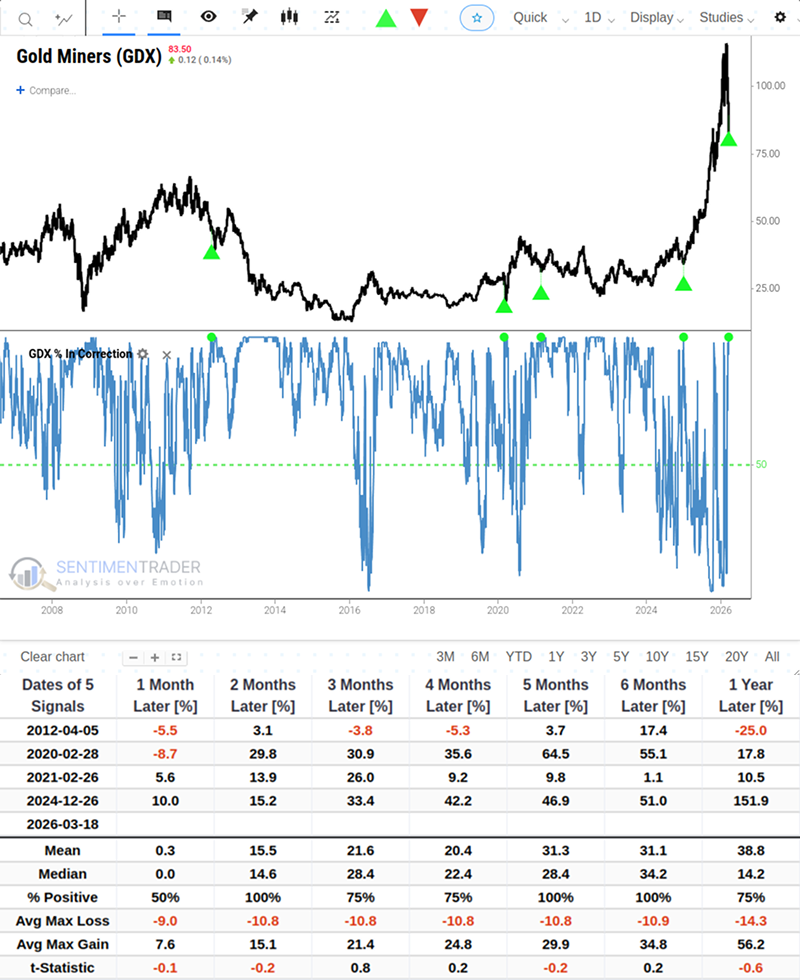
A key metric we track is GDX % In Bear Market (down more than 20% from their 52-week highs). Just one month ago, very few stocks met this criterion; as of last week, a staggering 95% of the sector is now in a bear market.
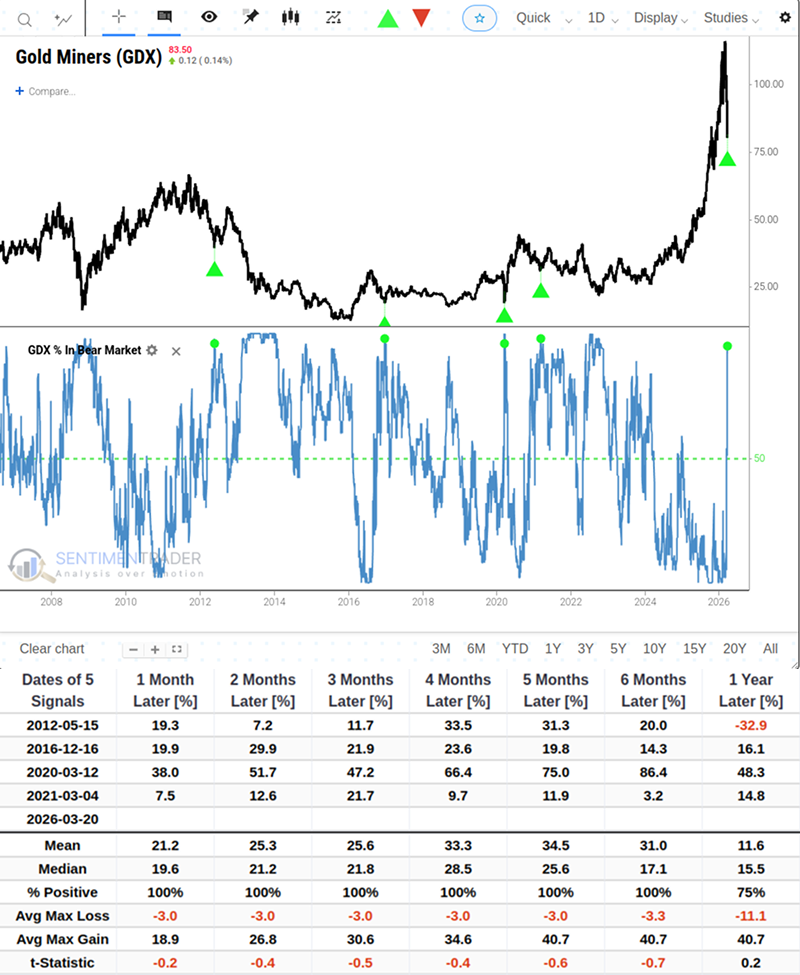
The table below details the forward returns for the Gold Miners ETF (GDX) when the percentage of its constituents in a bear market spikes from under 10% to 95%.
If a massive swath of mining stocks has entered a bear market, it stands to reason that nearly all of them are in a correction phase (defined as a drop of at least 10% from highs). Here, too, we have witnessed a dramatic reversal. Earlier this month, fewer than 10% of miners were in a correction; last week, 100% of them are.
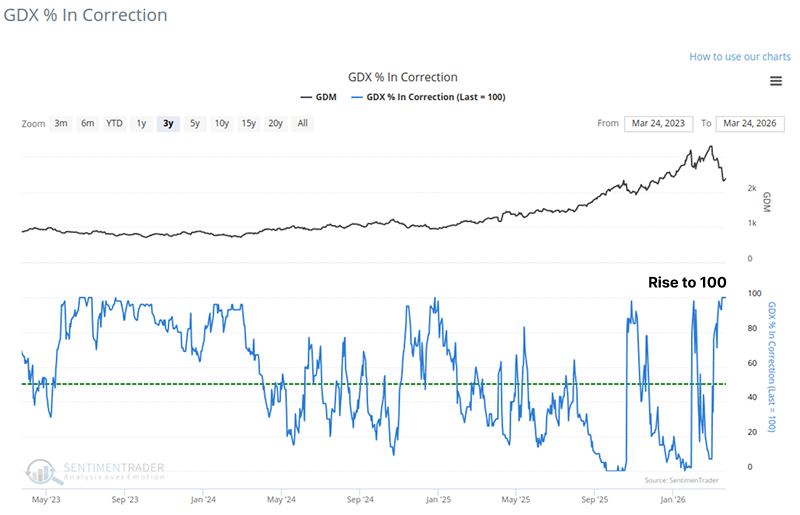
Historically, when breadth collapses this completely, it acts as a clearing event. Mining stocks display a highly positive bias over the subsequent two months, and similar capitulation signals have consistently preceded robust upward trends. For related backtest, click here.
What the research tells us…
GLD is currently oversold, and trader sentiment has reached levels typically seen prior to past price rebounds. Meanwhile, the internal breadth of the gold mining sector (GDX) has virtually stalled, with 95% of its components having fallen into bear market territory in just a few weeks. We believe this combination of severe price compression, completely exhausted market breadth, and extreme pessimism is not a cause for panic, but rather a classic contrarian trading opportunity. Given that GLD's long-term trend (the 200-day moving average) remains intact, and historical data strongly suggests that "weak-handed investors" have been shaken out, this creates a highly asymmetric and high-probability entry point for a long position over the next 3 to 12 months.
Nevertheless, buying during a sharp price decline-especially amid rapidly evolving geopolitical developments-carries significant risk. No single indicator is absolutely reliable, and investors should make their own judgments based on the latest market conditions and information.