Products
SentimenTrader Trading Tools
‍
Backtest Engine
My Trading Toolkit
Correlation Analysis
Seasonality
Market Prediction
Indicators & Data API
‍
Proprietary Indicators & Charts
Market Data API
Strategies & Scanner
‍
50+ Trading Strategies
Smart Stock Scanner
Smart Option Scanner
Research Reports
‍
Research Solutions
Reports Library
Free Resources
Simple Backtest Calculator
Simple Seasonality Calculator
The Kelly Criterion Calculator
Sentiment Geo Map
Public Research Reports
Education
Sentiment Indicators
Technical Indicators
Pricing
Company
About
In the News
Testimonials
Client Success Stories
Contact
Log inLoginSign up
< BACK TO ALL REPORTS

Expensive stocks crushed volatility Again

by Sentimentrader
2026-05-28
A market signal tracking the spread between the S&P 500 forward P/E ratio and the VIX has crossed a key threshold for the first time in months. Historically, this condition suggests a bumpier ride but strong positive returns for stocks over the next year.

Key points

  • The forward P/E ratio on the S&P 500 is nearly six points above the VIX, crossing back above 5.5 for the first time in more than three months
  • Across 21 prior signals of the spread crossing above 5.5 with at least a 63-day gap, SPX was higher a year later 81% of the time, averaging an 8.2% gain
  • The VIX was higher three months later 86% of the time, with a median surge of 47%, stocks rallied, but the ride got bumpier
  • The risk was contained but not absent

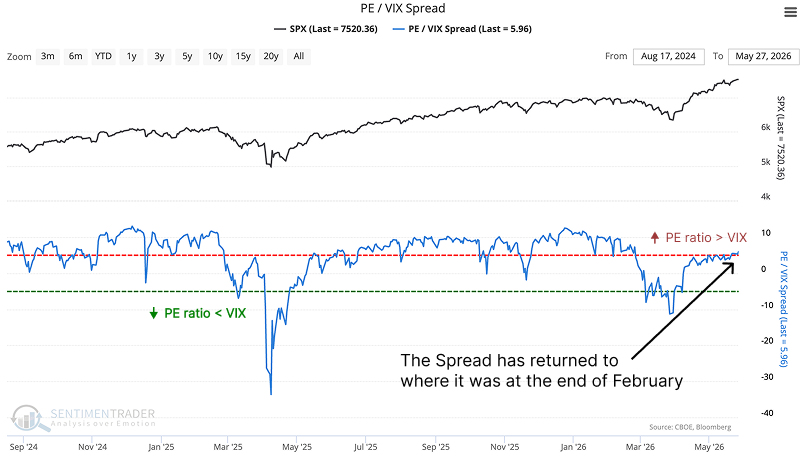
Back to February levels

Over the past few weeks, stocks have pushed higher and volatility has been crushed. The result is the widest gap between what investors are paying for earnings and what they are pricing in for future volatility since late February. The spread between the S&P 500 forward P/E ratio and the VIX has crossed back above 5.5, landing at 5.96 on Wednesday, the first time in more than three months.

The spread sat above 5.5 for most of 2024 and early 2025 before pulling back. Now it is back, and it took more than 63 trading days to get here. That gap matters. When the spread lingers above this threshold for weeks or months, the signal gets noisy, the market has already priced in the complacency. The first surge after an absence is different.

Sorry, you don't have access to this report

Upgrade your subscription plan to get access
Go to Dasboard
PRODUCTS
SentimenTrader
Trading Tools
Indicators & Data API
‍
Strategies & Scanner
‍
Research Reports
FREE
RESOUrCES
Simple Backtest
Calculator
Simple Seasonality
Calculator
The Kelly Criterion
Calculator
Sentiment Geo Map
‍
Public Research Reports
‍
Education
Sentiment Indicators
‍
Technical Indicators
‍
Pricing
Bundle pricing
‍
FAQ
‍
Announcements
‍
COMPANY
‍
About
‍
In the News
‍
Testimonials
‍
Client Success Stories
CONTACT
‍
General Inquiries
‍
Media Inquiries
‍
Financial Professionals Inquiries
‍
© 2026 Sundial Capital Research Inc. All rights reserved.
Setsail Marketing
TermsPrivacyAffiliate Program
Risk Disclosure: The information and tools provided are for research and analytical purposes only and are not intended as investment advice. Market analysis involves uncertainty, and outcomes may differ from expectations. Users should conduct their own due diligence and consider their individual circumstances before making any financial decisions. Past performance is not necessarily indicative of future results.

Hypothetical Performance Disclosure: Hypothetical performance results have many inherent limitations, some of which are described below. No representation is being made that any account will or is likely to achieve profits or losses similar to those shown; in fact, there are frequently sharp differences between hypothetical performance results and the actual results subsequently achieved by any particular trading program. One of the limitations of hypothetical performance results is that they are generally prepared with the benefit of hindsight. In addition, hypothetical trading does not involve financial risk, and no hypothetical trading record can completely account for the impact of financial risk of actual trading. for example, the ability to withstand losses or to adhere to a particular trading program in spite of trading losses are material points which can also adversely affect actual trading results. There are numerous other factors related to the markets in general or to the implementation of any specific trading program which cannot be fully accounted for in the preparation of hypothetical performance results and all which can adversely affect trading results.

Testimonial Disclosure: Testimonials appearing on this website may not be representative of other clients or customers and is not a guarantee of future performance or success.