
Exhaustion but not Initiation

Key points:
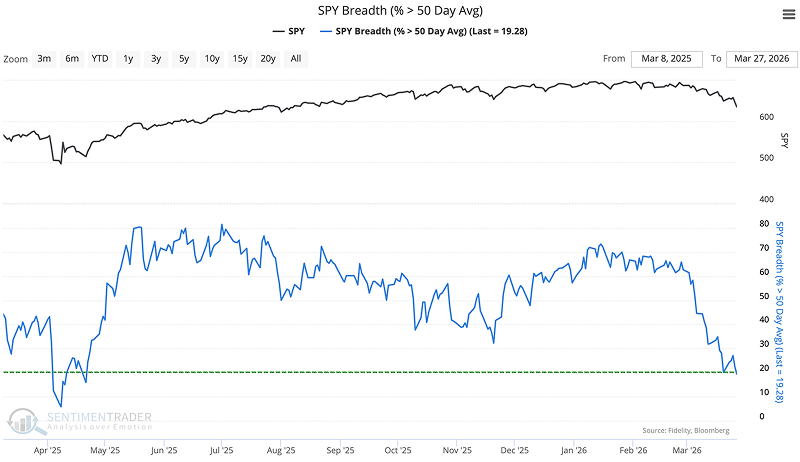
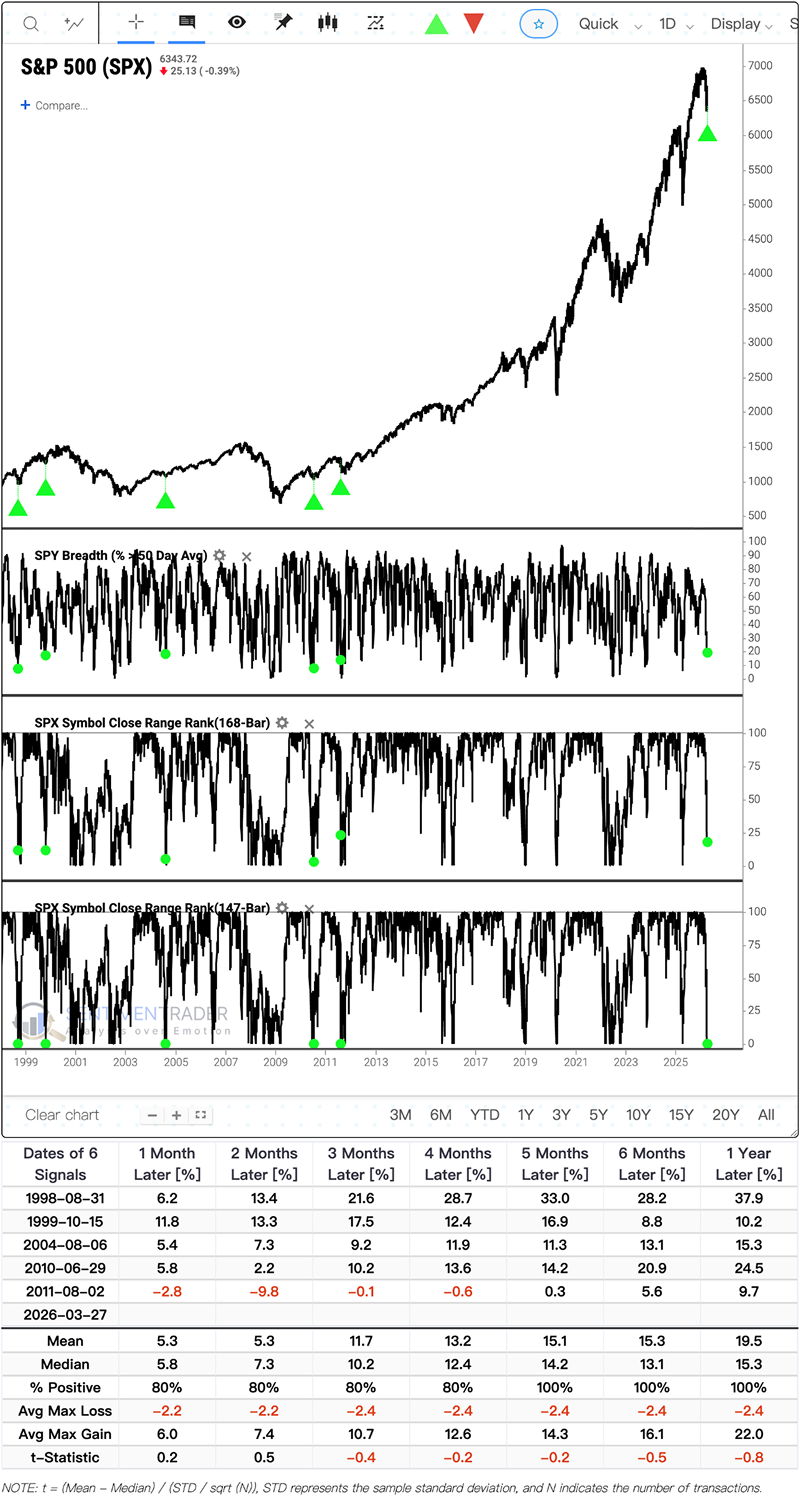
- The percentage of S&P 500 stocks trading above their 50-day moving average collapsed below 20%.
- The S&P 500 registers a 7-month low but not an 8-month low, completing a specific topping pattern.
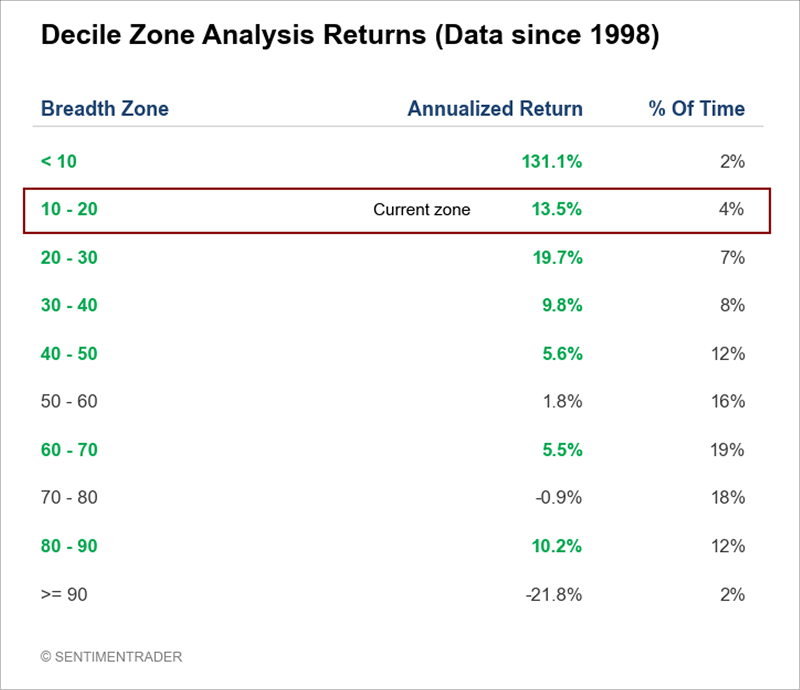
- Operating in the current depressed breadth zone alongside this price breakdown heavily favors bulls over the medium and long term.
The internals break first
Under the hood, the damage is severe. The percentage of S&P 500 stocks trading above their 50-day moving average collapsed below 20%.
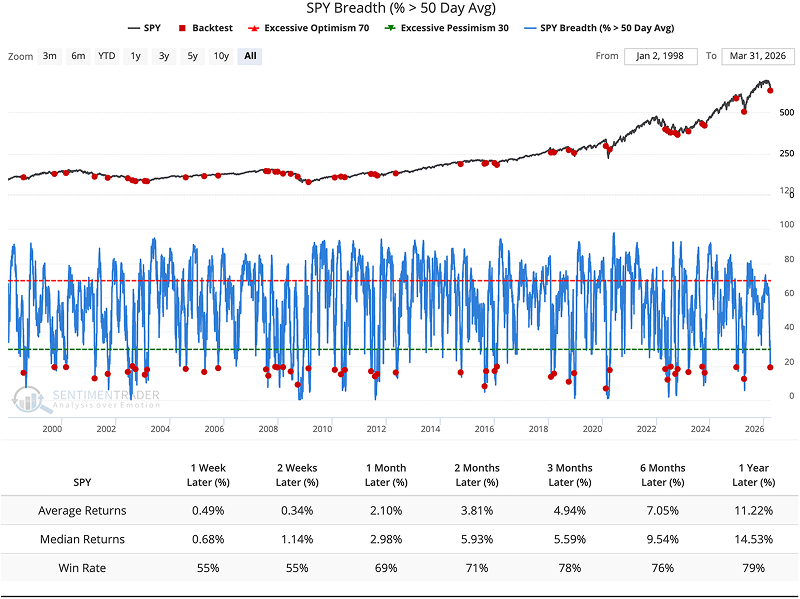
Historically, this specific breadth washout marks exhaustion. Since 1998, looking out one year from these signals, the index was higher 79% of the time, delivering a median gain of over 14%. The immediate path forward is noisier, with a coin-flip 55% win rate over the next two weeks, but the upside skew strengthens significantly by month three.
A breakdown in context
The surface-level price action looks vulnerable. The S&P 500 recently undercut support, registering a new 7-month low. The catch is that it avoided a broader 8-month low, finalizing a specific short-term topping pattern.
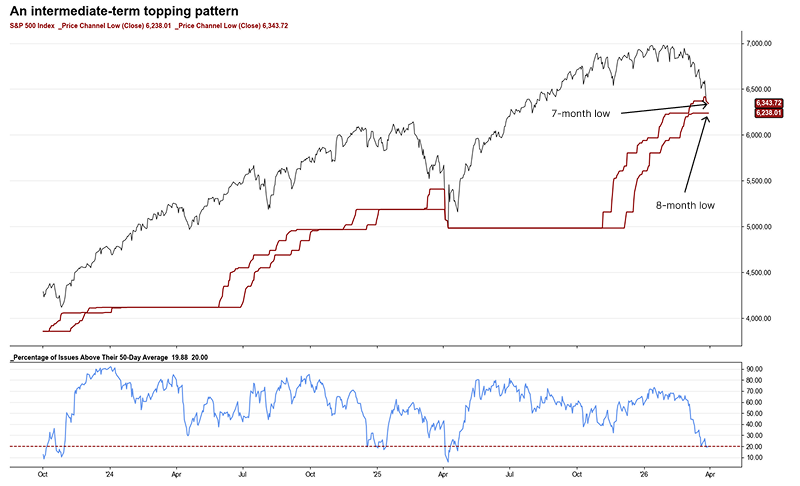
Momentum traders often view this type of oversold breakdown as the start of a cascading decline. But data shows that the medium- to long-term win rate isn't low.Related Backtest Click Here.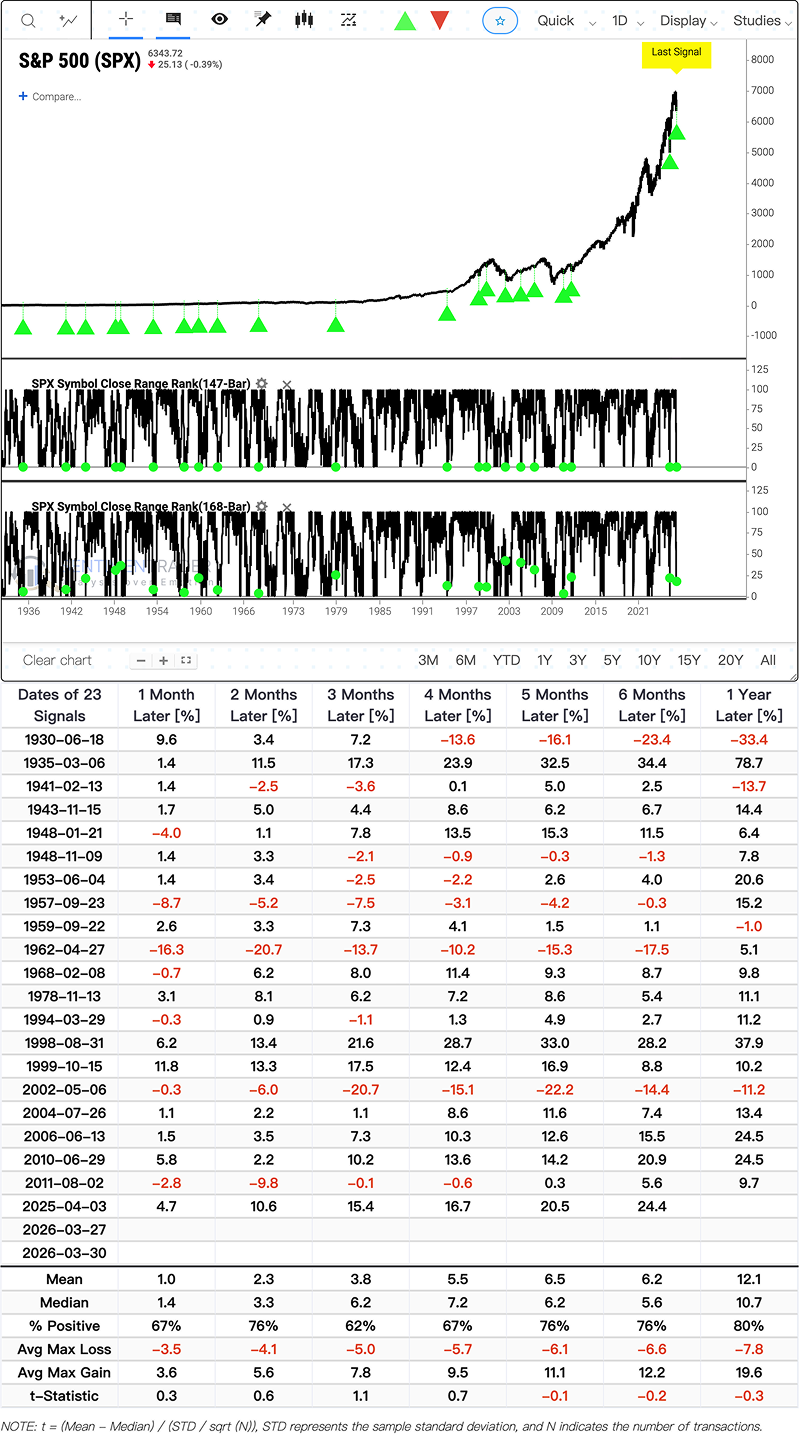
Exhaustion over initiation
Combining the 7-month low pattern with intermediate breadth washing out below 20% isolates a highly constructive baseline. When these conditions trigger simultaneously, it historically marks the end of a selloff rather than the start of a structural bear market. However, signals that appear very rarely in history carry limited statistical power, warranting caution when applying unconditional win rates to the current macro environment.Related Backtest Click Here.
Offsetting the fear of a broader collapse is the historical performance within this specific breadth bucket. Simply existing in the 10% to 20% zone generates a 13.5% annualized return for the broader index. The upside skew becomes extreme if the selling accelerates further. Should breadth wash out below the 10% threshold, the annualized return historically jumps to over 130% (based on a limited sample of short-term reversals).
What the research tells us...
The S&P 500 triggered a topping pattern defined by a 7-month low, accompanied by a severe breadth washout below 20%. Similar historical breakdowns have reliably preceded strong medium-to-long-term returns, heavily skewing the risk-reward in favor of the bulls over a 6-to-12 month horizon. Offsetting the bearish surface-level price action is the surprisingly robust performance of the index when breadth sits in this specific 10% to 20% zone. The downside risk is historically contained, provided a larger structural bear market isn't actively unfolding.