
Examining a Favorable Setup Involving AAII Bulls

Key points:
- AAII measures the percentage of its members who are bullish or bearish on stocks each week
- When these readings reach an extreme, it often points to an imminent turning point in the market
- For trend-following investors, it can make sense to wait for readings to move back towards the middle following a dip in readings before taking action; We examine one such approach below
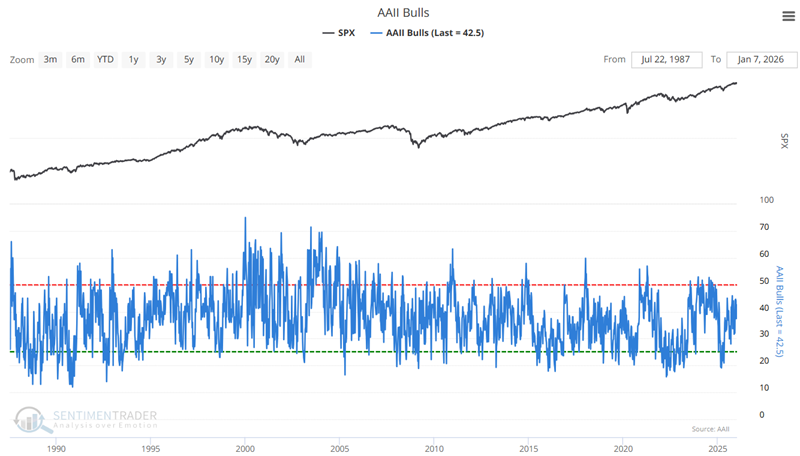
AAII Sentiment Overview
The AAII (American Association of Individual Investors) is a non-profit organization headquartered in Chicago and was founded in 1978. Their stated mission is: "assisting individuals in becoming effective managers of their own assets through programs of education, information, and research." It is affiliated with NAIC, the organization that helped so many investment clubs get started in the late 1990s.
Their niche market is individual investors, not professional traders, pension funds, or other institutional entities. Their focus, and that of the great majority of their membership, is long-term fundamental analysis of sound companies, using a minimal amount of technical analysis for decision-making purposes.
The AAII sentiment survey is a weekly poll conducted by that organization that intends to gauge the overall sentiment of its membership. They ask their membership where they think the market will be in six months, and group the responses into three categories: bullish, bearish, or neutral.
Like most contrarian indicators, when the survey indicates that too many investors are bullish, it often corresponds to market highs. Conversely, too many bears suggest that the market may soon find a low.
This note will focus on a specific setup involving AAII Bulls only. The weekly readings for AAII Bulls appear in the chart below. Note that, generally speaking, market tops are preceded by high readings. Additionally, reversals from extremely low readings typically correspond with market rallies. The question we will pose (and attempt to answer) is, "What happens when the data series starts to move into favorable territory?"
Zeroing in on a specific signal
For our purposes, let's zero in on a specific setup involving AAII Bulls:
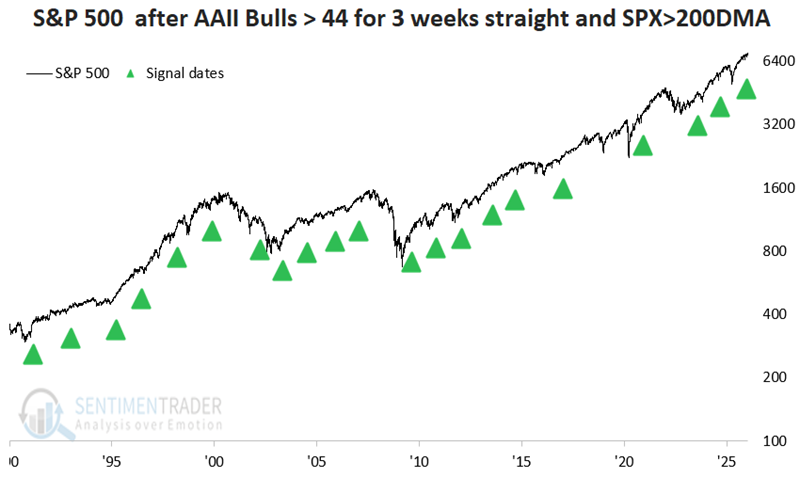
- After dropping below 44, AAII Bulls then remain above 44 for three consecutive weeks
- The S&P 500 Index is above its 200-day moving average
- Only one such setup is considered in any 12-month period
When this setup occurs, we will buy and hold the S&P 500 index for one year (specifically, 252 trading days).
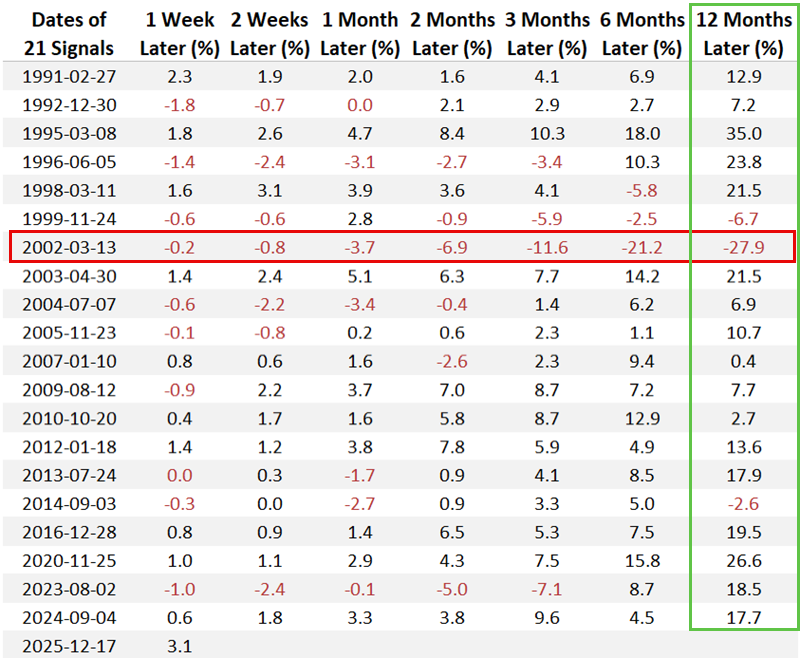
The chart below highlights the dates since 1990 when the criteria above were met. The most recent signal occurred on December 17, 2025.
The table below displays the S&P 500 index performance across the 12 months following each signal. Note that the March 2002 signal was awful, with the S&P 500 plunging 27% in the following year. This is a stark warning that this is not a "set it and forget it" type of signal. Still, overall, 12-month returns are solid.
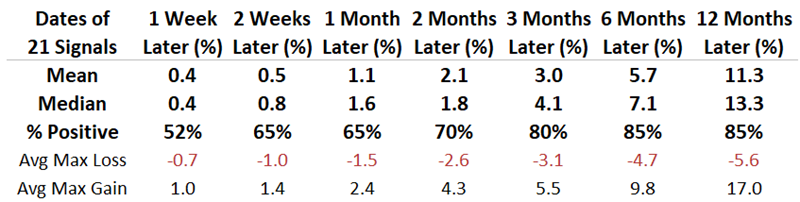
The table below summarizes the results from the table above. The key thing to note here is that Median Returns and % Positive readings rise with each successive time period.
The chart below illustrates the hypothetical growth of $1 invested in the S&P 500 index on a buy-and-hold basis (no stop-loss) for one year following each of the signals highlighted in the preceding charts and tables.
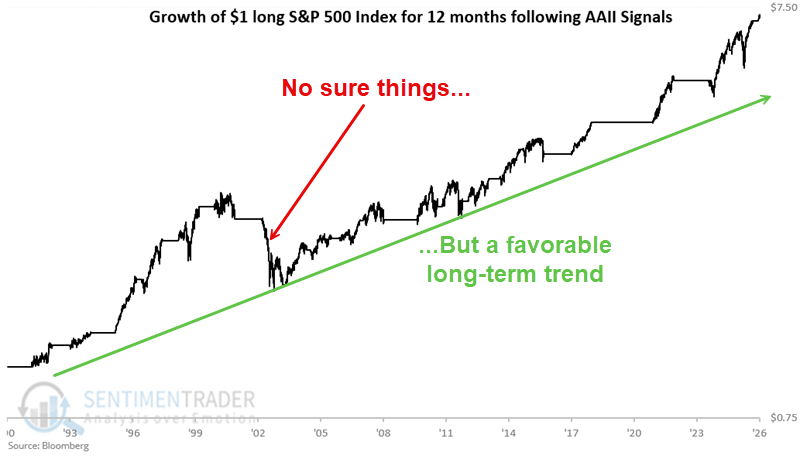
The "lower left to upper right" nature of the equity curve suggests that this signal lends solid weight to the favorable side of the weight of the evidence ledger. However, the significant drawdown following the 2002-03-13 signal reminds us that this is an "indicator signal" and not a "trading system."
What the research tells us…
One adage states that "sentiment tends to be wrong at the extremes and right in the middle." Another states that "the trend is your friend." The indicator signal highlighted here is a combination of the two. Waiting for the AAII Bulls to drop below 44% and then hold above that level for three straight weeks signifies a potential bullish confirmation signal. Additionally, incorporating a price filter that requires the S&P 500 index to be above its 200-day moving average at the time of the signal introduces some trend-following discipline to the strategy. The most recent signal on December 17, 2025, suggests that investors continue to give the bullish case the benefit of the doubt until given a reason to think otherwise. The overall result suggests paying attention if and when this signal occurs again in the future.