
EWG is looking nicht zer goot

Key Points
- The German stock market is entering its least favorable seasonal period
- German stock market price action has been weak
- Historically this has been a dangerous combination for investors
- Options offer traders a simple way to exploit bearish opportunities
A seasonally unfavorable period for EWG
The chart below displays the annual seasonal trend for ticker EWG (Germany iShares MSCI ETF).
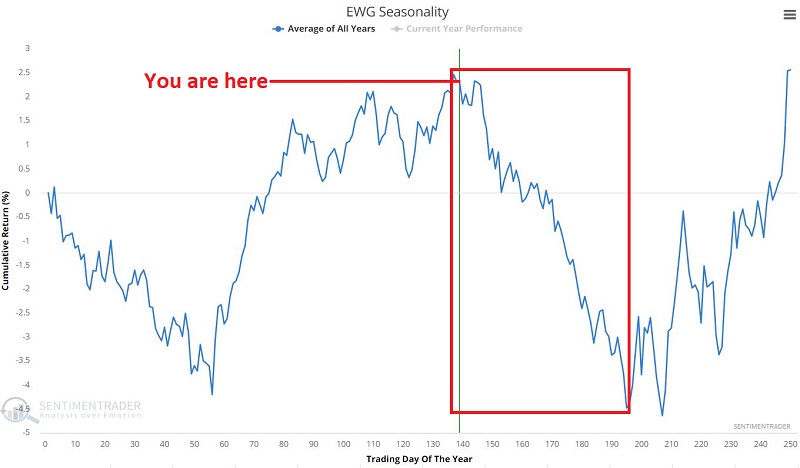
A very unfavorable period occurs between Trading Day of Year (TDY) #137 and TDY #195. For 2022, this period extends from 7/20/2022 through 10/11/1995.
The chart below displays the cumulative return for EWG if held long ONLY during this unfavorable period, every year since trading began in 1996.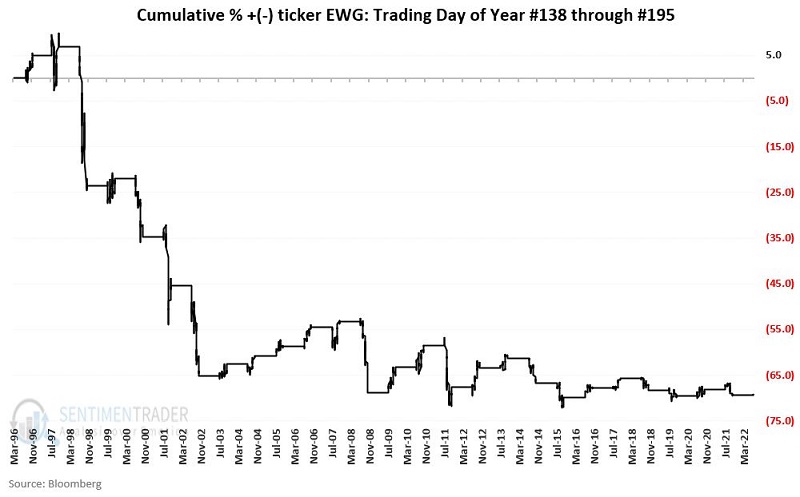
The table below displays a summary of performance.
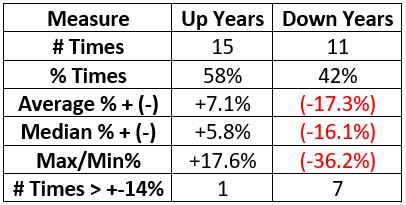
It is important to note that this period has seen EWG rise in price 58% of the time. However, the other key thing to note is that when EWG is good during this period, it is pretty good. But when it is bad during this period, it is very bad.
Adding a simple price filter
It is rarely a good idea to trade based solely on seasonality as a standalone indicator. So, let's add the most important indicator of all - price action.
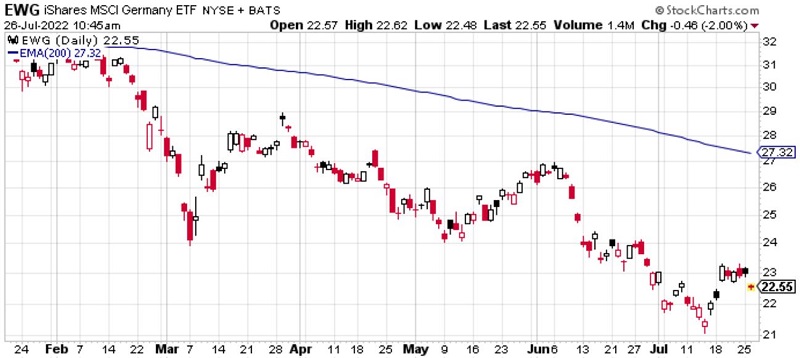
Let's add a 200-day exponential moving average to help designate the current price trend for EWG as "bullish" or "bearish." The chart below (courtesy of StockCharts) displays the ticker EWG versus its 200-day EMA. As you can see, the price is presently well below the 200-day EMA.
Let's focus solely on the period between TDY #138 and TDY #195.
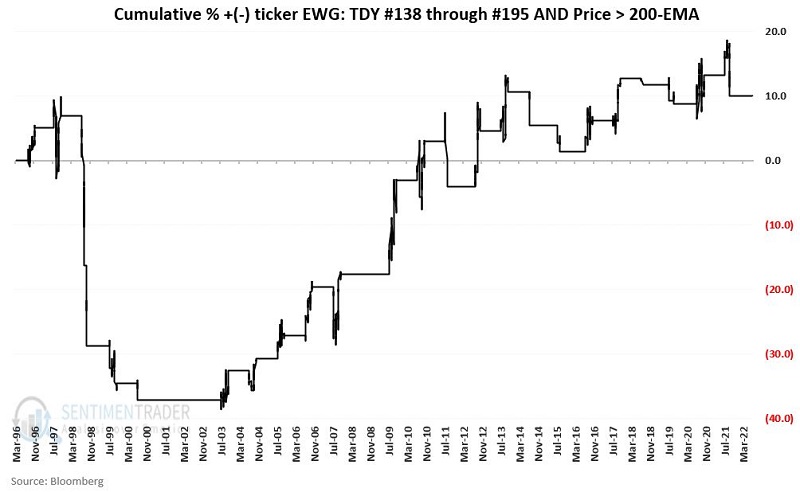
The chart below displays the cumulative % gain/loss for EWG when:
- TDY is between 138 and 195
- AND EWG is ABOVE its 200-day EMA
The chart below displays the cumulative % gain/loss for EWG when:
- TDY is between 138 and 195
- AND EWG is BELOW its 200-day EMA
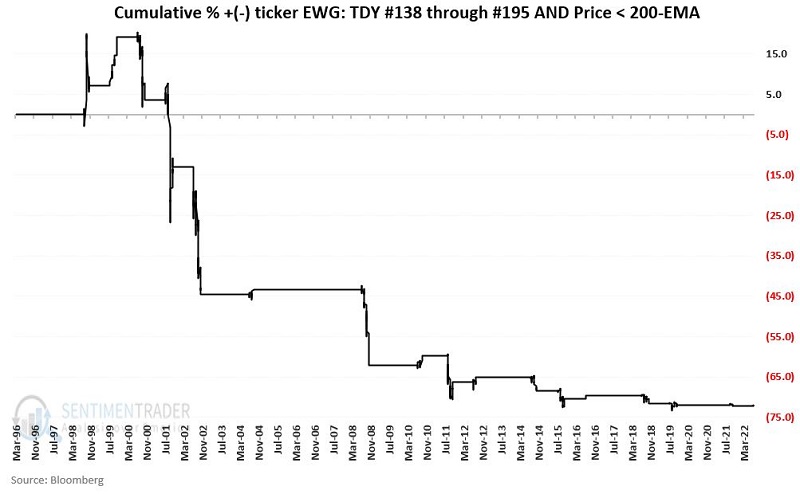
The results in the second chart are fairly self-explanatory. During this unfavorable seasonal period:
- Cumulative gain when EWG > 200-day EMA = +10%
- Cumulative loss when EWG < 200-day EMA = (-72%)
Playing with EWG puts
Most traders are unlikely to sell short shares of EWG. So, let's consider a bearish trade using options on ticker EWG. Because we are looking to emulate a short position in the shares, we will use a strategy that will give us point-for-point movement with the stock as quickly as possible.
The example trade involves buying the EWG Oct 25 put @ $2.80. The figures below (courtesy of Optionsanalysis) display the particulars and the risk curves.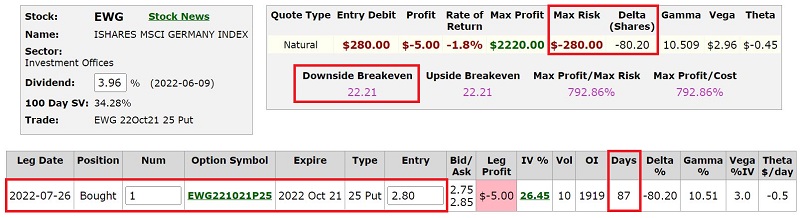
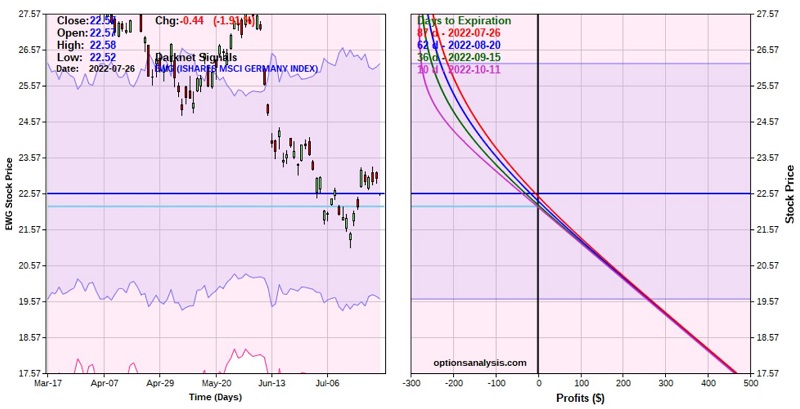
The lines in the chart above display the expected profit or loss as of a given date based on the price of EWG shares. Note that the purple line represents the expected P/L as of 10/11 (i.e., ten days before option expiration), the date on which the unfavorable seasonal period ends.
Things to note:
- The cost to enter a 1-lot - and the maximum risk - is $280
- The breakeven price (as of 10/11) is roughly $22.21 (EWG is currently trading at $22.57)
- Below the breakeven price, the put option price will move point-for-point with EWG shares (i.e., for each $1 EWG declines in price, the put will increase $1 in price)
The expectation would be to hold this position until:
- Oct 11, when the unfavorable seasonal period ends
- Some arbitrary stop-loss level (ex., $24.50 a share for EWG) is hit
- A significant gain accrues in the options trade, at which point a trader (holding more than a 1-lot) might consider selling some portion of their position - or adjusting the position to improve the overall reward-to-risk profile
What the research tells us…
Historical results have been dreadful when EWG is below its 200-day EMA during the most seasonally unfavorable period of the year. That does not guarantee that that will be the case this time around. Given that reality and that selling short shares of EWG is not in most traders' playbooks, a simple low dollar-risk options trade might make sense for a trader willing to speculate that the German stock market may head lower in the months ahead.