Products
SentimenTrader Trading Tools
‍
Backtest Engine
My Trading Toolkit
Correlation Analysis
Seasonality
Indicators & Data API
‍
Proprietary Indicators & Charts
Market Data API
Strategies & Scanner
‍
50+ Trading Strategies
Smart Stock Scanner
Research Reports
‍
Research Solutions
Reports Library
Free Resources
Simple Backtest Calculator
Simple Seasonality Calculator
The Kelly Criterion Calculator
Sentiment Geo Map
Public Research Reports
Pricing
Company
About
In the News
Testimonials
Client Success Stories
Contact
Log inLoginSign up
< BACK TO ALL REPORTS

Every Time in 25 Years Cotton Did This, Prices Plunged

Jason Goepfert
2021-10-18
Optimism in the cotton market has exploded to one of the highest levels in history.

Although many people use cotton (primarily in the form of clothing), only a handful of people ever "trade" cotton.  Still, the topic of soaring commodity prices has become a thing in the past 12 months (to wit, lumber, crude oil, coffee, natural gas, lithium, uranium, corn, and soybeans, etc.). So, at the very least, more people are likely aware of soaring cotton prices than would have even noticed in the past.

And there are valuable trading lessons to be learned from this type of price activity, regardless of the market or stock actually doing the soaring.

In the cotton market, Jay noted that optimism toward the contract has soared along with prices. That's how sentiment works.

In the following test of Cotton Optix, Jay looked for those times when the 10-day moving average for Cotton Optimism Index crossed above 80, as it did last week. In a nutshell, we are looking for a sustained period of extreme optimism regarding cotton.  

Optimism on the cotton market is historic

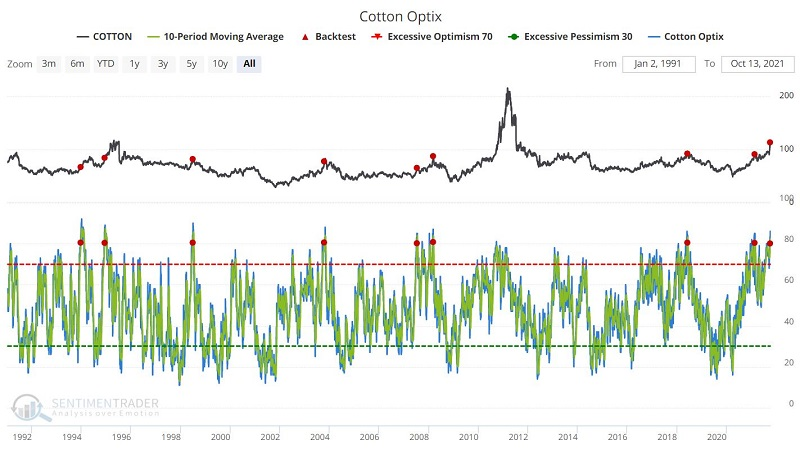
Results for cotton prices in the ensuing 12 months have been poor, averaging -25% according to our Backtest Engine.

It is OK to believe that cotton may weaken in the months ahead; it is NOT OK to blindly sell short cotton without implementing proper risk control.


What else we're looking at

  • Full returns in cotton after other periods of excessive optimism
  • What a reversal in the copper/gold ratio means for stocks

Stat box

As of last Tuesday, "smart money" commercial hedgers in major equity indexes like the S&P 500 held nearly $60 billion worth of contracts net short. That's among the largest short positions in history.

Etcetera

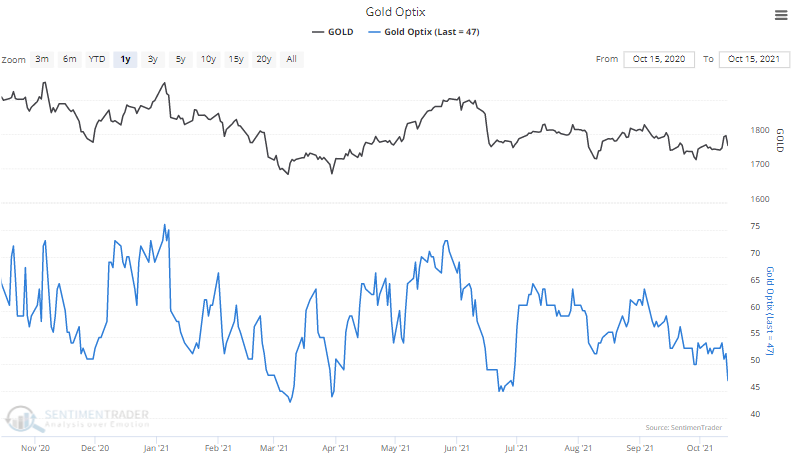
Not much luster. It's been hard to get investors excited about gold. Even when it rallies, optimism barely increases, and when gold drops, optimism craters. It's now close to the lowest levels of the past year.

Gold sentiment is dropping

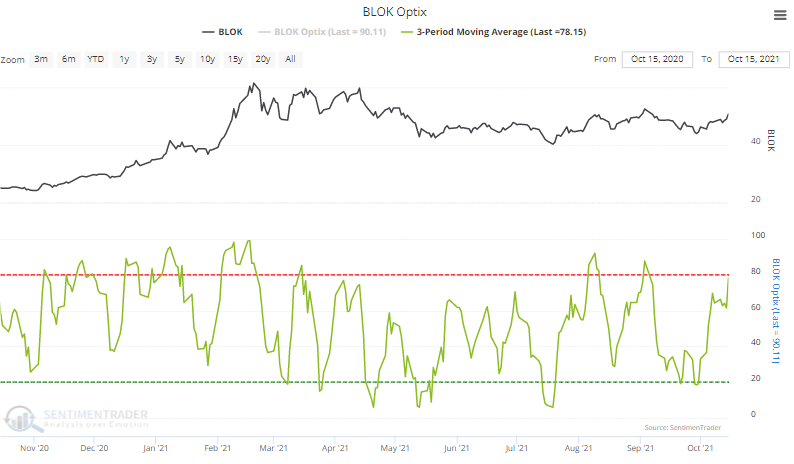
Chock BLOKed. Investors are chock full of optimism on blockchain stocks due in part to enthusiasm about looming ETF introductions. Over the past 3 days, the Optimism Index on BLOK is nearing 80% for only the 3rd time since April.

Sentiment on blockchain stocks is high

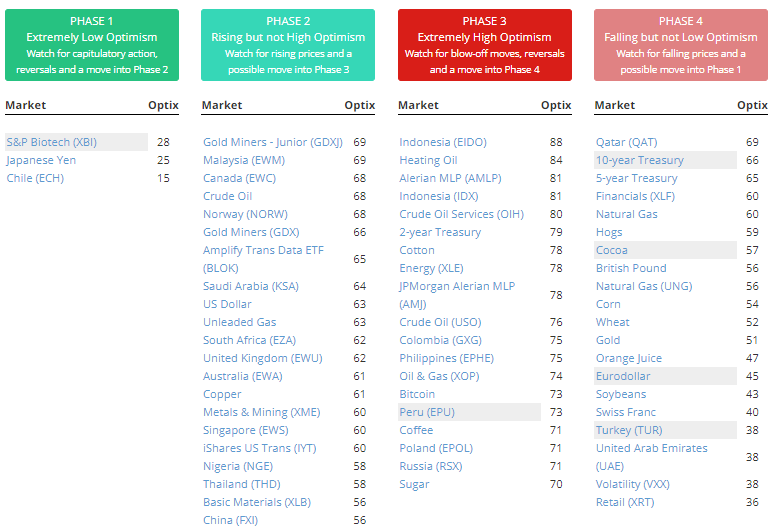
Phase transition. Early last week, there were more markets in Phase 1 (extreme pessimism) than Phase 3 (extreme optimism). Entering the new week, that has flipped.

Sentiment phase table shows optimism

PRODUCTS
SentimenTrader
Trading Tools
Indicators & Data API
‍
Strategies & Scanner
‍
Research Reports
FREE
RESOUrCES
Simple Backtest
Calculator
Simple Seasonality
Calculator
The Kelly Criterion
Calculator
Sentiment Geo Map
‍
Public Research Reports
‍
Pricing
Bundle pricing
‍
Announcements
‍
FAQ
COMPANY
‍
About
‍
In the News
‍
Testimonials
‍
Client Success Stories
CONTACT
‍
General Inquiries
‍
Media Inquiries
‍
Financial Professionals Inquiries
‍
© 2025 Sundial Capital Research Inc. All rights reserved.
Setsail Marketing
TermsPrivacyAffiliate Program
Risk Disclosure: Futures and forex trading contains substantial risk and is not for every investor. An investor could potentially lose all or more than the initial investment. Risk capital is money that can be lost without jeopardizing ones’ financial security or life style. Only risk capital should be used for trading and only those with sufficient risk capital should consider trading. Past performance is not necessarily indicative of future results.

Hypothetical Performance Disclosure: Hypothetical performance results have many inherent limitations, some of which are described below. No representation is being made that any account will or is likely to achieve profits or losses similar to those shown; in fact, there are frequently sharp differences between hypothetical performance results and the actual results subsequently achieved by any particular trading program. One of the limitations of hypothetical performance results is that they are generally prepared with the benefit of hindsight. In addition, hypothetical trading does not involve financial risk, and no hypothetical trading record can completely account for the impact of financial risk of actual trading. for example, the ability to withstand losses or to adhere to a particular trading program in spite of trading losses are material points which can also adversely affect actual trading results. There are numerous other factors related to the markets in general or to the implementation of any specific trading program which cannot be fully accounted for in the preparation of hypothetical performance results and all which can adversely affect trading results.

Testimonial Disclosure: Testimonials appearing on this website may not be representative of other clients or customers and is not a guarantee of future performance or success.