
Every Basic Material stock is in a uptrend

Key points
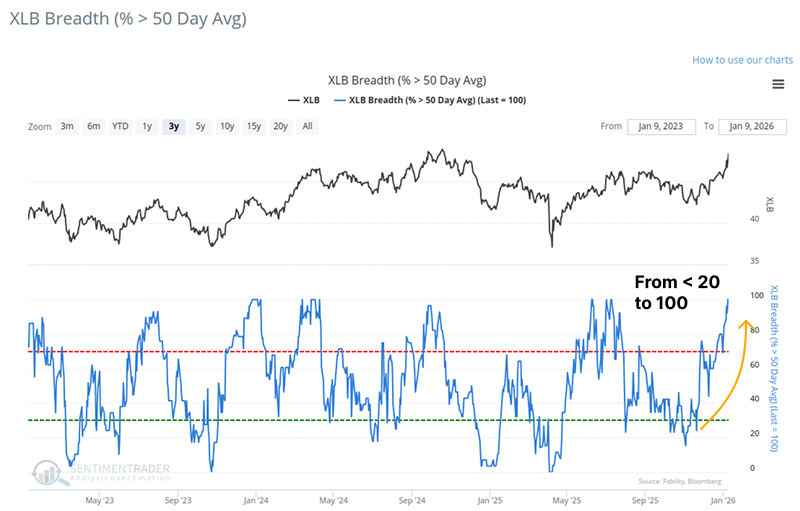
- The Basic Materials sector (XLB): 100% of its component stocks are trading above their 50-day moving averages.
- Historically, when participation surges from low levels to 100% within three months, the sector has typically delivered positive returns.
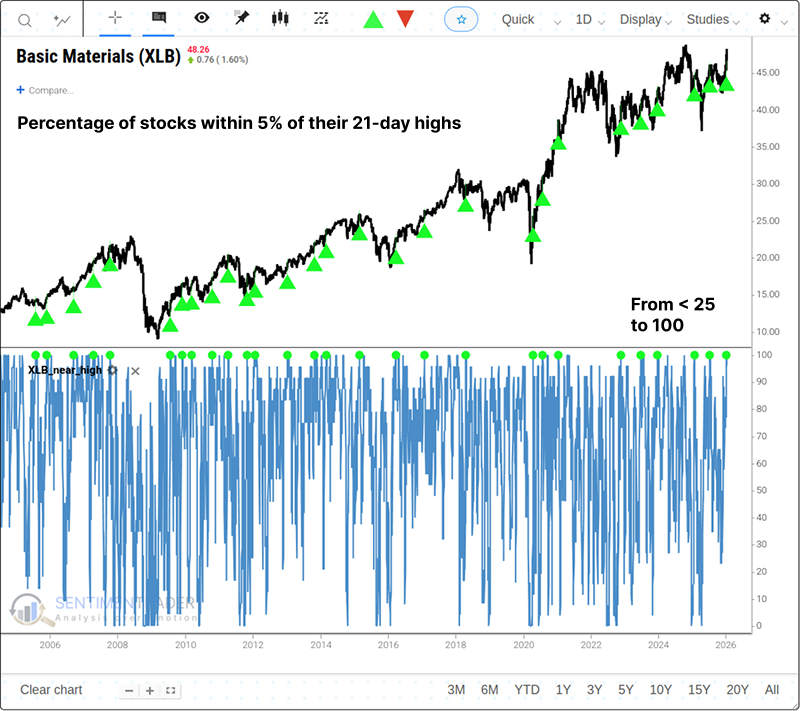
- A similar surge in stocks trading near their 21-day highs further confirms the strength of this thrust.
No Materials stocks are in downtrends
As noted in last week's report, we assess XLB's medium-term market breadth by looking at the proportion of XLB stocks with prices above their 50-day moving average. Its latest reading has now reached 100%. Among all the sectors and indices we track, no other group has a higher percentage of components in a medium-term uptrend than the Basic Materials sector.
It would be impossible for more of these stocks to be trading above their 50-day moving averages because every one of them is. It's a dramatic turnaround from two months ago when most of the stocks was below its 50-day average.
Over the past 25 years, there have been very few instances where the sector experienced such a dramatic reversal of fortunes within just three months.
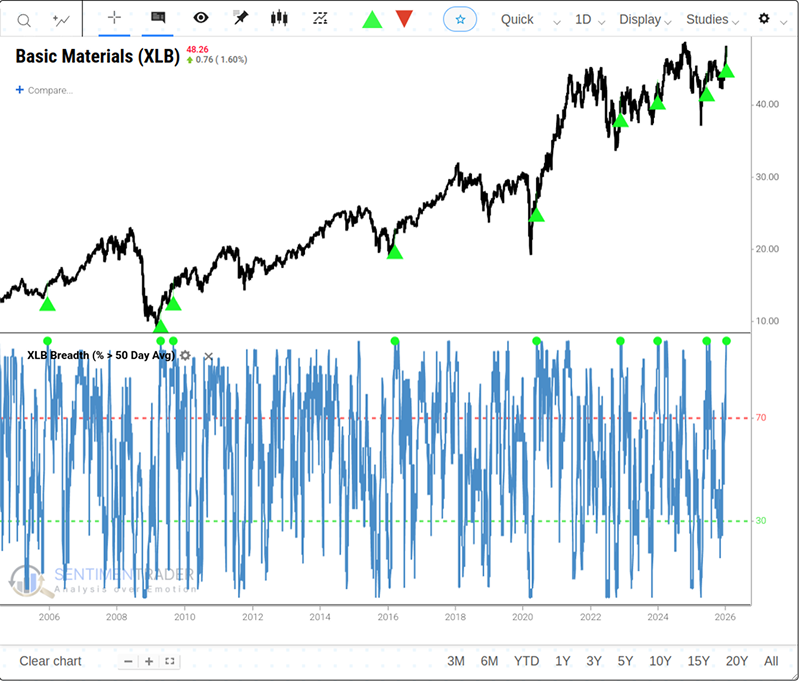
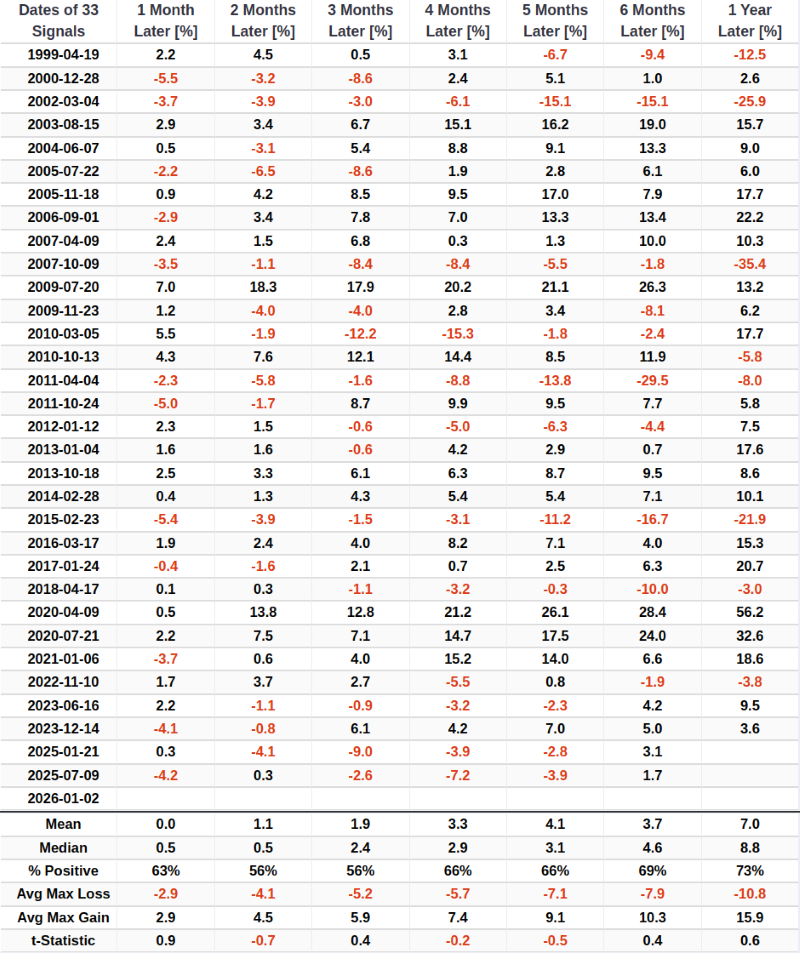
The table below lists every instance since 2000 where the percentage of stocks above their average surged from 20% or less to 100% within a three-month window. As we can see, almost all of these signals showed positive returns over the three-month timeframe.
Of course, this is not without risk. The average drawdown over the next three months is nearly 4%, which is relatively significant, especially considering that the average maximum gain is only about twice the drawdown. We generally prefer a reward-to-risk ratio of 3:1 to ensure a robust investment setup.
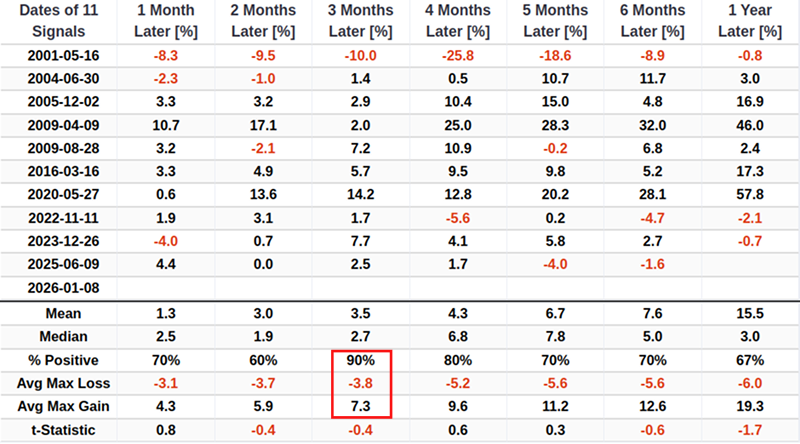
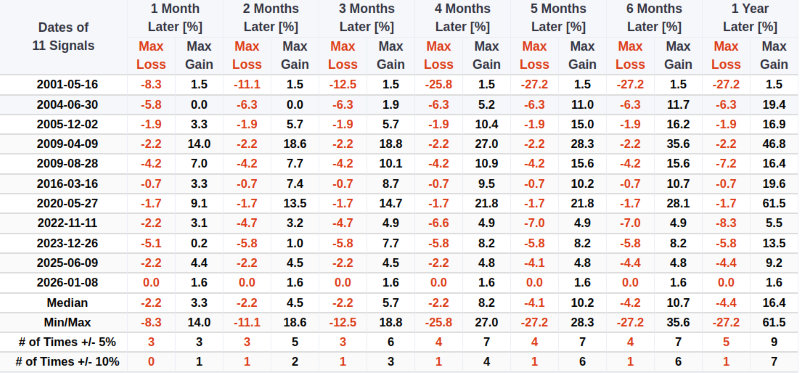
It is also worth noting that we can see a drawdown of 12.5% occurred at the three-month mark in one instance.
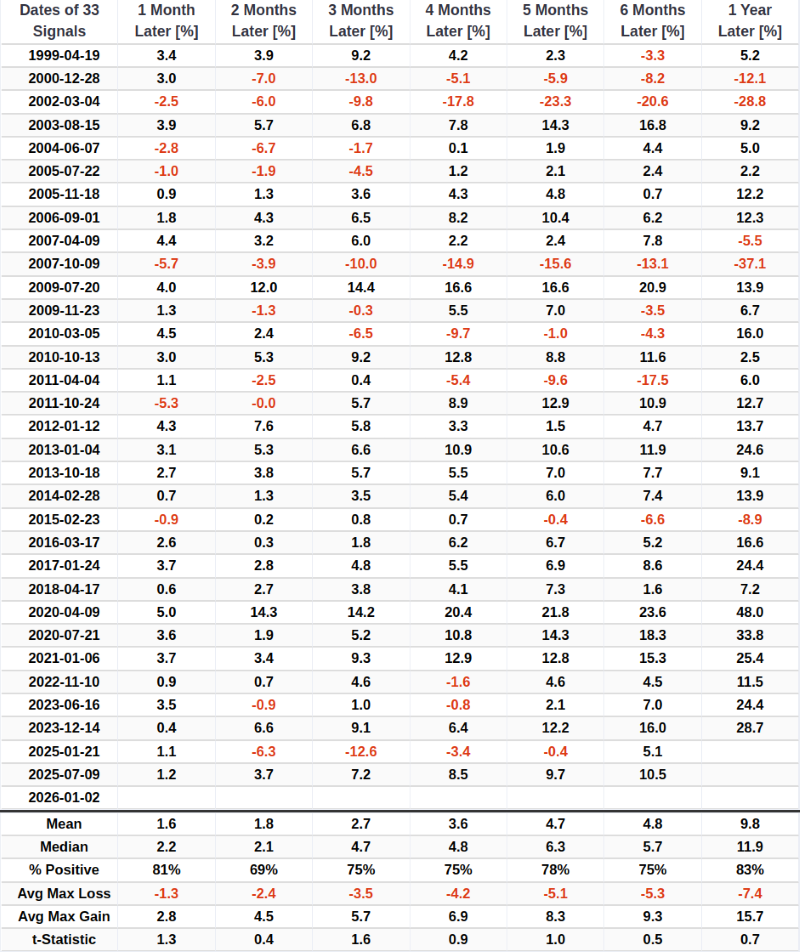
The potential rally in these material stocks could spill over to the broader market. The S&P 500 Index has achieved decent win rates and returns across various timeframes following each signal.
No Materials stocks are outside 5% of their 21-day highs
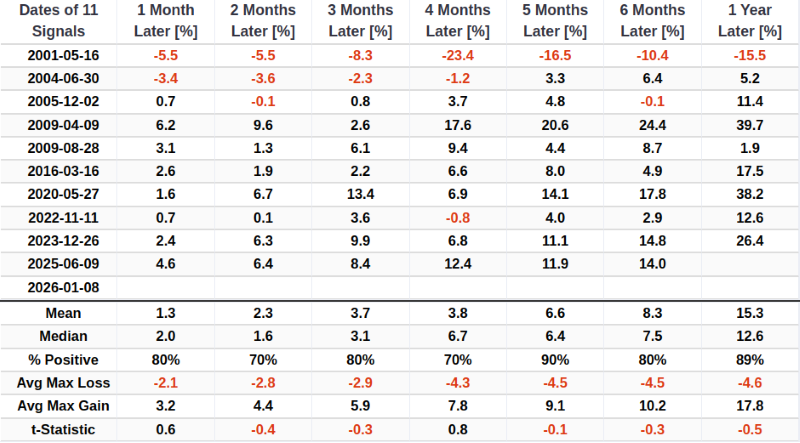
A trend-following indicator measuring the number of S&P 500 Materials sector stocks trading within 5% of their 21-day highs has recently hit a reading of 100%. It rose from less than 25% in November of last year to 100%, triggering our reversal signal model. This signal identifies instances where the percentage of stocks within 5% of their 21-day highs surges from under 25% to 100%, with the latest signal occurring on January 2nd.
The win rates for the Materials sector following this signal have increased over time, though not dramatically.
After the proportion of S&P 500 Materials stocks within 5% of their 21-day highs surged from less than 25% to 100%, the S&P 500 Index achieved decent win rates and returns across all timeframes, particularly over the one-year period.
An opportunity may finally be forming in materials
"Is this the time to buy?" That is a more difficult question to answer.
To get a more comprehensive view of the long-term trend, the chart below displays the performance of the iShares U.S. Basic Materials ETF (ticker: XLB) relative to the S&P 500 (ticker: SPY). As you can see at the bottom of the chart, while XLB's performance relative to SPY has rebounded, it remains at a relatively low level.
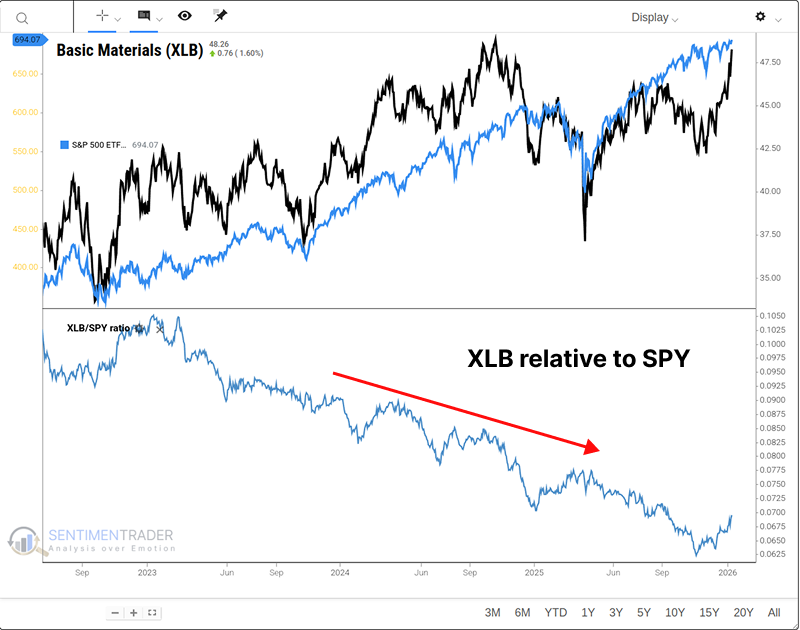
Buying when relative prices are low offers the greatest profit opportunity if a strong rally follows. On the other hand, this approach can also end up being like "trying to catch a falling safe."
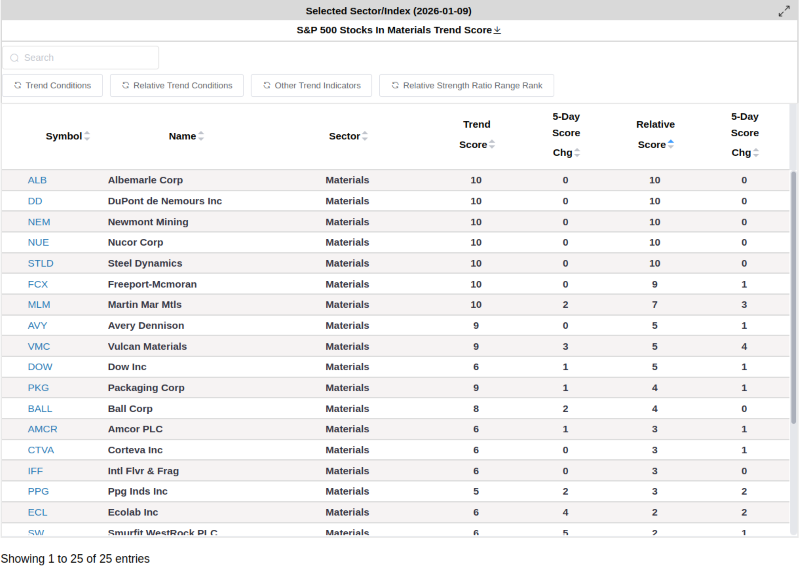
Objectively, chasing a rally carries risks. Nevertheless, the indicators detailed above suggest that investors should at least pay attention to the Materials sector and look for buying opportunities. The table below lists relatively strong stocks within the Materials sector. For example, gold producer Newmont Corporation (NEM) and pure-play copper miner Freeport-McMoRan (FCX) have both recorded high Trend and Relative Trend Scores.
What the research tells us...
The Basic Materials sector has undergone a massive internal improvement, shifting from broadly weak to universally strong in just a few months. With 100% of components now above their 50-day average and trading near yearly highs, the sector is demonstrating powerful momentum that historically bodes well for future returns. While relative performance against the S&P 500 is still trying to find a bottom, the sheer magnitude of this breadth thrust suggests that a durable low may be in place. Investors should monitor key names like Newmont and Freeport-McMoRan for potential entry points as the sector attempts to sustain this breakout.
It is still important to note that past performance does not predict future trends. Investors should conduct further analysis by considering macroeconomic supply and demand factors alongside market volatility.