
European stocks surge into overbought territory

Key points
- European indices, specifically the UK's FTSE 100 and France's CAC 40, have surged to record highs on the back of positive domestic data and easing geopolitical trade fears.
- Breadth indicators for the FTSE 100, including the percentage of stocks above their 10-day, 50-day, and 200-day moving averages, have expanded into overbought territory, historically signaling further medium-to-long-term gains.
- The CAC 40 is mirroring this strength, with its breadth metrics also hitting overbought levels, producing positive historical win rates.
- The Relative Strength Index (RSI) for the CAC 40 has crossed above 72. Contrary to traditional "overbought equals sell" logic, this strong momentum has typically been a bullish continuation signal.
A breakout in European equities
European stocks traded higher on Friday, bolstering investor confidence as both the London FTSE 100 and Paris CAC 40 indices hit record highs. The London market finished strongly, lifted by a dual tailwind of positive UK economic data and the U.S. Supreme Court's ruling striking down Trump's global tariff plan. The FTSE 100 ultimately closed up 59.85 points, or 0.6%, at 10,686.9.
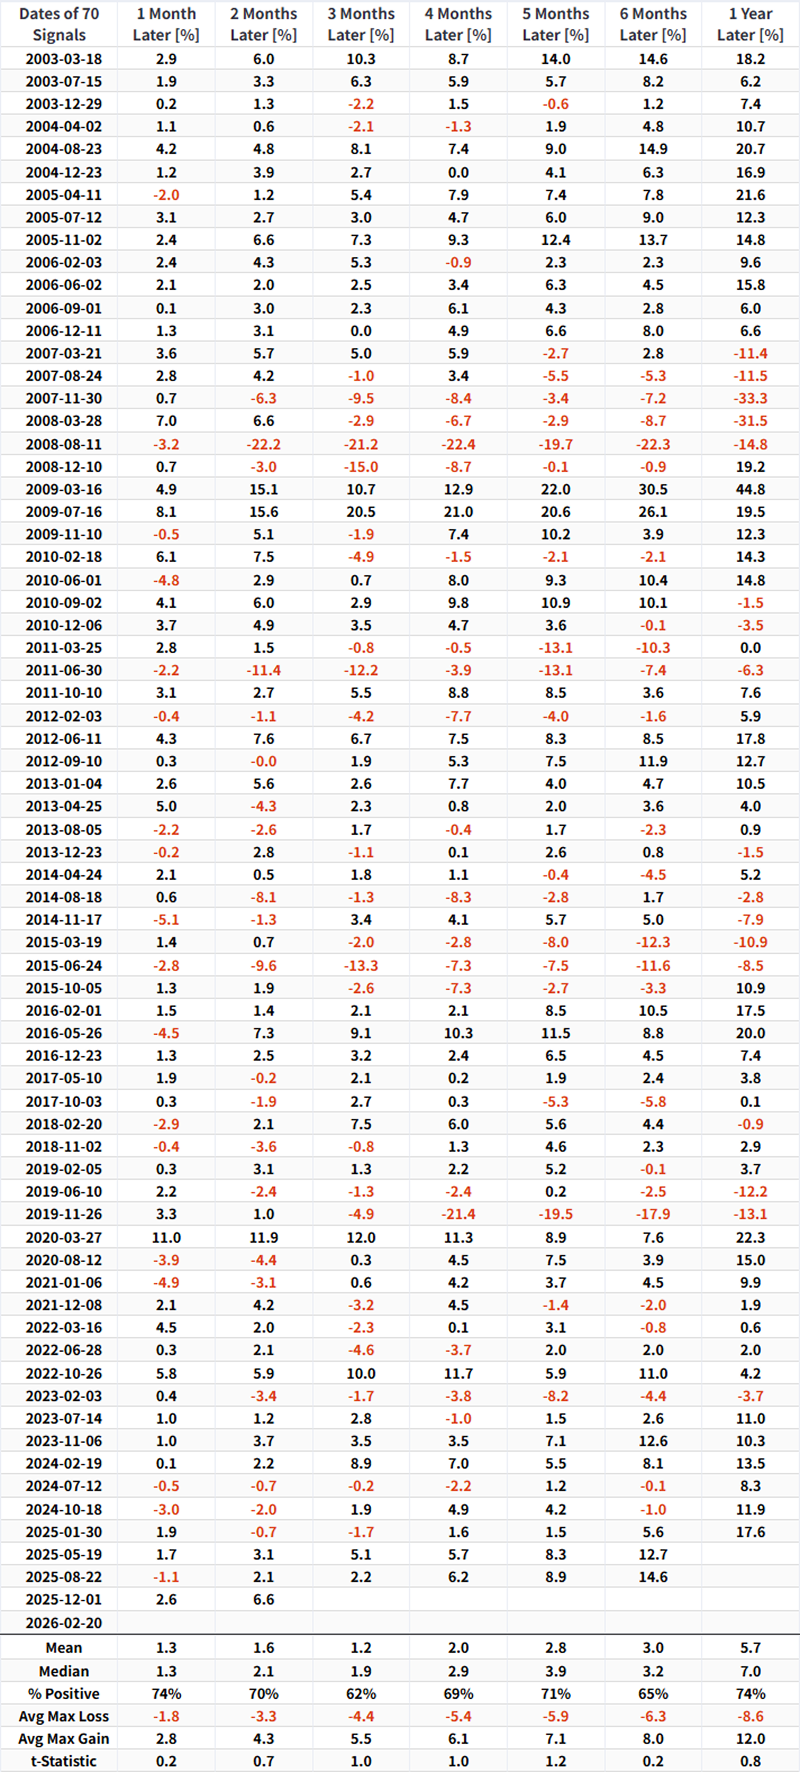
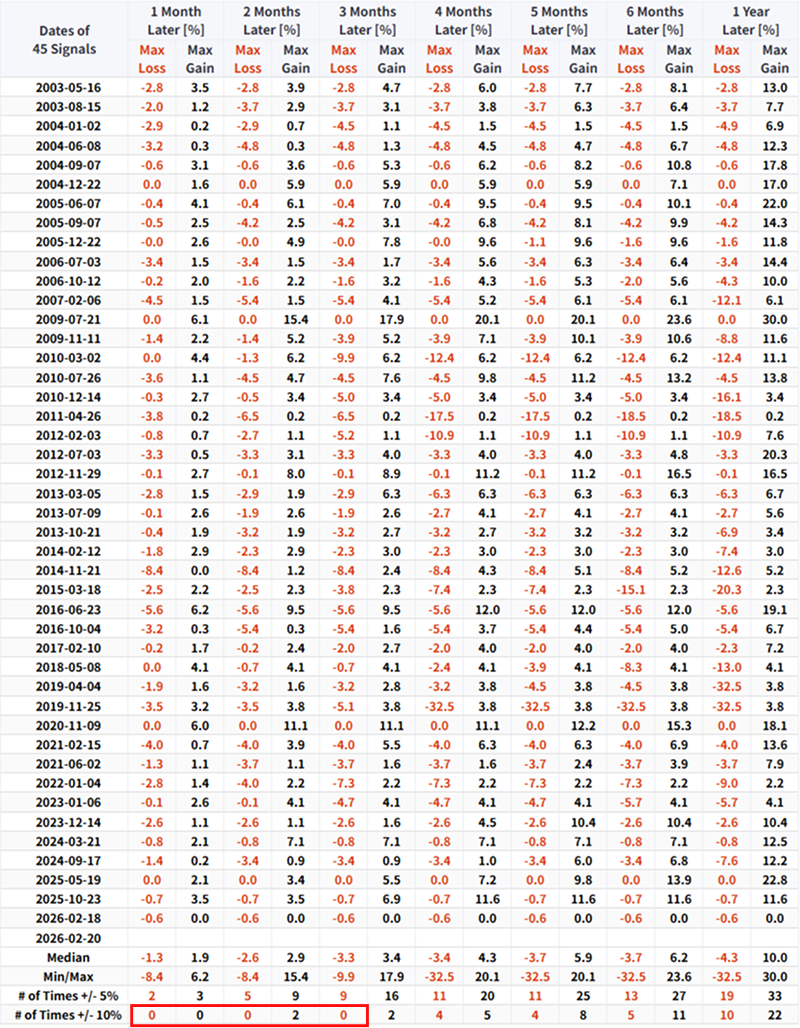
As the broader market moved higher, the market breadth indicator (FTSE Breadth % > 10 Day Avg) climbed sharply to 81, dragging its three-day moving average up to 77. The chart below displays the dates and subsequent performance when this 3-day moving average crosses above 77.
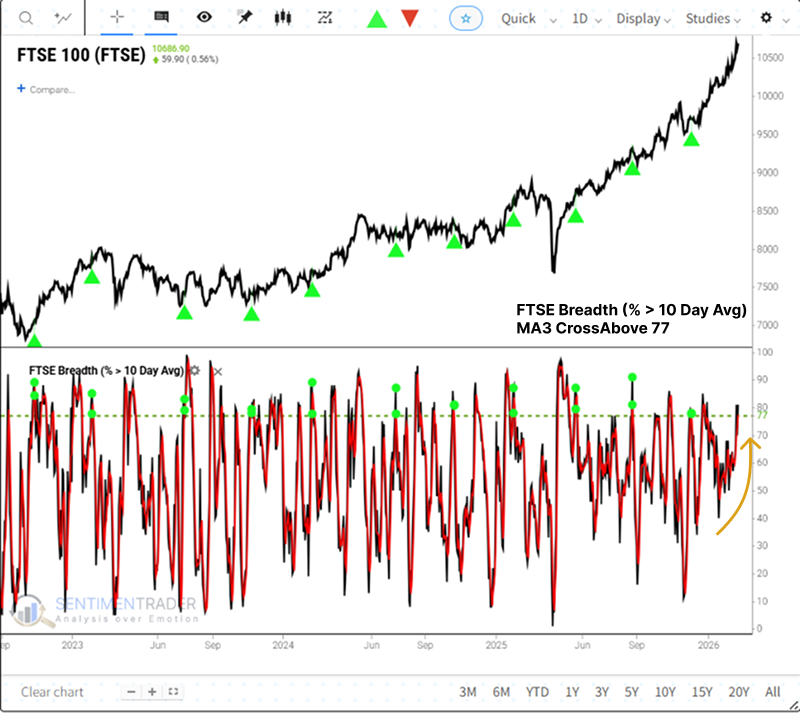
As the table shows, the FTSE 100 typically enjoys positive returns following this signal.
As the FTSE continues to trend higher, market breadth has expanded significantly across multiple timeframes. The percentage of component stocks trading above both their 50-day and 200-day moving averages has climbed, pushing firmly into overbought territory.
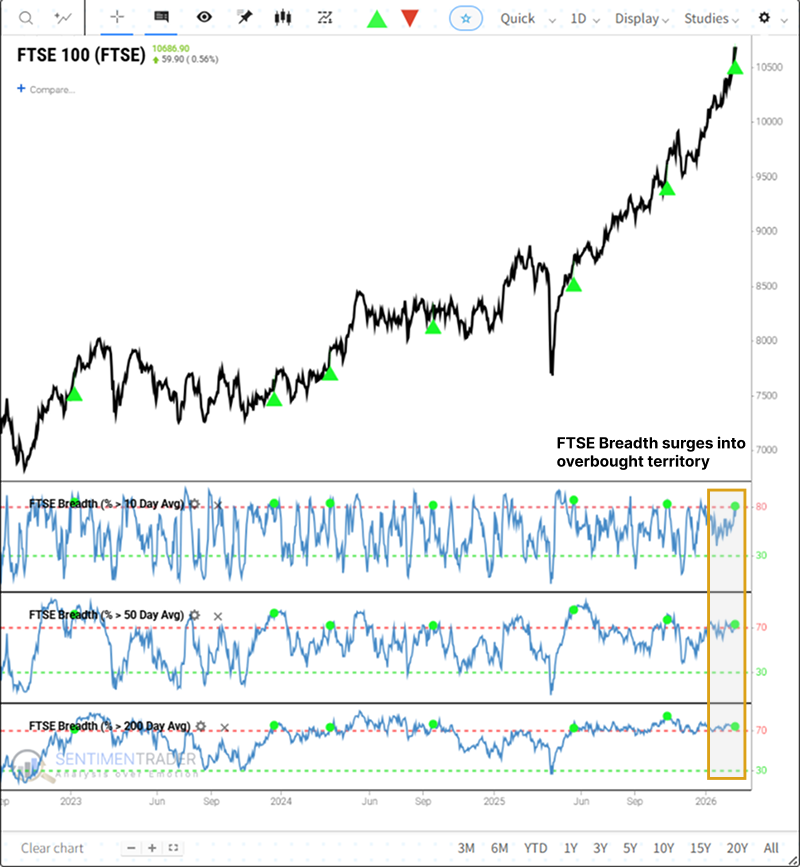
Historically, whenever this specific signal occurs, the FTSE's rally tends to persist. This phenomenon typically heralds a medium-to-long-term advance, or at least it almost always has.
Notably, following this signal, there has never been a maximum drawdown exceeding 10% within the subsequent three-month period.
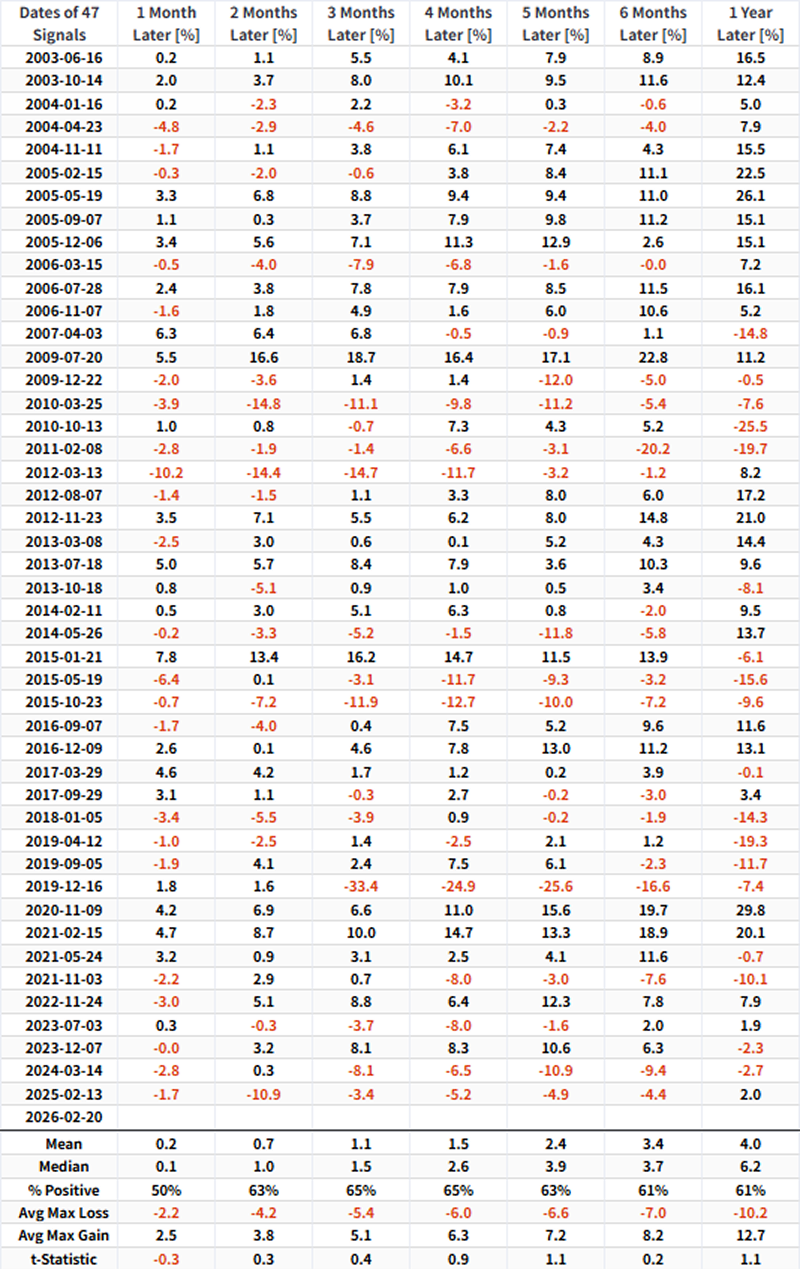
How about the CAC 40?
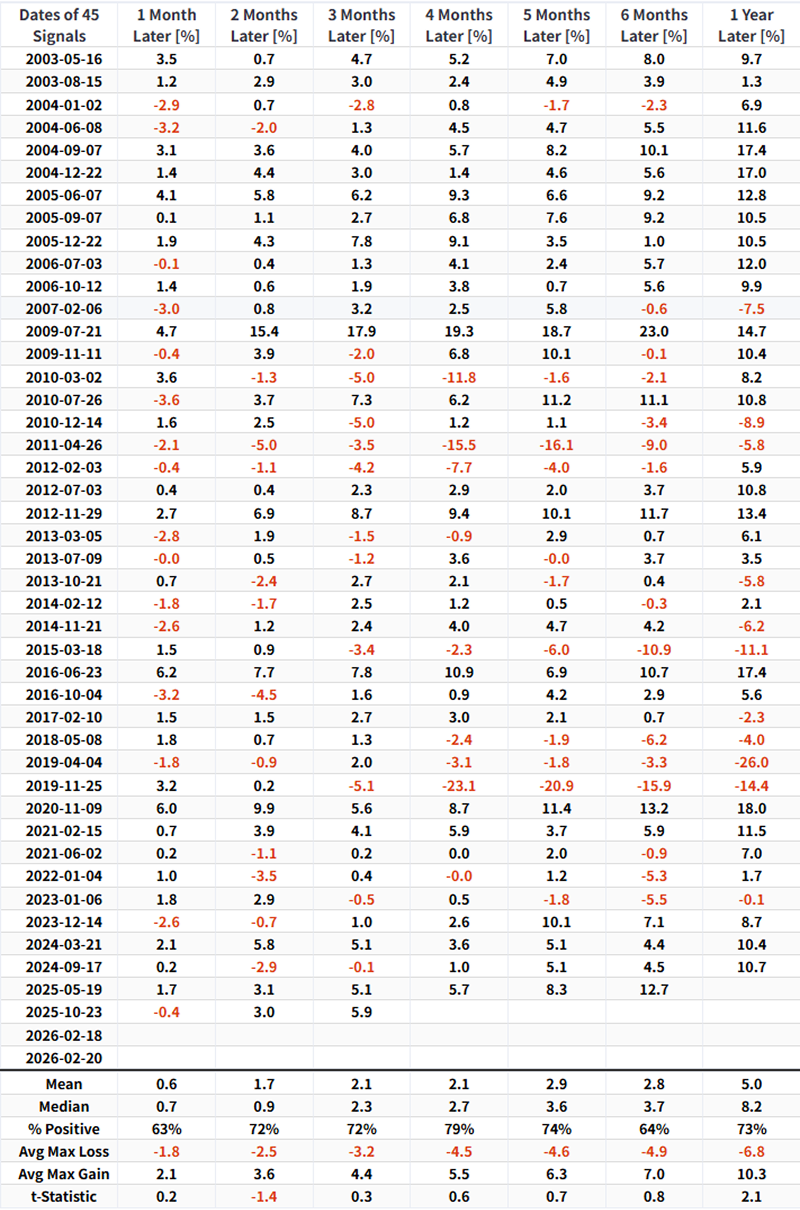
Meanwhile, the Paris CAC 40 Index closed up 1.4%, driving its own breadth indicators into overbought territory as well.
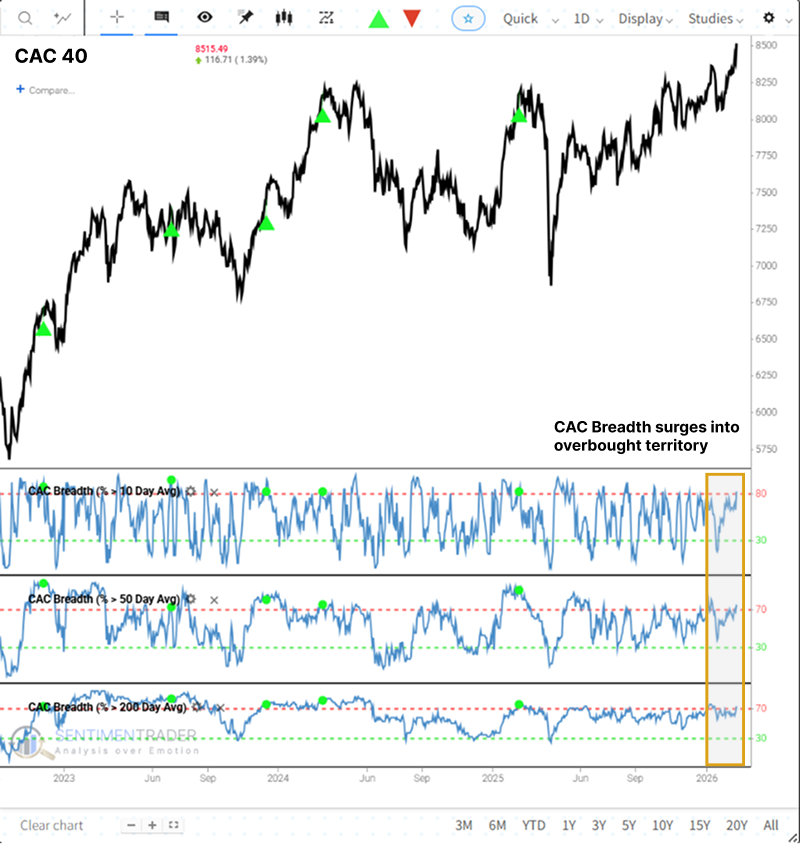
Similar signals have also yielded positive returns for the French benchmark. After its breadth indicators step into overbought zones, the CAC 40 has maintained positive win rates over the medium and long term.
Momentum in CAC 40 lifts the Relative Strength Index into overbought territory
Developed by J. Welles Wilder Jr., the Relative Strength Index (RSI) is a popular technical analysis indicator used to measure market momentum. According to classic interpretations, an RSI reading of 70 or higher indicates an overbought condition, while a reading below 30 suggests oversold conditions.
Conventional wisdom dictates that it is prudent to buy oversold stocks or assets and sell overbought ones.
However, in our view, an "overbought" RSI is often a favorable setup, as it signifies strong upward market momentum. Conversely, an "oversold" reading is unfavorable because it points to deteriorating momentum.

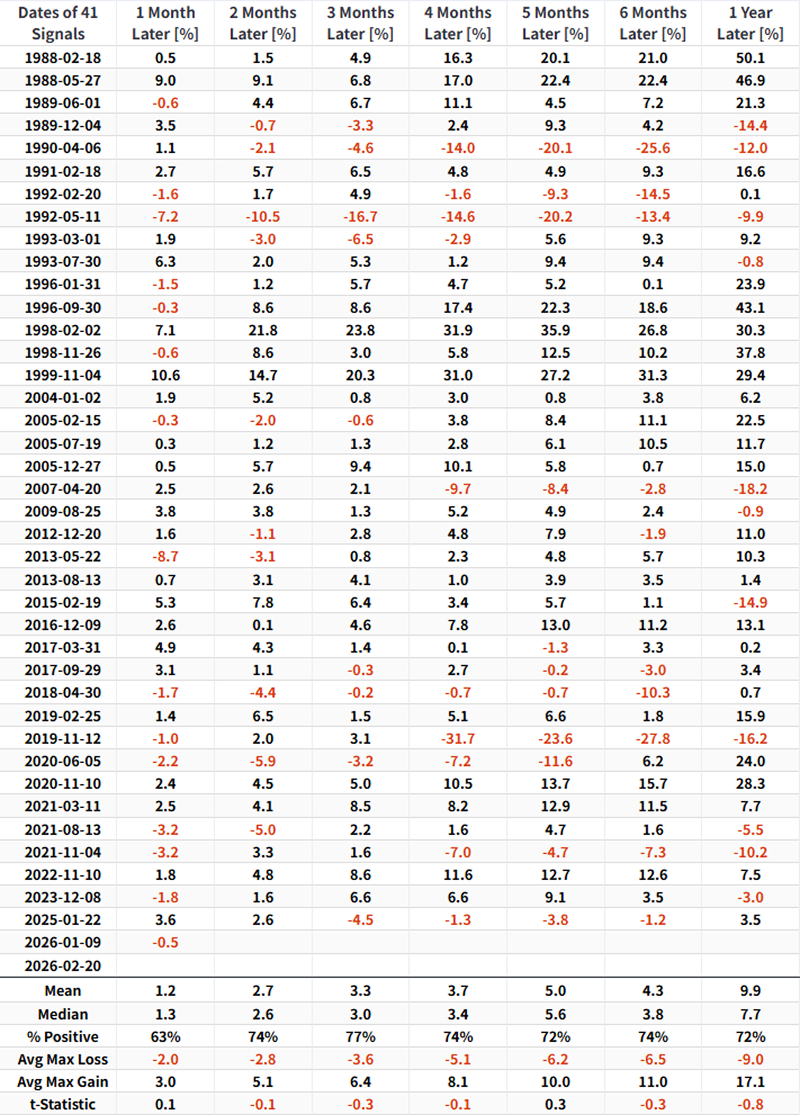
The CAC 40 RSI has broken above 72. A Relative Strength Index (RSI) reading above 72 is considered a strong signal of a bull market rather than a bear market. Strong positive momentum like this often leads to further upside across all timeframes.
What the research tells us...
European equity markets are displaying characteristics of a powerful breakout, driven by easing trade tensions and solid economic data. Both the FTSE 100 and CAC 40 have reached record highs accompanied by surging market breadth. While traditional technical analysis might view indicators like extreme breadth or an RSI above 70 as cautionary "overbought" signals, our historical backtests suggest the opposite in this context. Such extreme, synchronized momentum acts as a bullish "thrust" rather than an exhaustion point, historically paving the way for continued medium-to-long-term gains with surprisingly limited drawdown risk.