
Euphoric Sentiment and Concentrated Market Structure

Key Points
- Not all indicators work as standalone trading systems; most are better used as "weight of evidence" to support bullish or bearish views.
- NAAIM Exposure Index > 100;
- RSP/SPY Ratio hits a one-year low;
Most Indicators Are a "Brick in the Wall," Not a Panacea
Traders often mistakenly assume that signals from each indicator are "actionable orders"-i.e., buy or sell signals. In reality, signals from most indicators are usually best used as evidence to support a bullish or bearish perspective.
Over the past few days, we've seen two key indicators that together shed light on the current stock market's "bullish but fragile" outlook. We'll analyze these two signals one by one.
When NAAIM Members Turn Extremely Bullish
NAAIM stands for the National Association of Active Investment Managers. It is a group of professional ("smart money") investors. Every week, the association asks its members to provide a number representing their overall stock exposure, ranging from "200% leveraged short" to "200% leveraged long."
Investment surveys typically act as contrarian indicators, as retail investors tend to grow more optimistic (greedy) when the market rises and more pessimistic (fearful) when it falls.
However, the NAAIM Exposure Index usually runs counter to this trend. While professionals can also be greedy, historical data from the index shows they seem more adept at following trends.
First, let's look at the NAAIM Exposure Index surpassing 100% on October 29, 2025. This is a bullish stance, meaning professional managers are, on average, holding leveraged long positions.
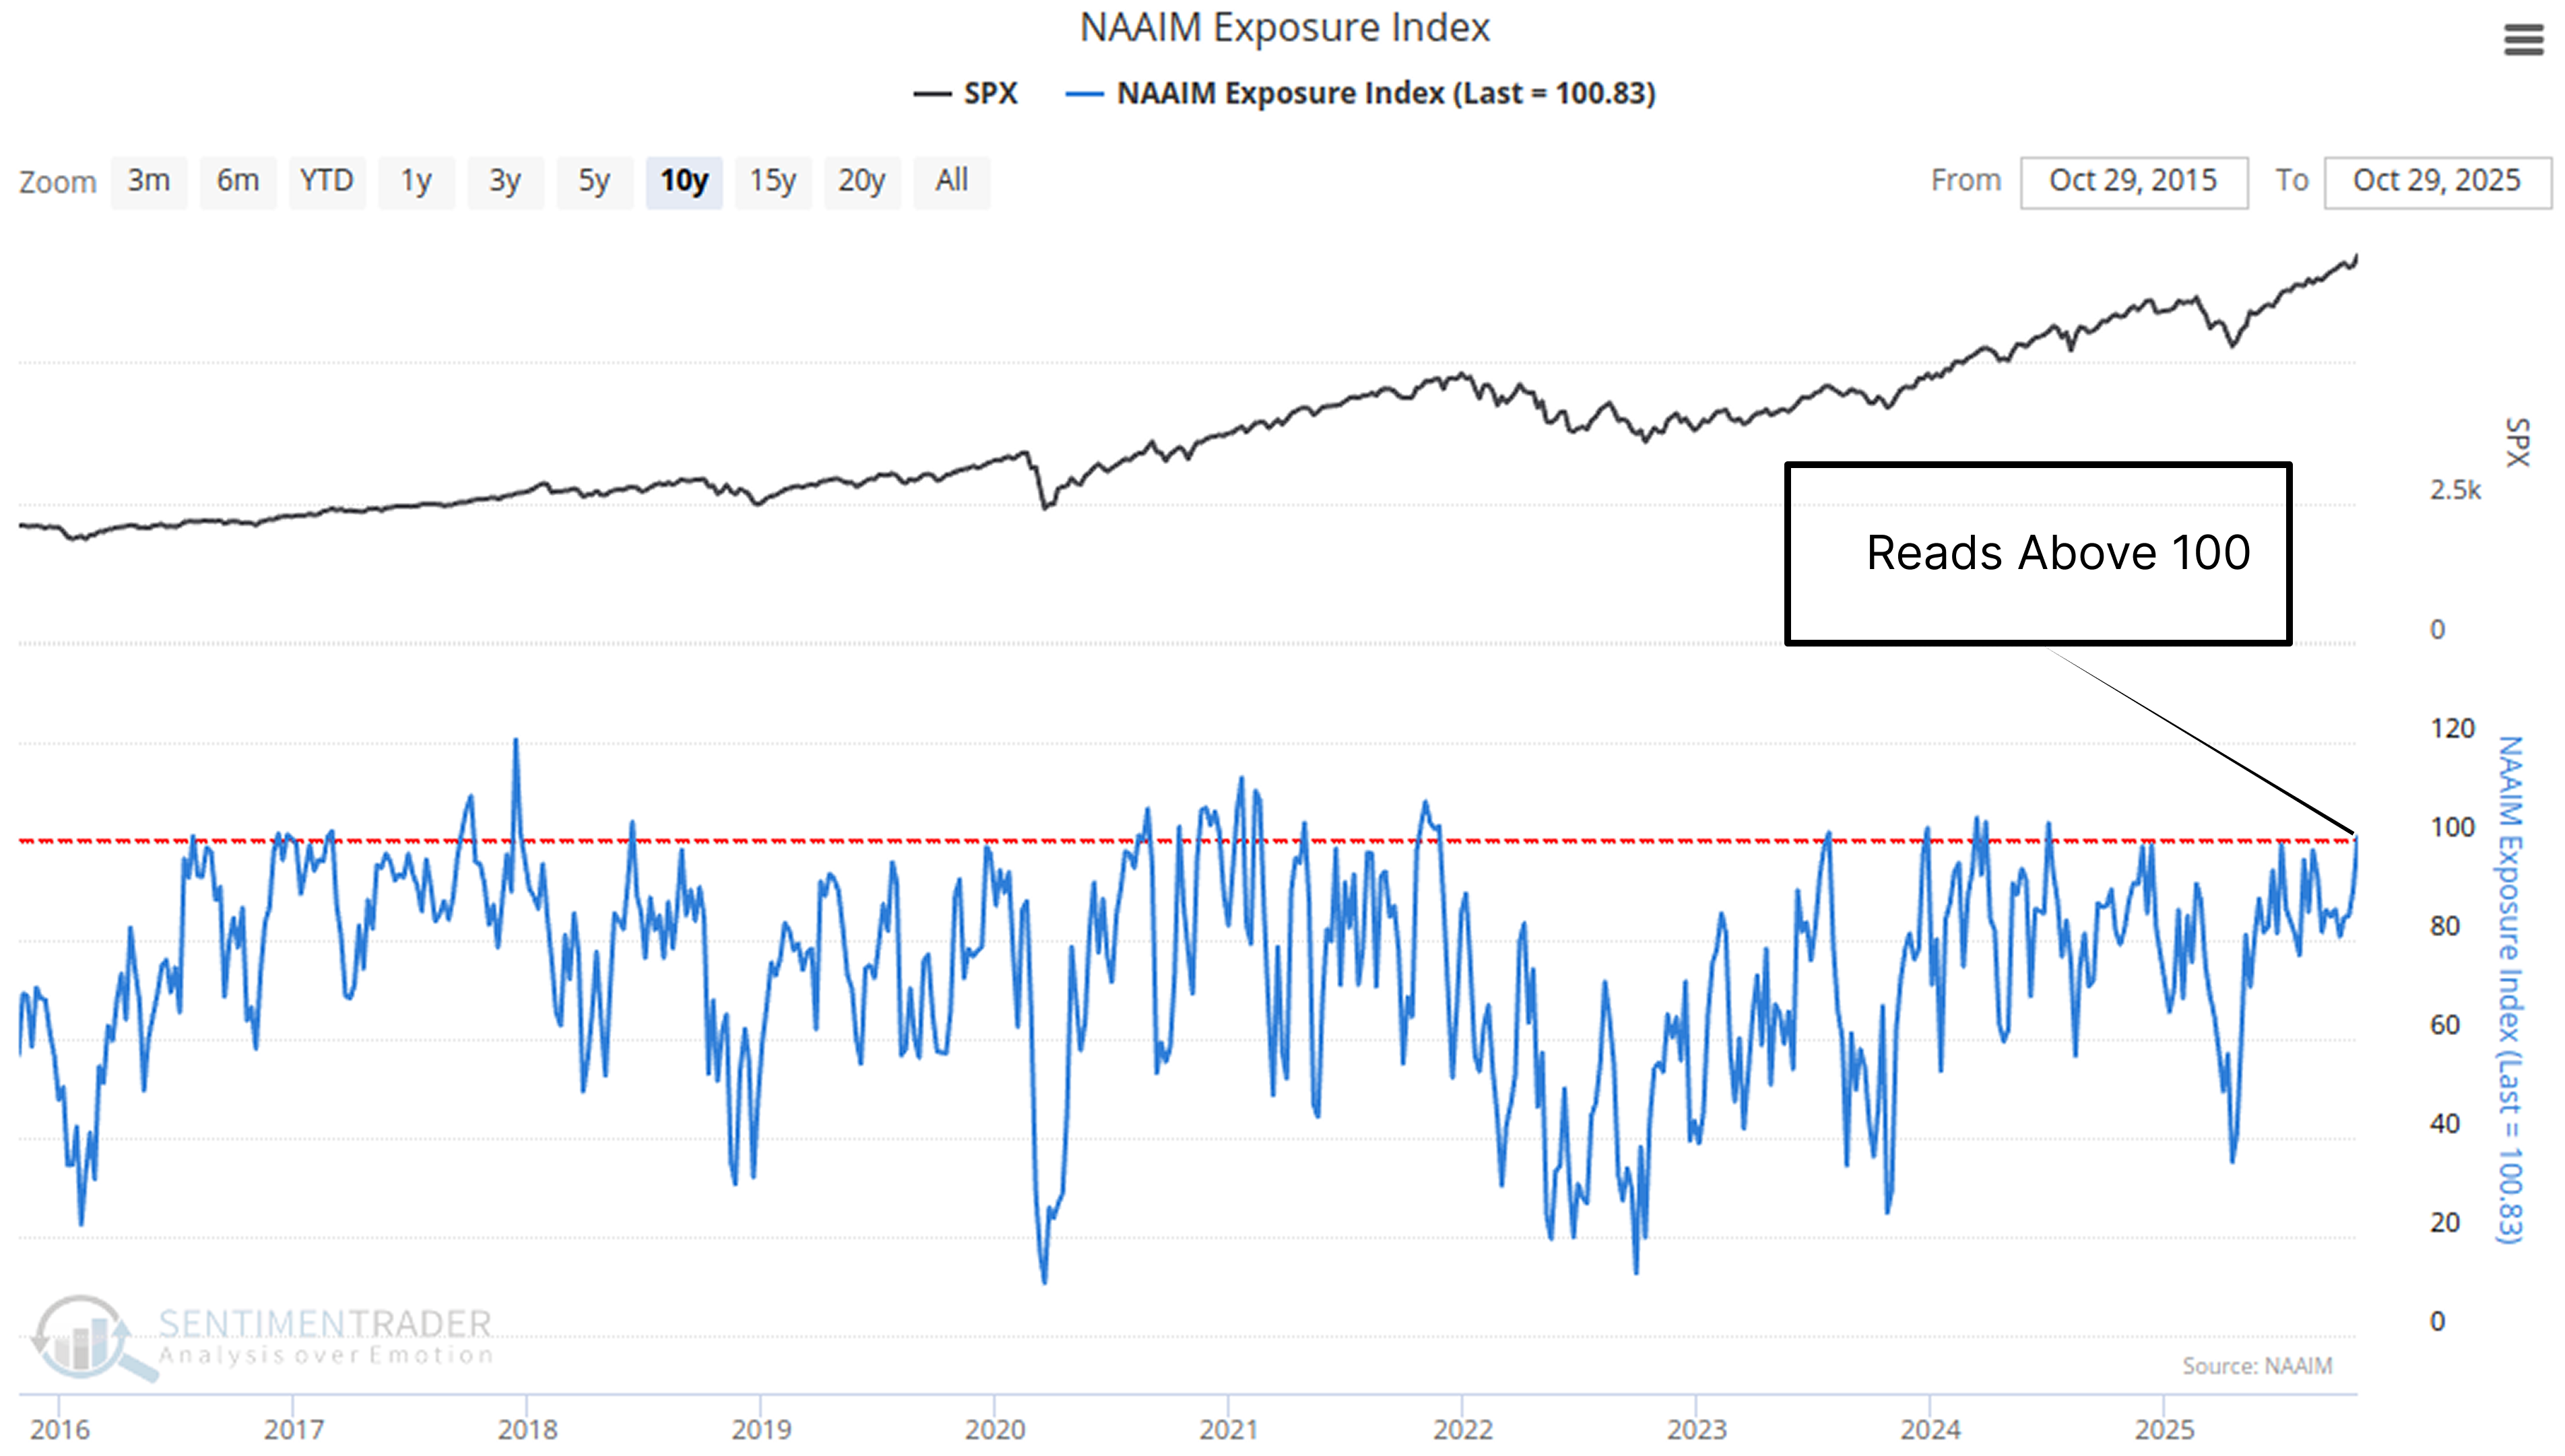
If the index were a contrarian indicator, we would expect the market to perform poorly on average after such extreme bullishness. However, historical data tends to show the opposite. The table below illustrates the future performance of the S&P 500 when the exposure index in the NAAIM survey exceeds 100%.Related Backtest Click Here.
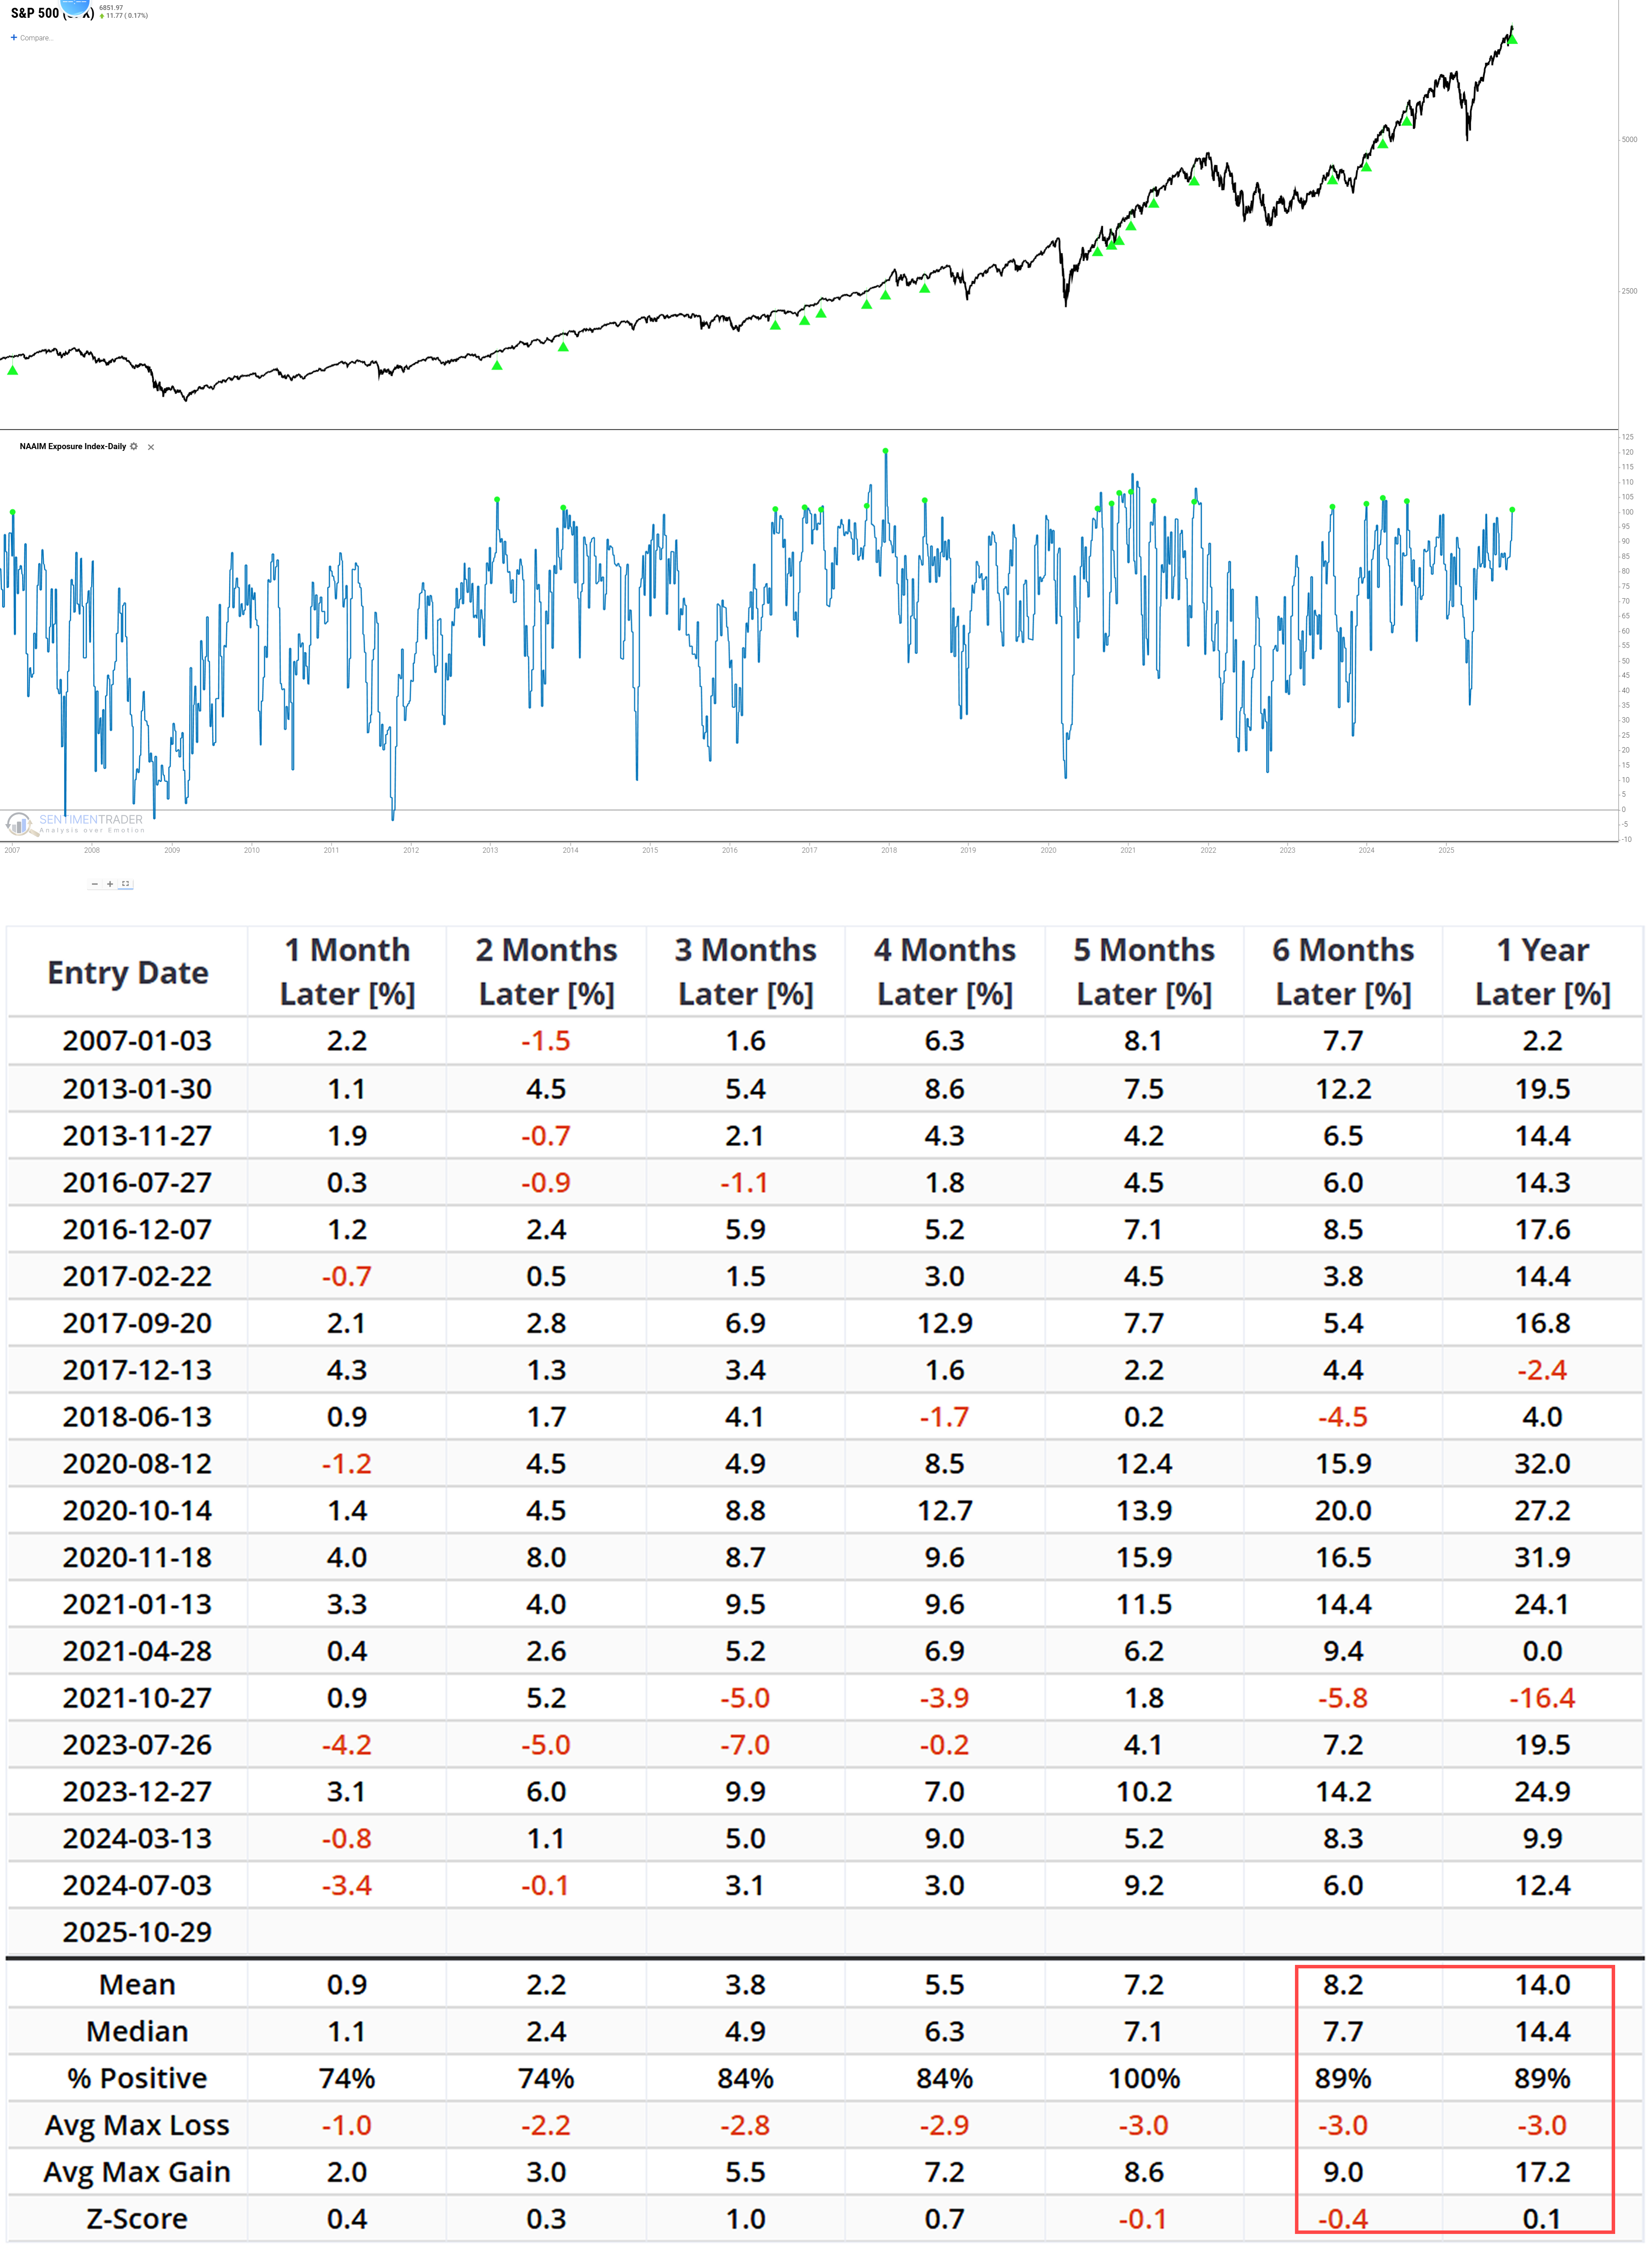
Note that for the 6-month and 1-year timeframes, the historical win rates (% Positive) are as high as 89%, with median returns of +7.7% and +14.4%, respectively. This indicates that extreme optimism among professionals is usually a "momentum-following" signal. However, we must remain cautious: this signal also appeared at several key market tops (e.g., late 2017, late 2021), followed by severe market corrections. History does not repeat itself exactly.
When Market Structure Becomes Extremely Concentrated
The first signal relates to "sentiment," while the second focuses on "structure."
We use the RSP/SPY Ratio to measure market breadth. SPY is a market-cap weighted index (dominated by a few "generals"), while RSP is an equal-weighted index (representing all "soldiers"). This ratio hit a one-year low on October 27, 2025.
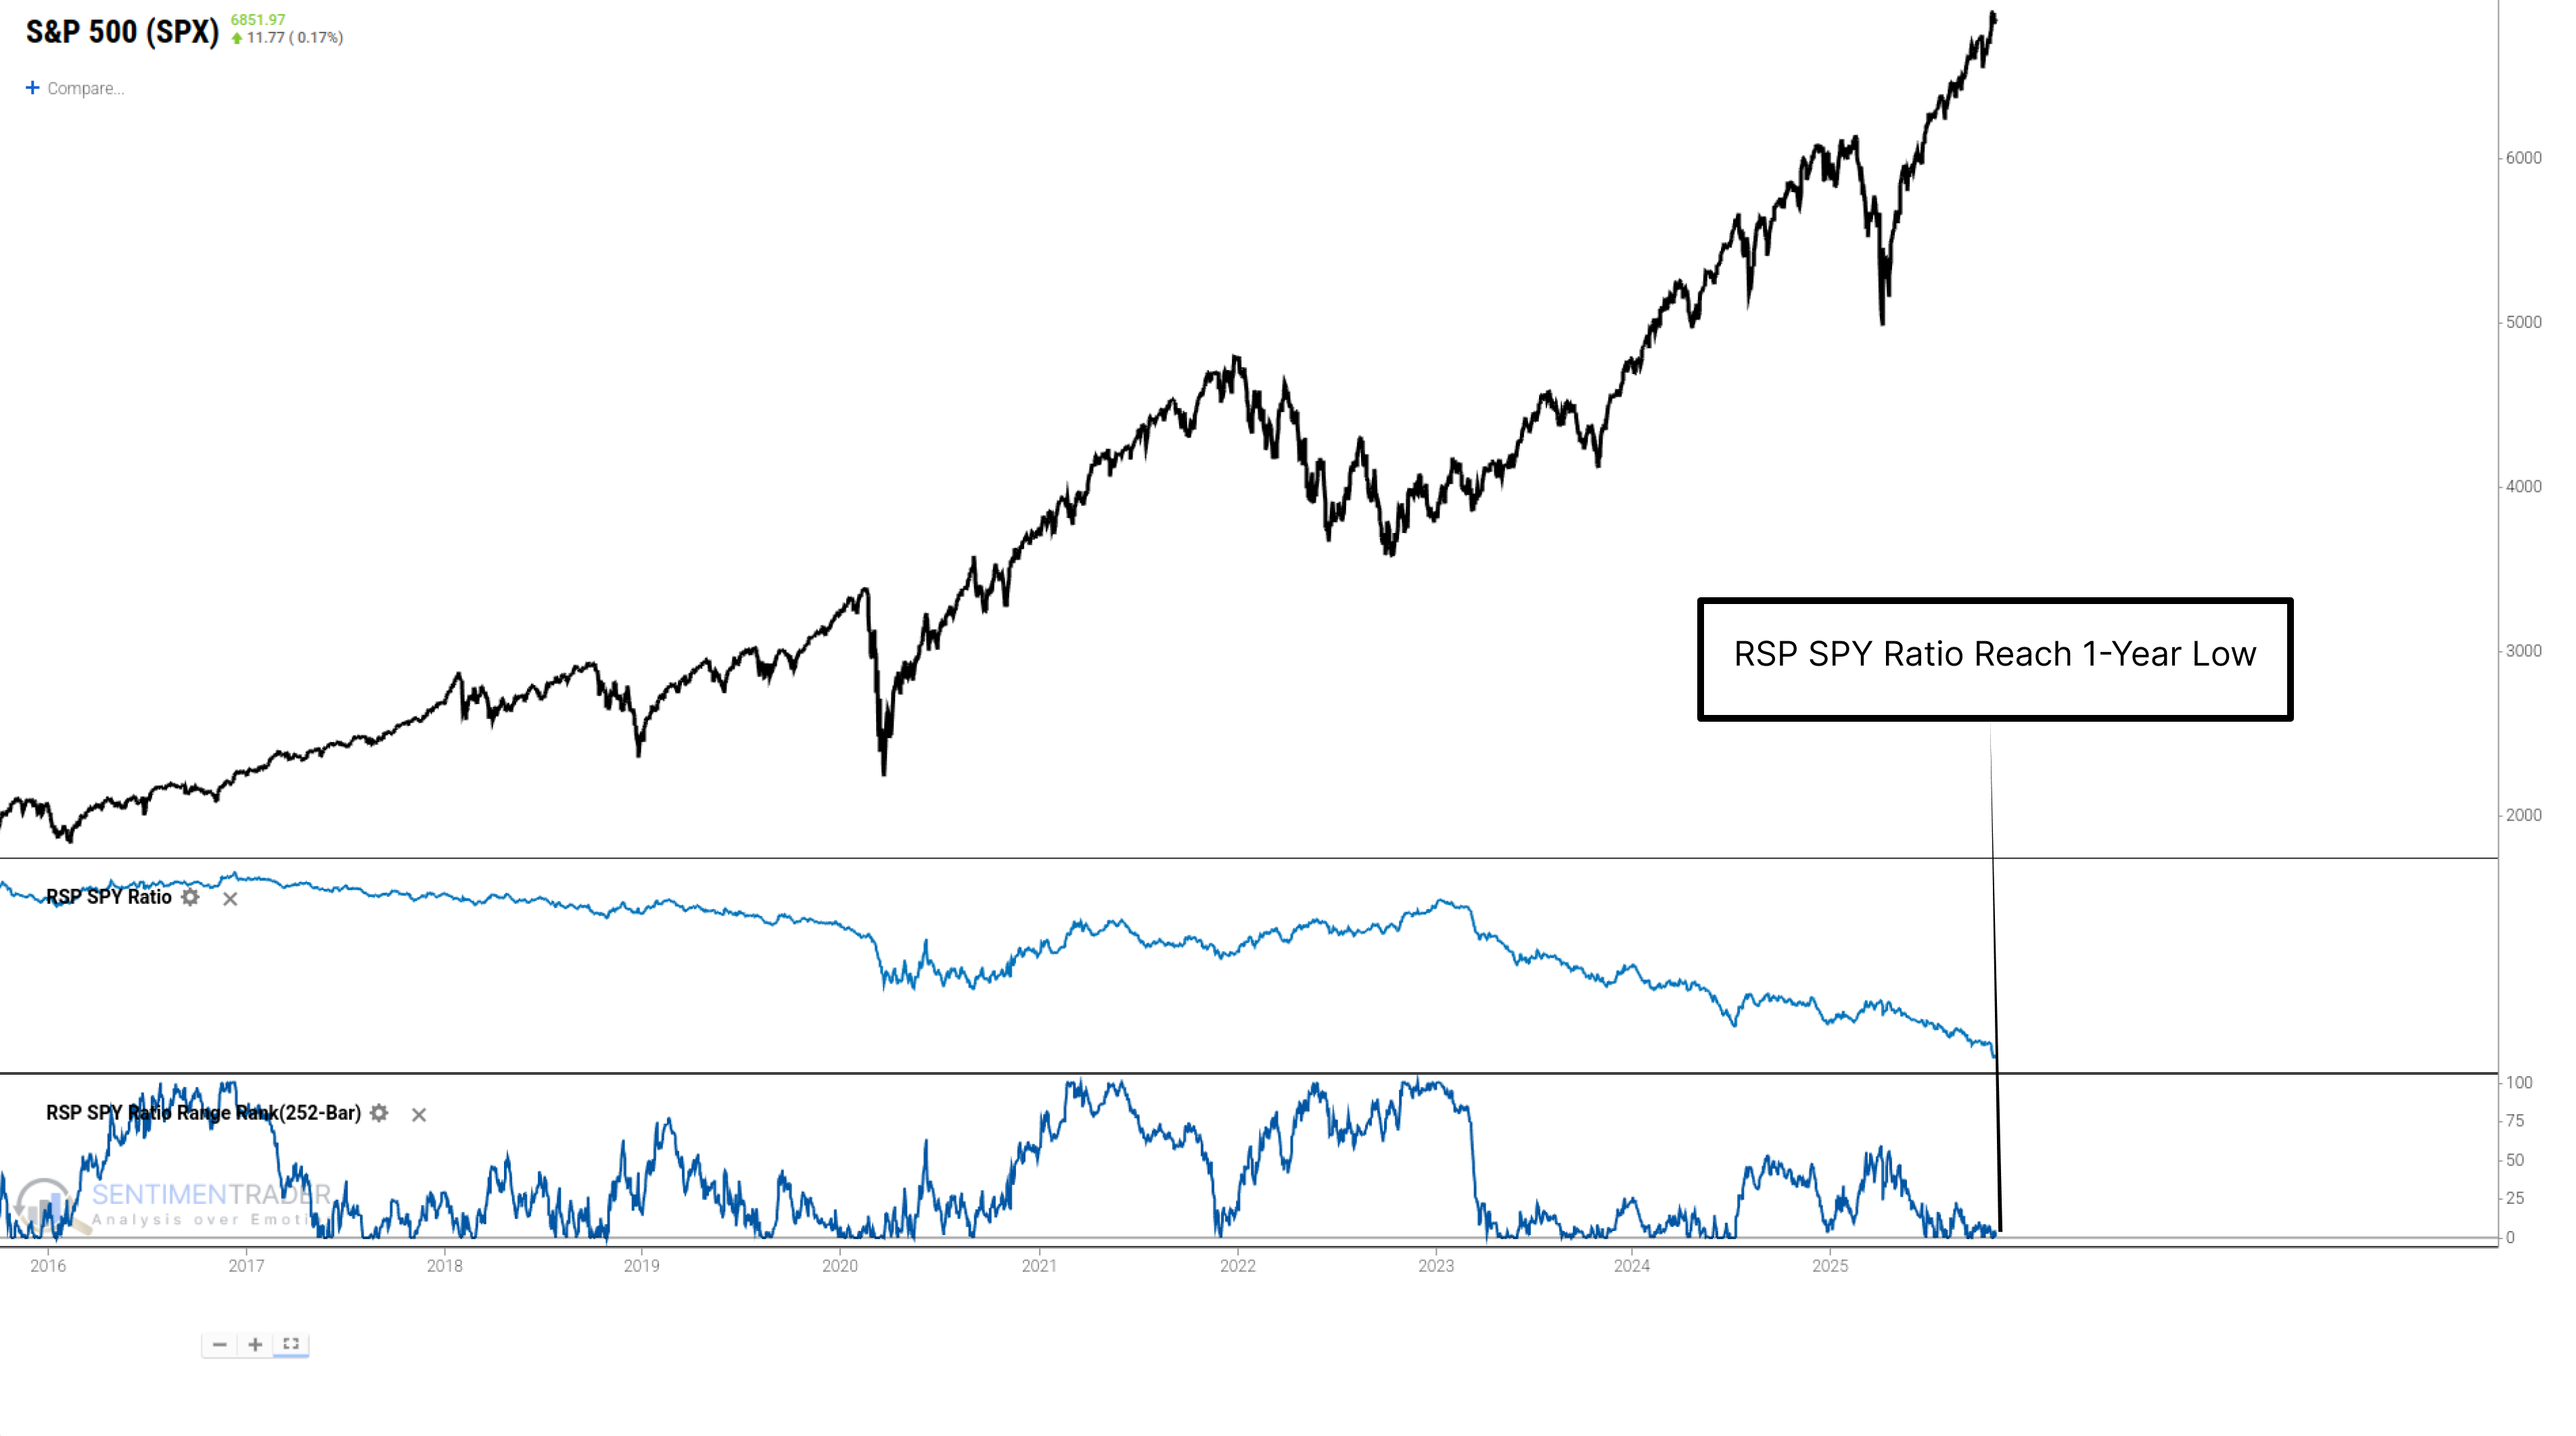
This confirms the market is in a state of extreme concentration: the vast majority of stocks are underperforming, and the index is propped up by just a handful of mega-cap stocks.
Does this mean the "generals" are about to collapse, and the "soldiers" will catch up?
This is the most critical question regarding this signal. Intuitively, when the "soldiers" (relative to the "generals") hit a one-year low, one might think RSP is "oversold" and a good opportunity to "bottom-fish" for RSP-i.e., bet on mean reversion.Related Backtest Click Here.
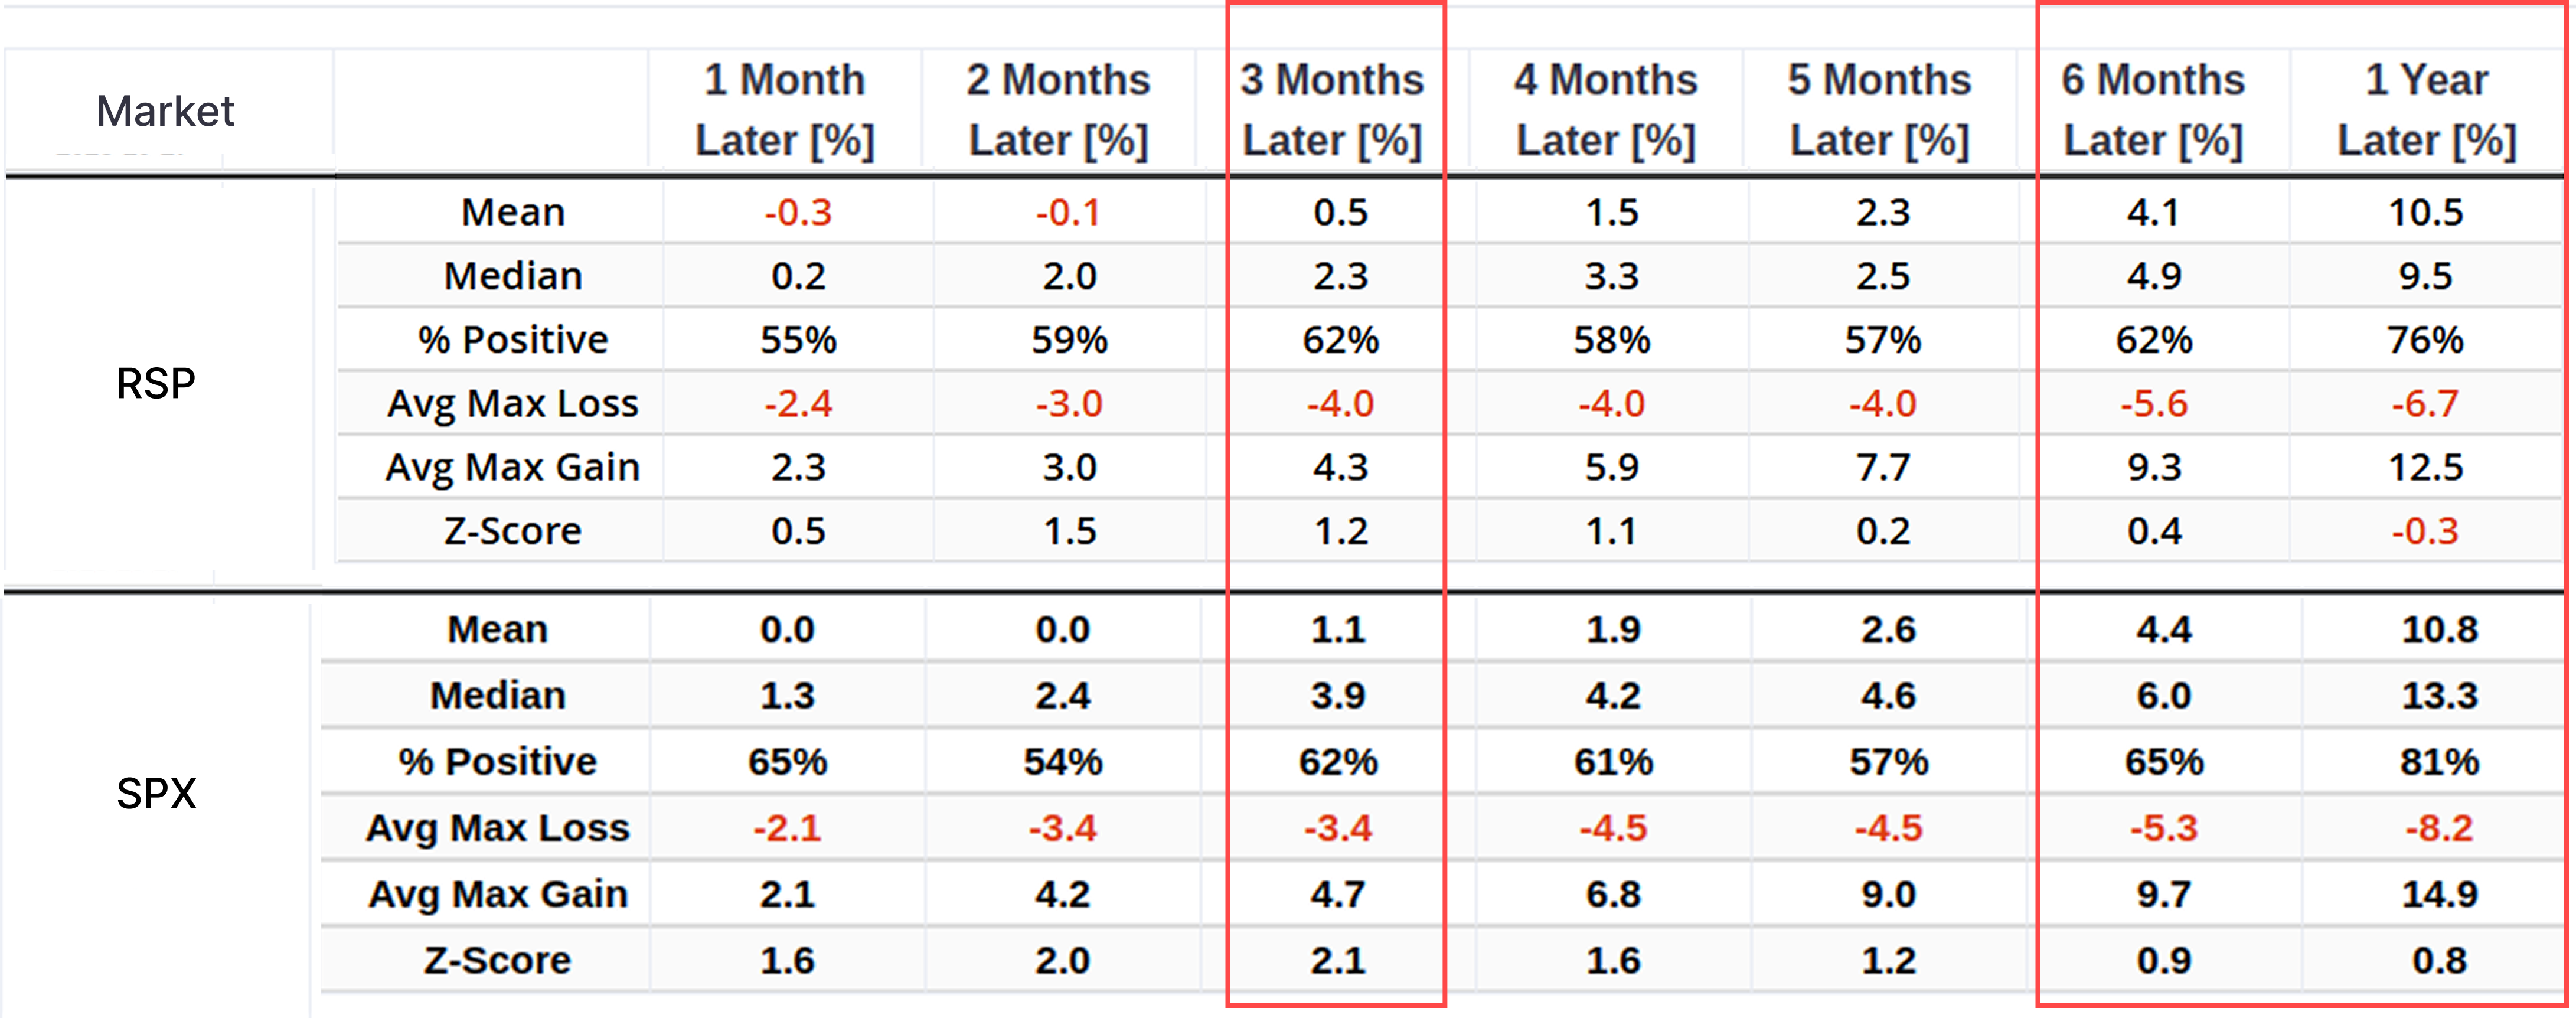
Historical data tells a clear story: after the RSP/SPY Ratio hits a one-year low, the strategy of "bottom-fishing" for RSP (following the intuitive view) has systematically underperformed the strategy of continuing to hold SPY.
While the difference in returns between the two is not enormous, it is sufficient to disprove the assumption that "mean reversion is the dominant strategy."
Thus, the core role of this signal (RSP/SPY new low) is "risk mitigation." It tells us not to expect the "soldiers" to catch up or rescue the broader market at this moment. This, in turn, reinforces our core logic: the market's fate-whether good or bad-is more firmly tied to those "generals."
What Does This "General-Led" Rally Imply?
We now know that professionals are using leverage to chase the few "generals," as confirmed by the NAAIM > 100 signal and the RSP/SPY signal.
To identify these "generals," let's analyze the performance of major S&P 500 sectors after the NAAIM > 100 signal is triggered.
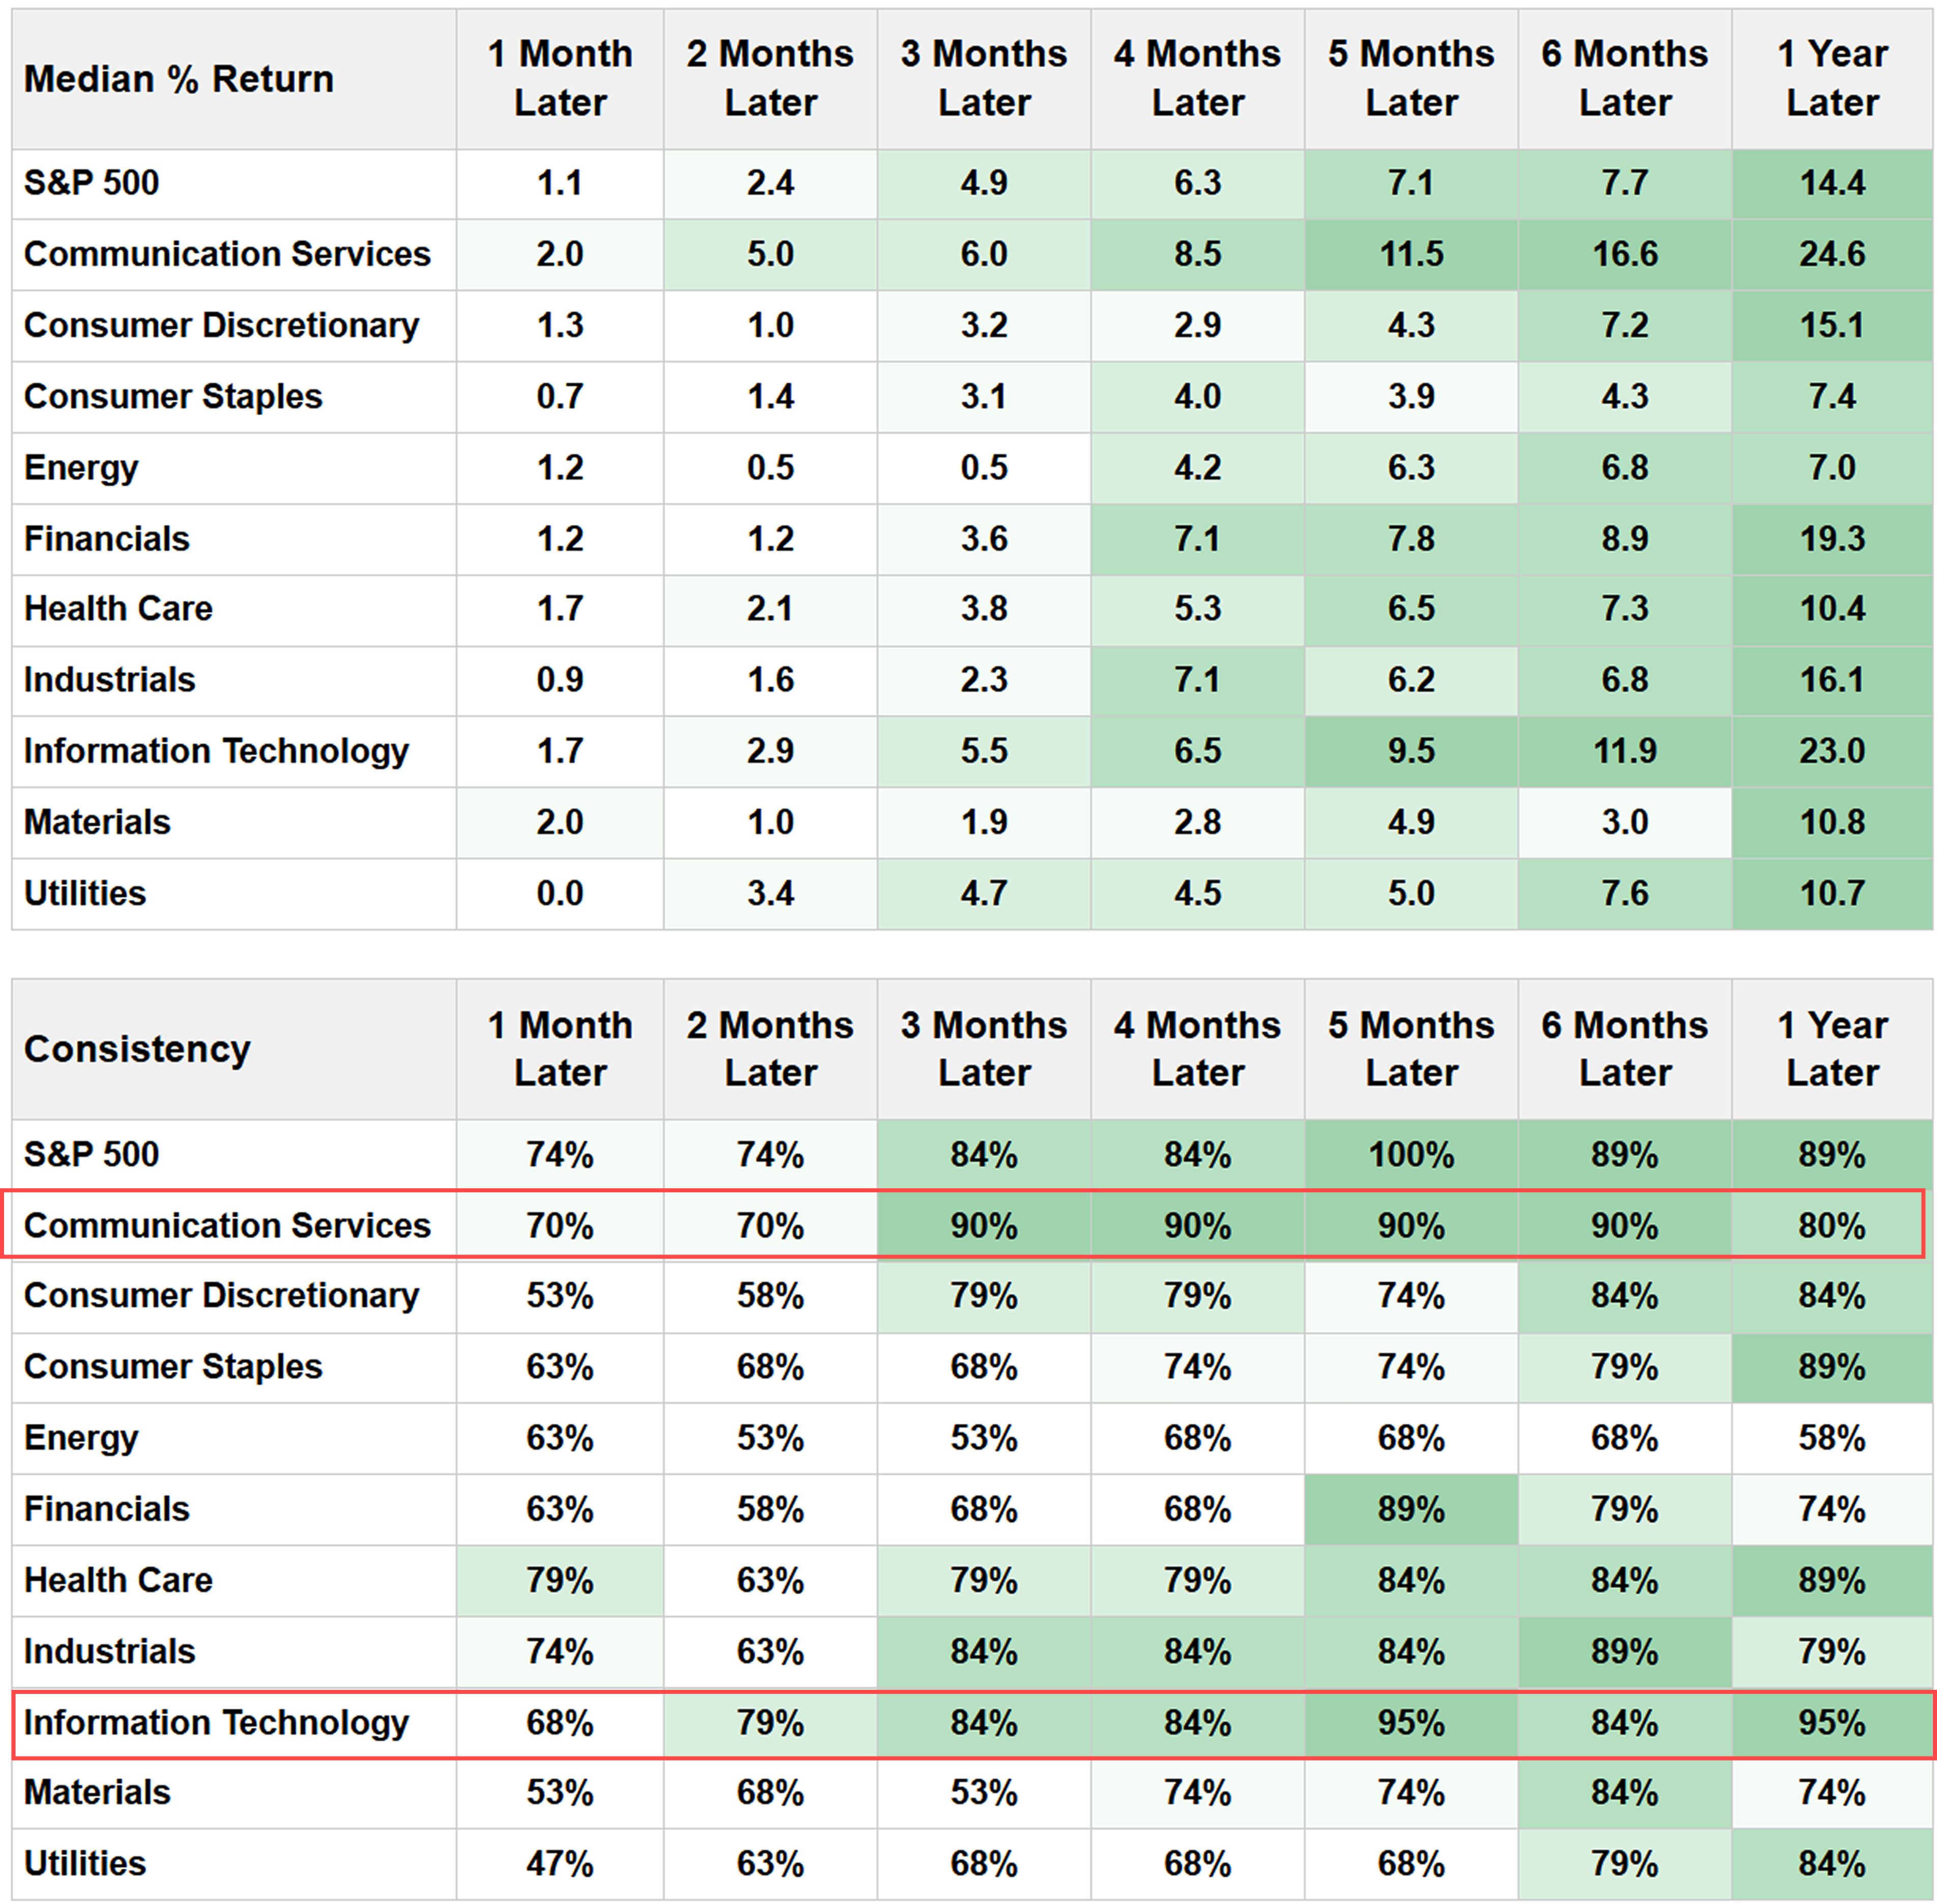
The data is clear. Information Technology (1-year win rate of 95%, median return of +23.0%) and Communication Services (1-year return of +24.6%) are the historical leaders. These are precisely the sectors where the current AI "generals" reside.
What the research tells us…
Like many indicators, the NAAIM Index and RSP/SPY Ratio are generally not suitable as standalone buy/sell signals. Instead, they should be part of a comprehensive analysis that considers multiple factors.
However, when we put these two "bricks" (pieces of evidence) together, a possible picture emerges:
We seem to be in a "high-leverage, high-concentration" market. Professionals are using leverage to chase a handful of leaders, and the vast majority of these leaders are in the technology and communication sectors.
This does add weight to the bullish view, but it also clearly exposes the core risk: this is a structurally fragile bull market. The stability of the entire market depends heavily on whether these tech "generals" can continue to deliver better-than-expected results. If there is any underperformance in this core driver (e.g., AI), this high-leverage and high-concentration structure could lead to a sharp increase in market volatility.