
Equal-weighted versus cap-weighted - Part III

Key points:
- In Part I, we highlighted a simple trend-following method for switching between the equal-weighted and capitalization-weighted S&P 500 indexes
- In Part II, we added a seasonal component to the mix
- In Part III, we will put the two strategies together to create a mechanical monthly strategy
A quick review of Part I and Part II
Part I of this series detailed a simple monthly trend-following approach for determining whether to favor the Equal-weighted S&P 500 Index or the Cap-weighted S&P 500 Index. Part II discussed a simple seasonal approach to switching between Equal and Cap-weighted indexes.
Now, we will combine those two into one monthly strategy. We again use SPXE and SPXT for testing purposes to calculate indicators and measure results. For actual trading purposes, an investor would hold the Invesco S&P 500 Equal Weight ETF (RSP) if the model favors Equal Weight and the SPDR S&P 500 ETF (SPY) if the model favors Cap Weight. There is also the potential for the model to hold cash during certain months.
Combining trend-following and seasonal strategies
I use total return data files for the S&P 500 Equal-Weight Index (SPXE) and the S&P 500 Total Return Index (SPXT) for testing purposes. That said, I view month-end price data for tickers RSP and SPY as viable (and easier to obtain) substitutes.
At the end of each month, I perform the calculations below to generate a reading for what I refer to as the RSPSPY Model.
A = S&P 500 Equal-weighted Index month-end price
B = S&P 500 Index Cap-weighted Index month-end price
C = A / B
D = 4-month exponential moving average of C
E = C - D
F = If E >= 0 then F = +2 else F = 0 (i.e., if Equal-weight is leading, Variable F = +2, else Variable F = +1)
G = If the next month is November through April G = +1 else G = 0
H = F + G
RSPSPY Model (Switching Strategy) = H
NOTE: The phrases "RSPSPY Model" and "Switching Strategy" are used interchangeably in the text and screenshots below.
The RSPSPY Model can read 0, +1, +2, or +3 at the end of each month. The chart below displays the month-end reading for the RSPSPY Model since 1988.
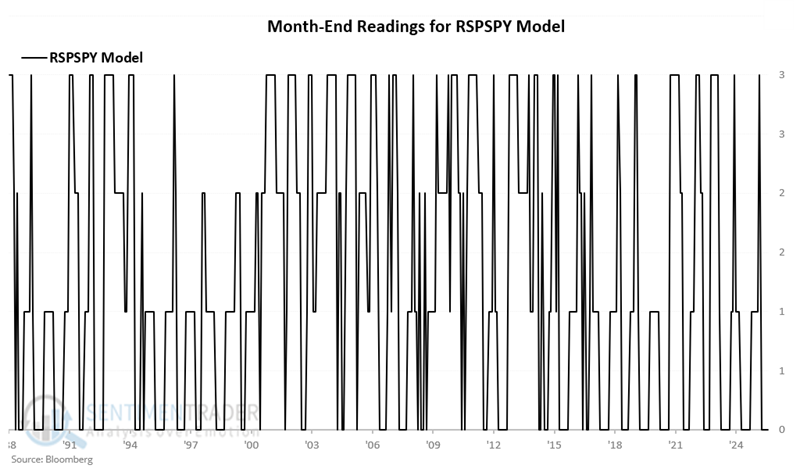
That month-end reading determines which index - if any - we will hold the following month. Let's review each possible reading and how the indexes have performed from January 1988 through August 2025.
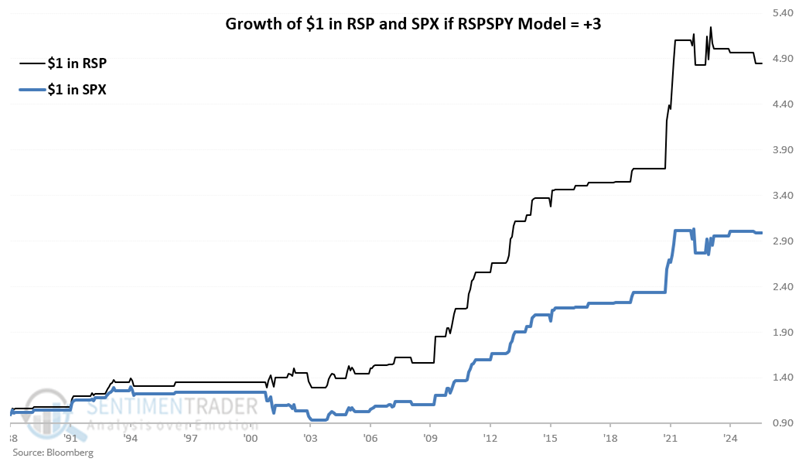
RSPSPY Model = +3
The month-end model value will read +3 only if:
- The latest month-end Equal-weighted versus Cap-weighted ratio is above its 4-month exponential moving average, AND
- The next month is November through April
The chart below displays the hypothetical growth of $1 invested in the Equal-weighted versus the Cap-weighted index only when the RSPSPY Model ended the previous month with a reading of +3.
The Equal-weighted index gained 385% and the Cap-weighted index gained 199%.
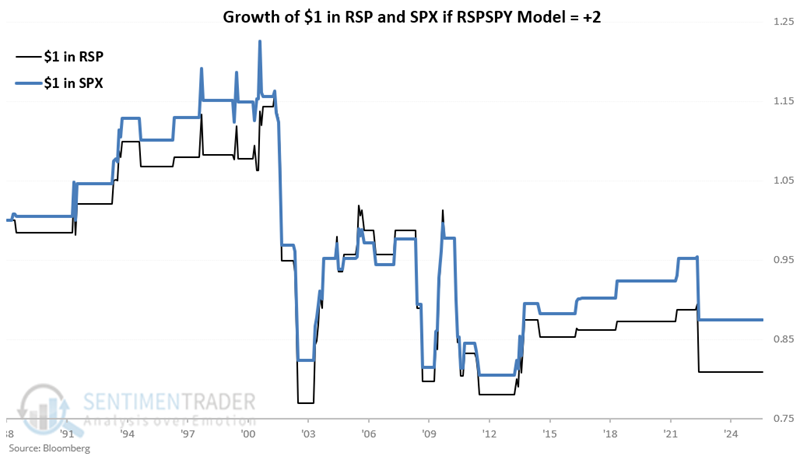
RSPSPY Model = +2
The month-end model value will read +2 only if:
- The latest month-end Equal-weighted versus Cap-weighted ratio is above its 4-month exponential moving average, AND
- The next month is May through October
The chart below displays the hypothetical growth of $1 invested in the Equal-weighted versus the Cap-weighted index only when the RSPSPY Model ended the previous month with a reading of +2. Interestingly, both indices lost money when the model read +2.
The Equal-weighted index lost 19% and the Cap-weighted index lost 12%.
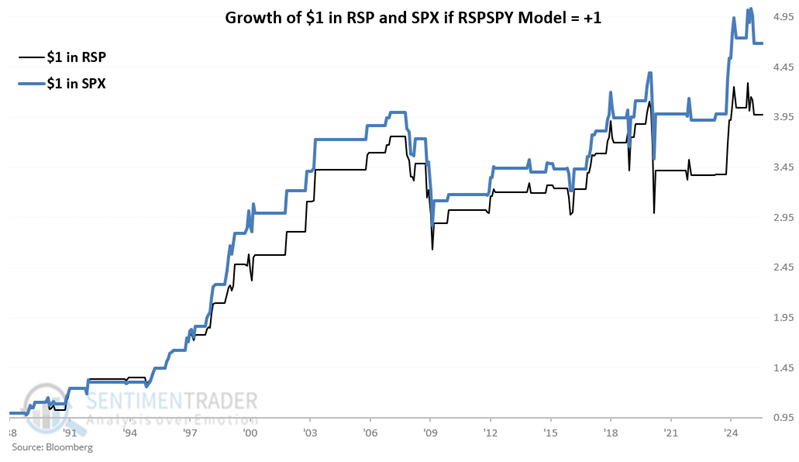
RSPSPY Model = +1
The month-end model value will read +1 only if:
- The latest month-end Equal-weighted versus Cap-weighted is below its 4-month exponential moving average, AND
- The next month is November through April
The chart below displays the hypothetical growth of $1 invested in the Equal-weighted versus the Cap-weighted index only when the RSPSPY Model ended the previous month with a reading of +1.
The Equal-weighted index gained 298% and the Cap-weighted index gained 369%.
RSPSPY Model = 0
The month-end model value will read zero only if:
- The latest month-end unweighted versus weighted ratio is below its 4-month exponential moving average
- The next month is May and October
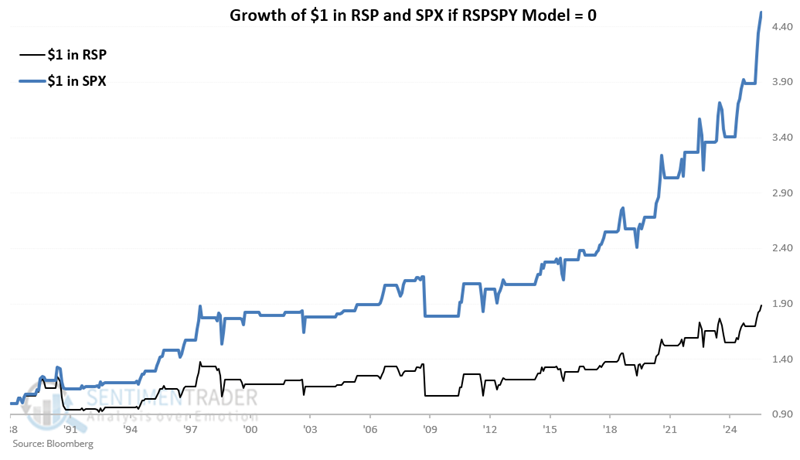
The chart below displays the hypothetical growth of $1 invested in the Equal-weighted versus the Cap-weighted index only when the RSPSPY Model ended the previous month with a reading of 0.
The Equal-weighted index gained 89% and the Cap-weighted index gained 353%.
RSPSPY Model Trading Rules
For the next test, we will adopt the following rules. If the month-end RSPSPY Model value is:
= +3 then hold RSP for the next month
= +2 then hold Cash for the next month
= 0 or +1, then hold SPY for the next month
So, to be clear, if the RSPSPY Model ends a month with a reading of +3, we will hold the Equal-weighted index (RSP) the following month. If the Model is at 0 or +1, we will hold the Cap-weighted index (SPY), and if the model ends a month at 0, we will hold cash the following month.
The table below summarizes the possibilities for each month, based on the reading for the RSPSPY Model at the end of the previous month.
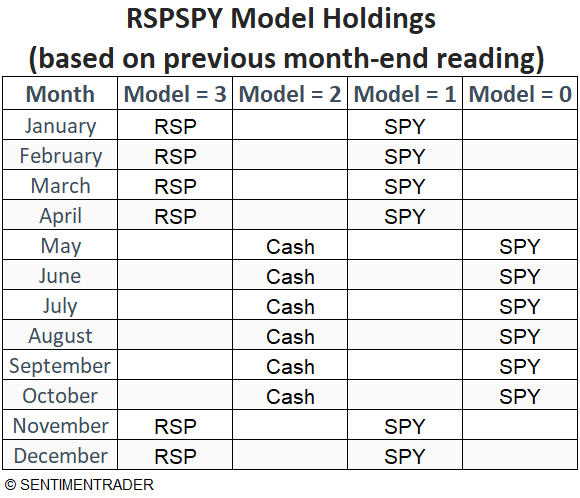
The RSPSPY Model has held a month-end reading of zero since the end of April. Thus, it has held SPY since May 1st and is virtually a lock to continue holding it again in October.
Testing results
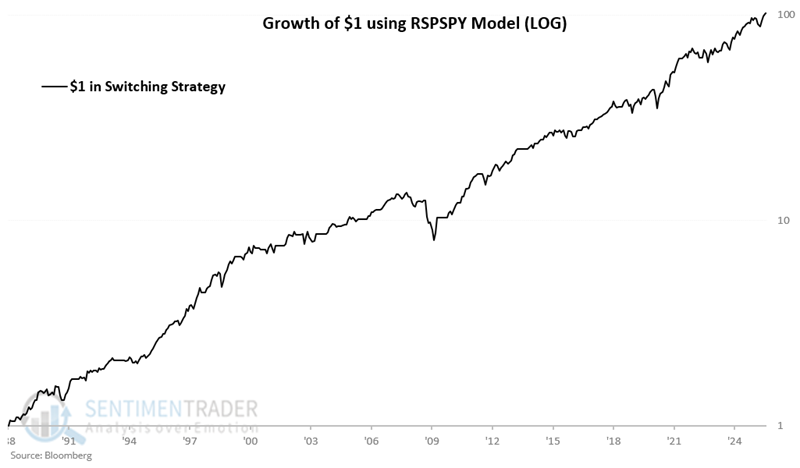
The chart below displays the hypothetical growth of $1 invested using the RSPSPY Model (note that the term "Switching Strategy" is used interchangeably below to represent the RSPSPY Model) on a logarithmic scale.
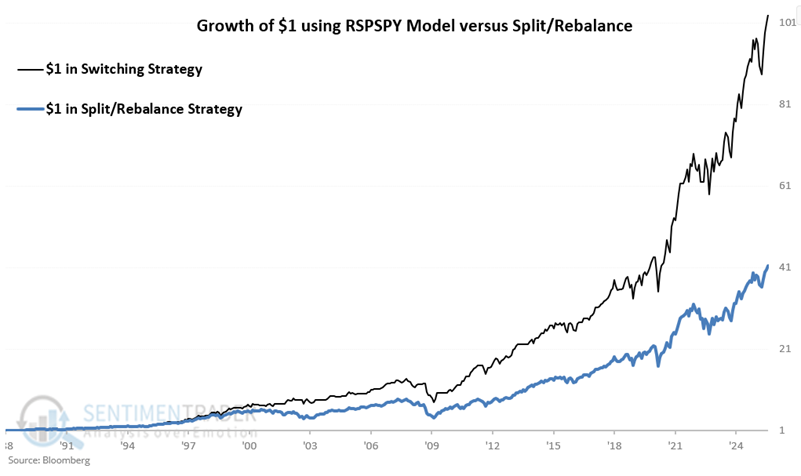
The black line in the chart below displays the hypothetical growth of $1 invested using the rules above. For comparison, the blue line tracks the hypothetical growth of $1 using a strategy that splits capital 50/50 between equal-weighted and cap-weighted indexes and rebalances to 50/50 on January 1st of each year.
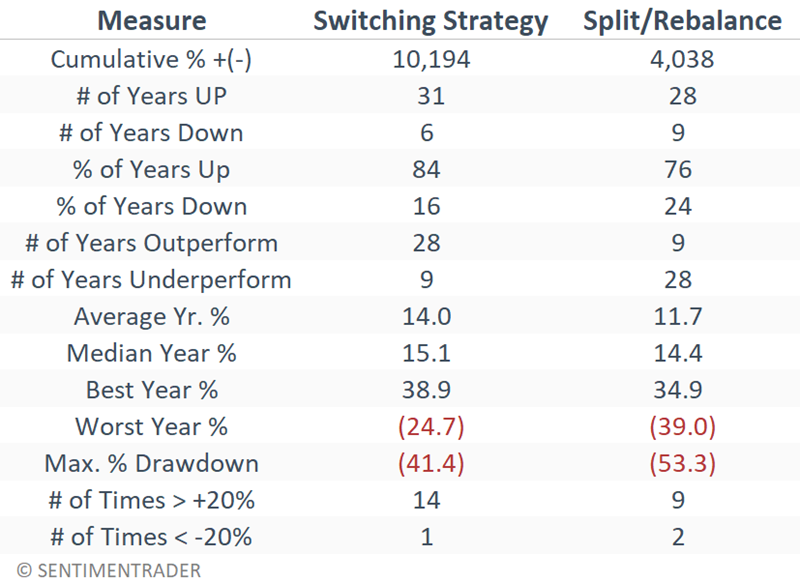
From January 1988 through July 2025, the hypothetical gain for the RSPSPY Model Switching Strategy was +10,194% versus +4,038% for the Split/Rebalance Strategy.
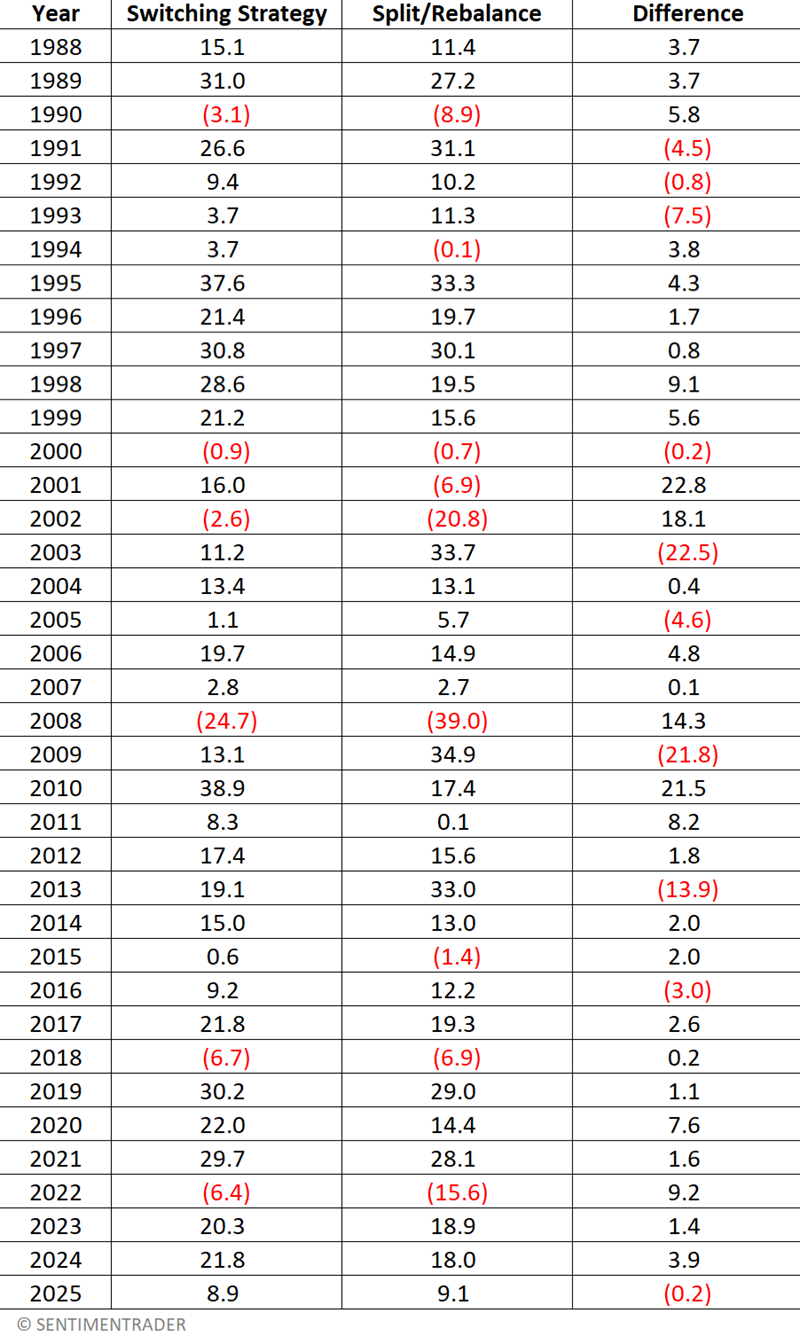
The table below displays the hypothetical year-by-year results for both strategies and the difference between the two. Note that the 2025 results are through the end of August.
The table below summarizes the results for both strategies.
Some notes on real-world trading
Remember that this strategy is not presented as some world-beater investment approach. Its sole objective is to offer a slight edge beyond simply buying and holding an index fund. The good news is that it has outperformed split/rebalance over time. However, that outperformance has by no means occurred in a straight line. To achieve potential long-term benefits, a trader must stick with the strategy and continue to take all new trades signaled, regardless of any short-term declines in relative performance. Please note that for many, this is easier said than done.
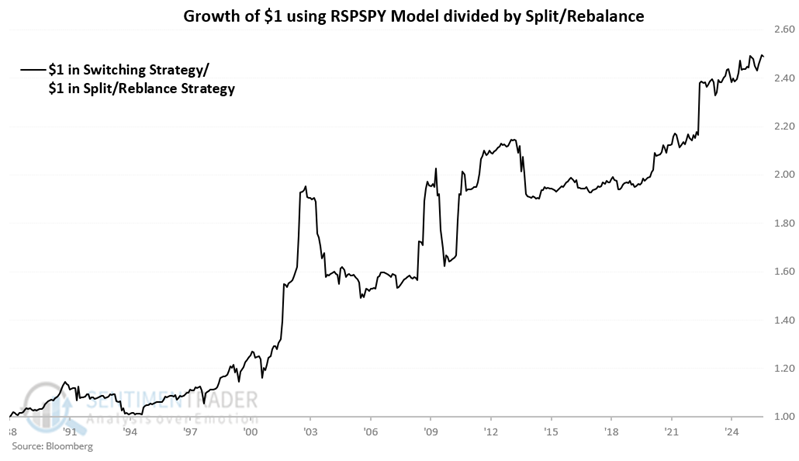
While the Switching Strategy outperformed the Split/Rebalance Strategy by 2.5 to 1 over 37 years, it was not "smooth sailing." The chart below compares the growth of $1 invested using the Switching Strategy with the growth of $1 invested using the Split/Rebalance Strategy. While the overall trend is lower left to upper right, there have been some significant downdrafts where the Switching Strategy seriously underperformed Split/Rebalance significantly. This has typically occurred when the RSPSPY Model held Cash and the stock market rallied.
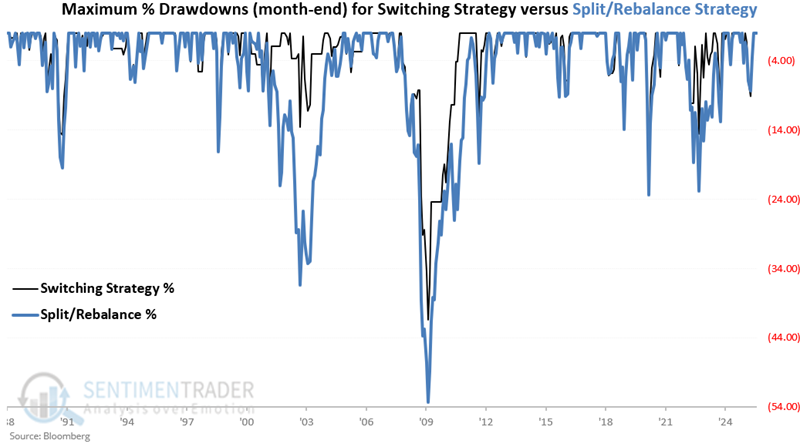
Drawdowns are another issue investors should consider. While the RSPSPY Model can sometimes hold cash, it is not immune to occasional fluctuations. The chart below displays the maximum drawdowns for both strategies (based on month-end data; intra-month declines could be greater). The good news is that drawdowns have tended to be less severe for the Switching Strategy than for Split/Rebalance. The bad news is that the Switching Strategy still suffered a -41% drawdown during the 2008-09 bear market. While this is better than the -53% drawdown suffered by Split/Rebalance, that is small comfort in real-time.
Another issue is taxes. If you buy and hold a single index fund or ETF in perpetuity, you never pay until you sell your shares (excluding taxable distributions or dividends). Presumably, you will pay long-term capital gains rates when that time comes. Conversely, if you make two trades yearly, as the switching strategy does at a minimum, you will generate two taxable events each year, with short-term tax rates applying. As a result, the switching strategy above is likely best followed in a non-taxable account.
What the research tells us…
There is an ebb and flow between any two securities over time, even if based on an index comprising the same securities. What we have seen in this series is the simple fact that an index that gives equal weight to specific stocks will perform differently from another index that weighs the same securities based on market capitalization. More importantly, we have found that by comparing the performance of said indexes, investors may gain an edge over time by focusing on such factors as momentum and seasonality.