
Equal-weighted versus cap-weighted - Part I

Key points
- An equal-weighted index gives the same weight to each security in the index; A capitalization-weighted index weights each security based on stock price times the number of shares outstanding
- The S&P 500 Equal-Weight Index is tracked by ticker RSP; The standard S&P 500 Index which is cap-weighted is tracked by ticker SPY
- There is an ebb and flow to movements of equal-weighted versus cap-weighted
- Investors may be able to exploit variances in the types of indexes to improve long-term results
A look at equal-weight versus cap-weighted
We will consider a simple trend-following approach to switching between equal-weighted and cap-weighted S&P 500 indexes in Part I. In Part II, we will examine a seasonal approach.
Over many years, the relationship between the S&P 500 Equal-Weight Index (SPXE) and the S&P 500 Index (SPXT), which is capitalization-weighted, has experienced much ebb and flow. For trading purposes, investors can buy the Invesco S&P 500 Equal Weight ETF (RSP) to emulate the equal-weighted index and the SPDR S&P 500 ETF (SPY) to track the cap-weighted index.
The chart below displays the performance of RSP and SPY in the top clip and the relationship between the two in the bottom clip.
- When the black line in the bottom clip rises, it means equal-weighted is outperforming cap-weighted
- When the black line in the bottom clip falls, it means cap-weighted is outperforming equal-weighted
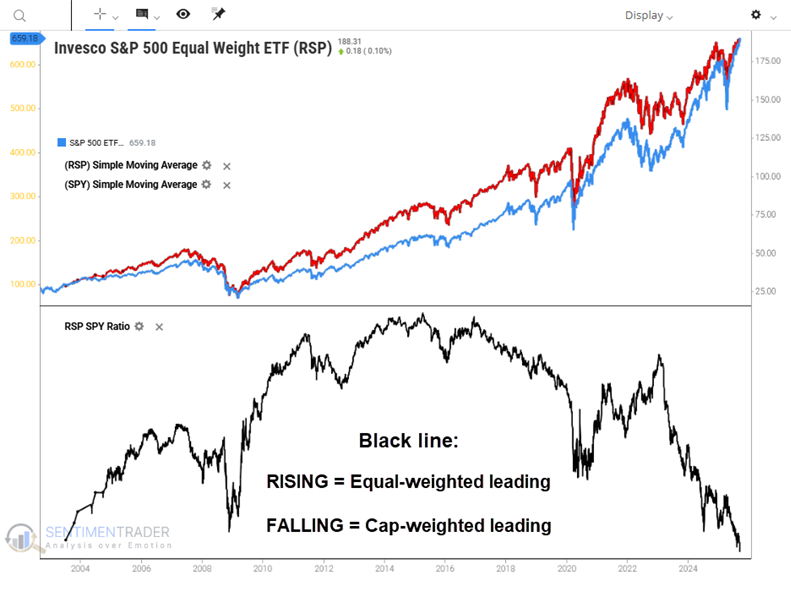
There are two things to glean from the chart above:
- The equal-weighted index has vastly underperformed the cap-weighted since 2023
- This current trend will not last forever
Some might look at the chart above and presume that because the ratio is at a new low, it is "due for a reversal." However, trying to "pick the bottom" is not recommended. A trend-following approach to switching between the indexes appears to hold more promise.
A trend-following approach to equal versus cap-weighted indexes
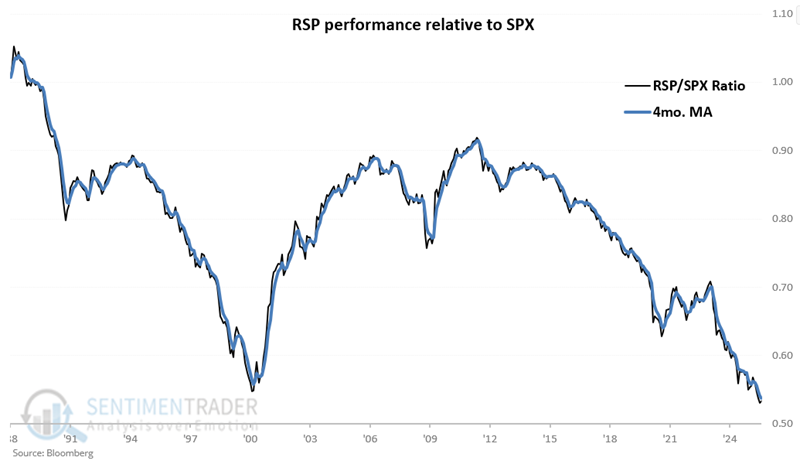
Now let's add a four-month exponential moving average to better track this relationship. The chart below tracks the equal-weighted versus cap-weighted ratio (back line) and adds a four-month exponential moving average (blue line). To keep things simple, this chart is updated only at the end of each month.
The value in the following chart is determined by subtracting the latest 4-month exponential average from the equal-weighted/cap-weighted ratio at the end of each month. Positive values indicate that equal-weight is outperforming and vice versa. This value has been negative (i.e., favoring the cap-weighted S&P 500 Index and ticker SPY) since the end of April 2025.
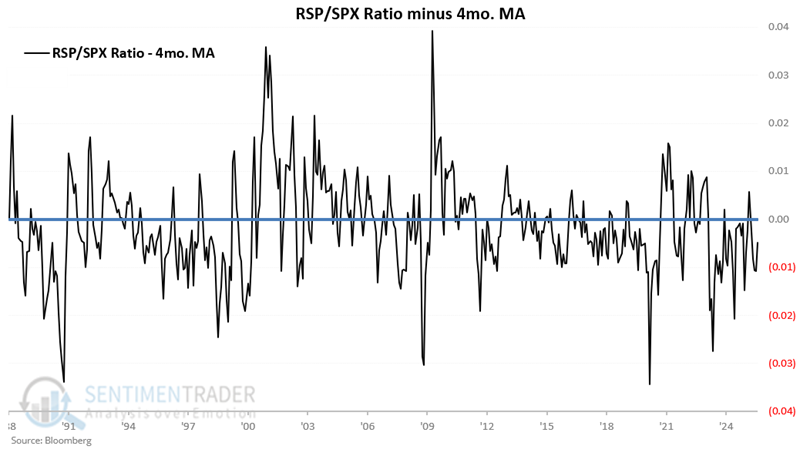
Be aware that this approach involves a fair amount of trading (albeit only at month-end), as the value in the chart above frequently crosses above and below zero.
Using the Equal-weighted/Cap-weighted Ratio to trade
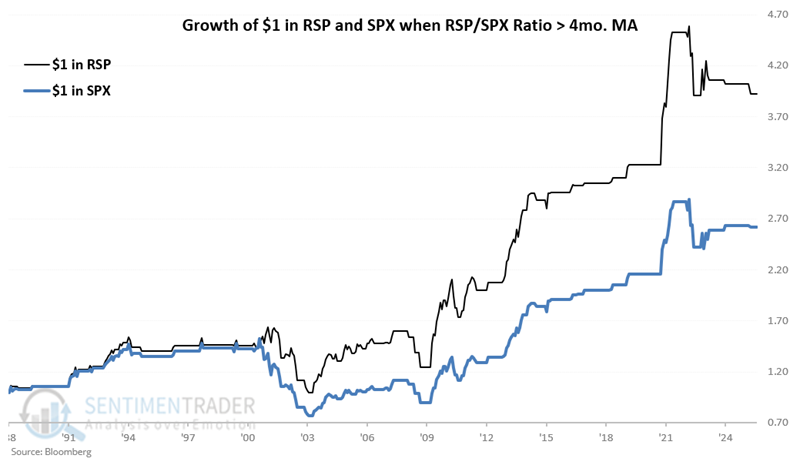
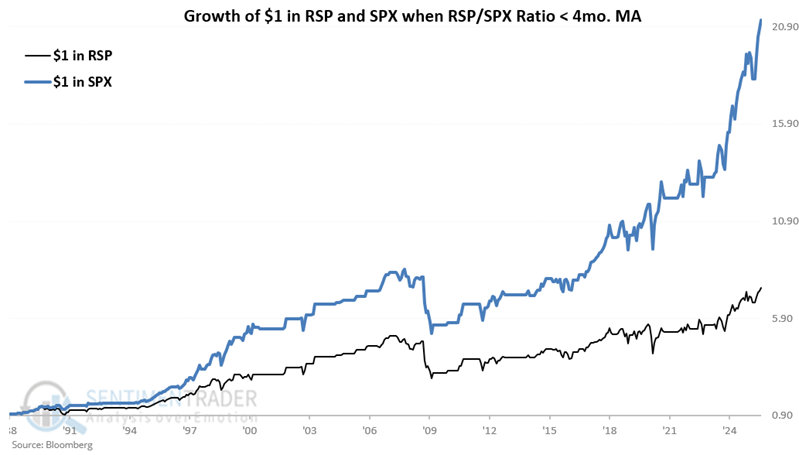
The chart below displays the hypothetical growth of $1 invested in each index, only when the Equal-weighted/Cap-weighted ratio closed the previous month above its 4-month exponential average from January 1988 through August 2025.
The Equal-weighted index gained a cumulative 292% while the Cap-weighted gained 162%.
Conversely, the chart below displays the hypothetical growth of $1 invested in each index, only when the Equal-weighted/Cap-weighted ratio closed the previous month below its 4-month exponential average.
The Equal-weighted index gained a cumulative 649% while the Cap-weighted index gained 2,023%.
Creating a Simple Switching System
Let's test the following hypothetical strategy starting at the end of January 1988. At the end of each month, we will compare the Equal-weighted/Cap-weighted ratio to its four-month exponential moving average.
- If the result equals or exceeds zero, we will hold the equal-weighted index (SPY) next month
- If the result is less than zero, we will hold the cap-weighted index (RSP) next month
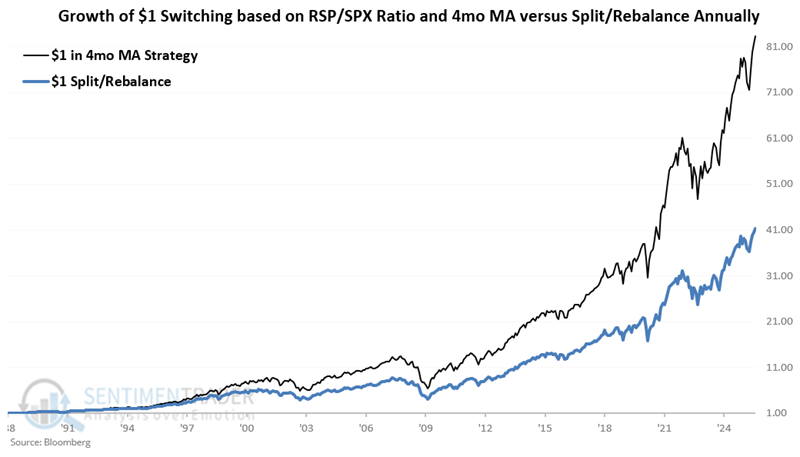
For comparison, we will also track a strategy that splits capital 50/50 between equal-weighted and cap-weighted indexes and rebalances to 50/50 on January 1st of each year to emulate a buy-and-hold approach.
The chart below shows that the Switching Strategy (black line) gained +8230% versus +4,038% for the Split/Rebalance Strategy (blue line).
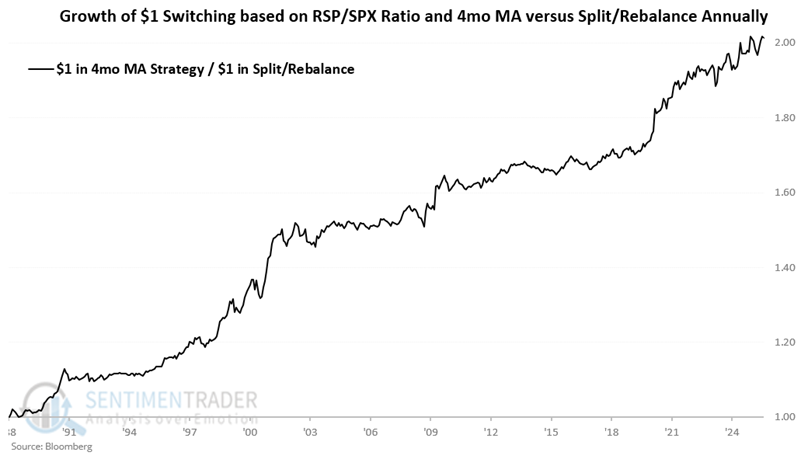
To better appreciate the potential viability of this strategy, consider the chart below. The value shown divides the cumulative growth of $1 invested using the Switching Strategy by the cumulative growth of $1 invested using the Split/Rebalance Strategy. When the line is rising, it means that the Switching Strategy is outperforming.
Note the ratio line's gentle but persistent "Lower left to upper right" nature in the chart below. This suggests a strategy consistently outperforming a buy-and-hold (and rebalance annually) approach. That said, past performance never guarantees future results.
One danger in a method like this is that there will be periods when the strategy gets whipsawed from month to month and potentially underperforms for an extended period of time. Investors who adopt such an approach must resolve to take the trades as they are signaled and not start second-guessing signals simply because the strategy has not outperformed buy-and-hold over some arbitrary period.
In Part II, we will add a seasonal element to this strategy.
What the research tells us…
There is an ebb and flow in the financial markets for almost any two securities or indexes. Understanding "why" any given relationship changes over time is not necessarily essential. Likewise, assuming that the trend in any given relationship is "due" to reverse is extremely dangerous. The method detailed above may help investors improve their long-term performance by allowing them to focus on the primary trend.
Jay's Trading Maxim #7: Investing doesn't have to be rocket science.