
Equal-weighted versus Cap-weighted in winter

Key points
- Over many decades, the S&P 500 Equal Weight Index has outperformed from November through April
- Results have been somewhat less robust in recent years
- If we step back and look at the stock market over several decades, certain patterns emerge
Equal-Weight versus Cap-Weighted explained
The S&P 500 Index is a "cap-weighted" index. This means that the price of each component stock is multiplied by the number of shares outstanding for that stock to calculate the overall index average. This also means that stocks with the largest capitalization have a greater influence on the index's price. This can be a good thing or a bad thing. It's been a boon for investors in recent years as mega-cap stocks such as Apple, Amazon, Nvidia, and Microsoft have outperformed. No one can say how long this trend will continue (though there are roughly six bazillion varying opinions currently available on the internet, but I digress).
As the name implies, the S&P 500 Equal Weight Index applies equal weight to all stocks in the index. At each quarterly rebalancing, companies are equally weighted using closing prices as of the second Friday of the quarter-ending month as the reference price. Each company in the S&P 500 Equal Weight Index is assigned a weight of 0.20% as of the pricing reference date. Thus, the smallest stock in the index can influence the index price movement just as much as the largest stock.
Traders and investors can emulate the S&P 500 Unweighted Index via the Invesco S&P 500 Equal Weight Index ETF (ticker RSP). The traditional S&P 500 Index can be emulated using the SPDR S&P 500 ETF (ticker SPY) or the Vanguard S&P 500 Index ETF (VOO), among others.
So, when is one version better than the other? We will address this next.
Equal-Weight versus Cap-Weighted from November through April
The following test assumes that separate investments are made in both the standard (cap-weighted) S&P 500 Index (SPX) and the equal-weighted version (SPXE). For this test, we will hold both indexes only from the close on October 31st each year through the close on April 30th the following year.
The chart below displays the growth of $1 invested separately in each index during November through the following April, starting in November 1957.
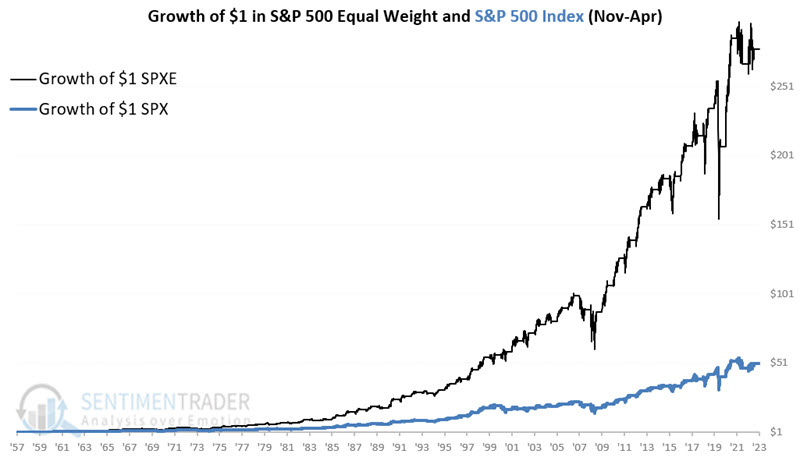
Since 1957, SPXE has gained +27,666% from November through April versus +4,959% for SPX.
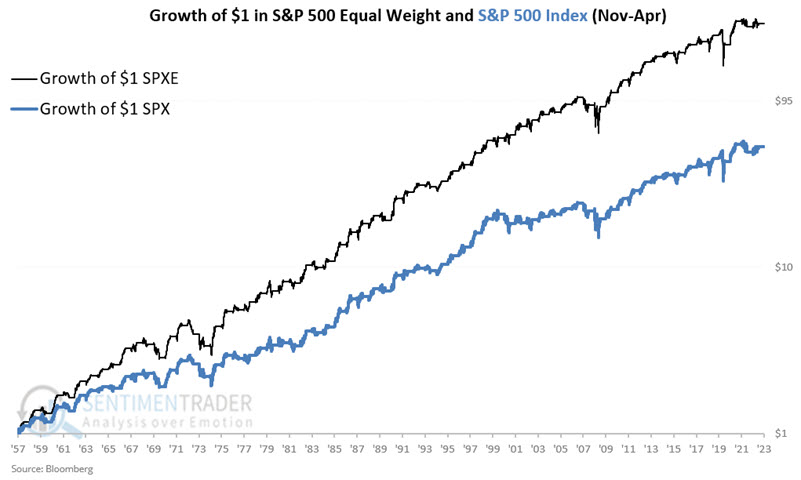
The chart below displays the same values as the chart above but on a logarithmic scale.
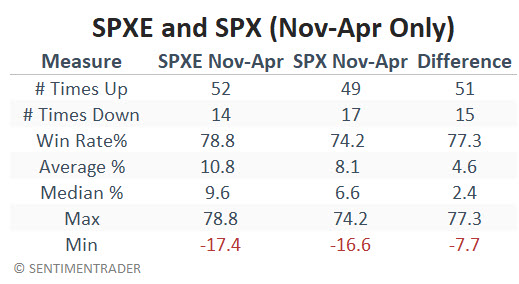
The table below summarizes the performance for the two indexes during the November-April period, as well as the "Difference" between the two on an annual basis. Note that SPXE has outperformed SPX 51 times in 66 years (77.3% of the time) from November through April.
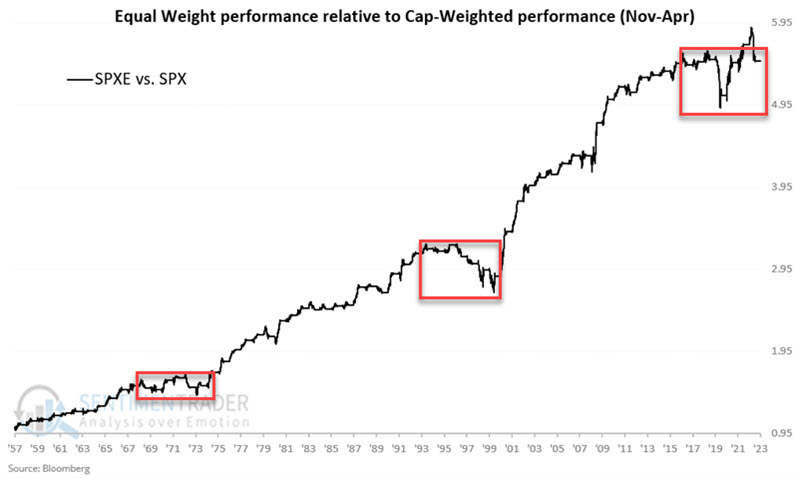
Based on the overall numbers, the SPXE appears to be the clear choice from November through April. That said, the chart below displays the cumulative growth for SPXE relative to SPX during November through April since 1957.
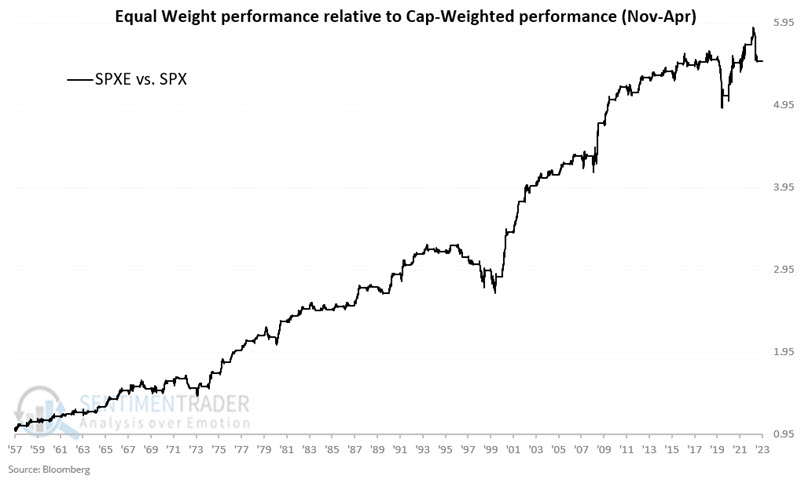
Note that since 2016, there has been no advantage to holding SPXE rather than SPX during November through April. There is precedence. From 1968 through 1973 and again from 1996 through 2000, SPXE underperformed SPX during this purportedly "better for equal weight" period. These years-long underperforming periods are highlighted in the chart below.
What the research tells us…
Will SPXE outperform SPX over the next six months? The reality is that there is no way to predict. And therein lies the primary caveat surrounding any purported seasonal trend - there is no guarantee that it will work as anticipated "this time around." That said, real-world investing is a game of probabilities, not certainties. While there is no guarantee that SPXE will once again gain an advantage over SPX during the winter months - particularly during any given year - a 77% outperformance rate (relative to the cap-weighted index) over 66 years of history suggests giving the unweighted index the benefit of the doubt.