
Equal weight does not mean equal performance

Key points:
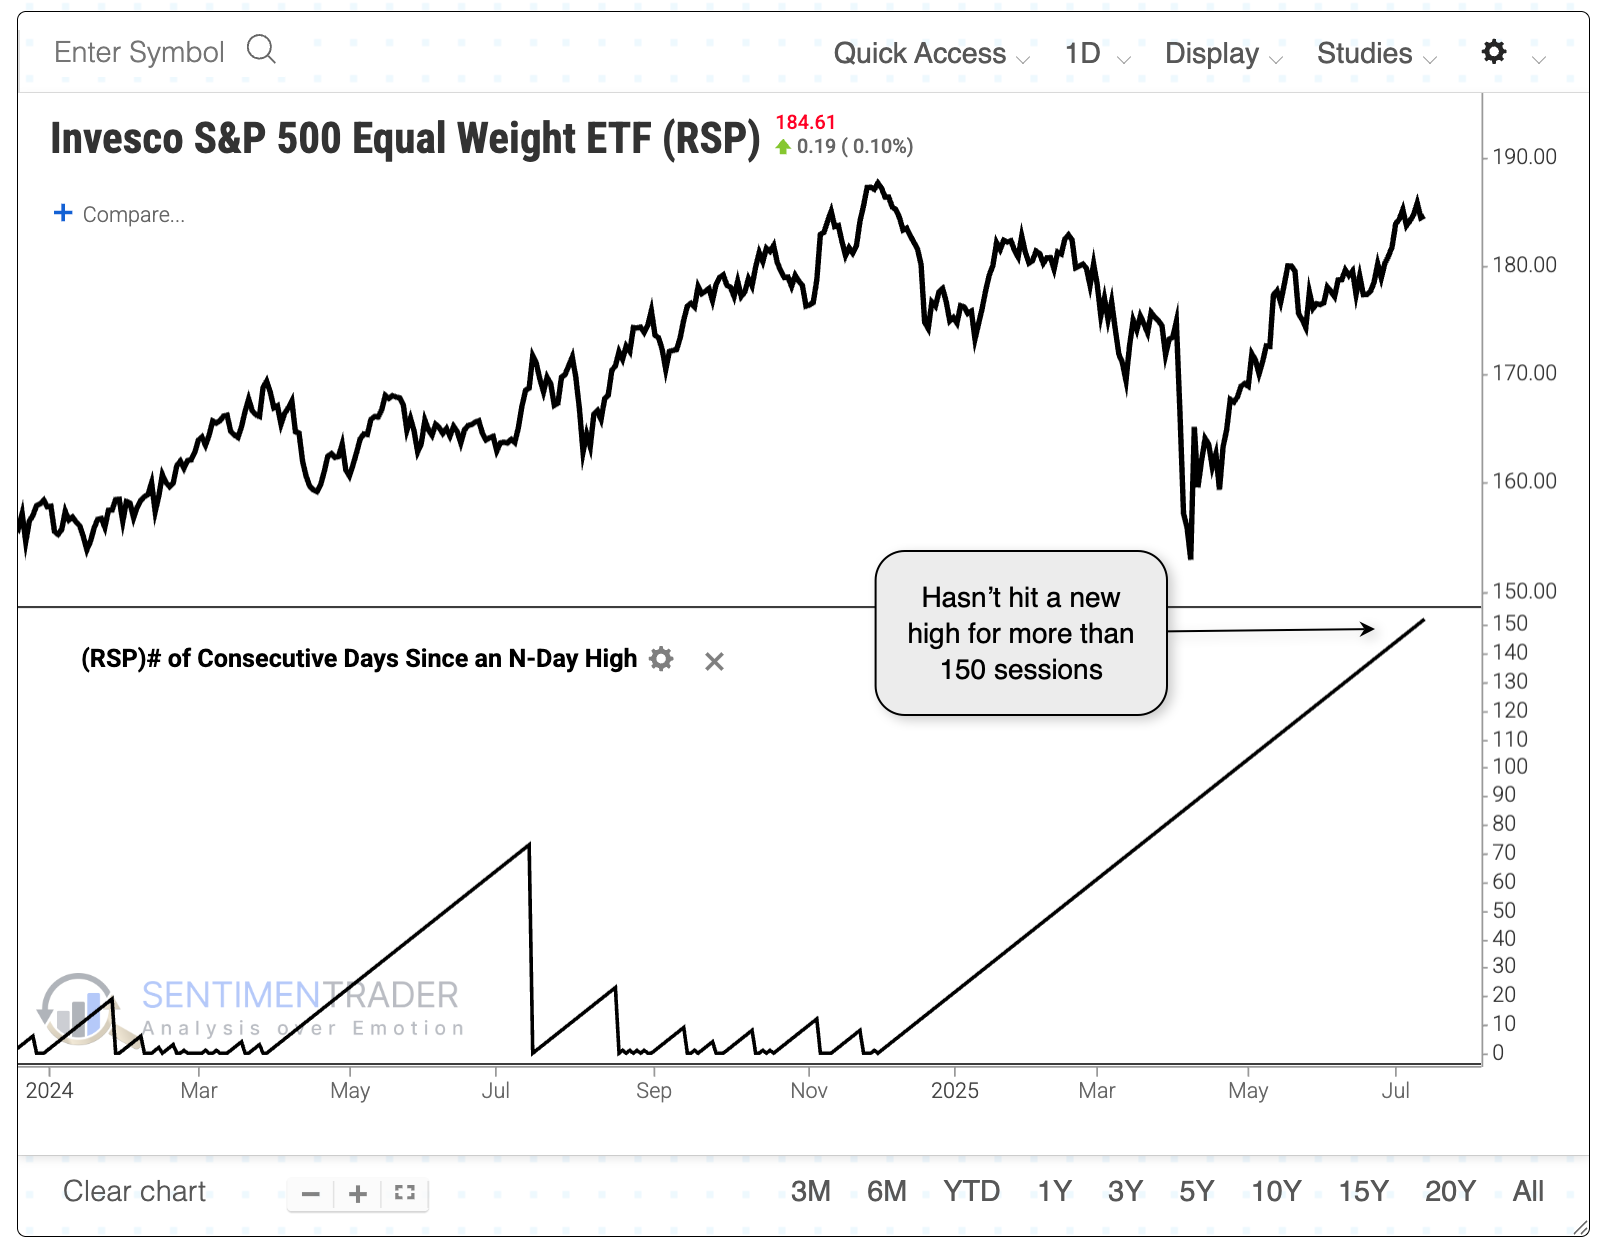
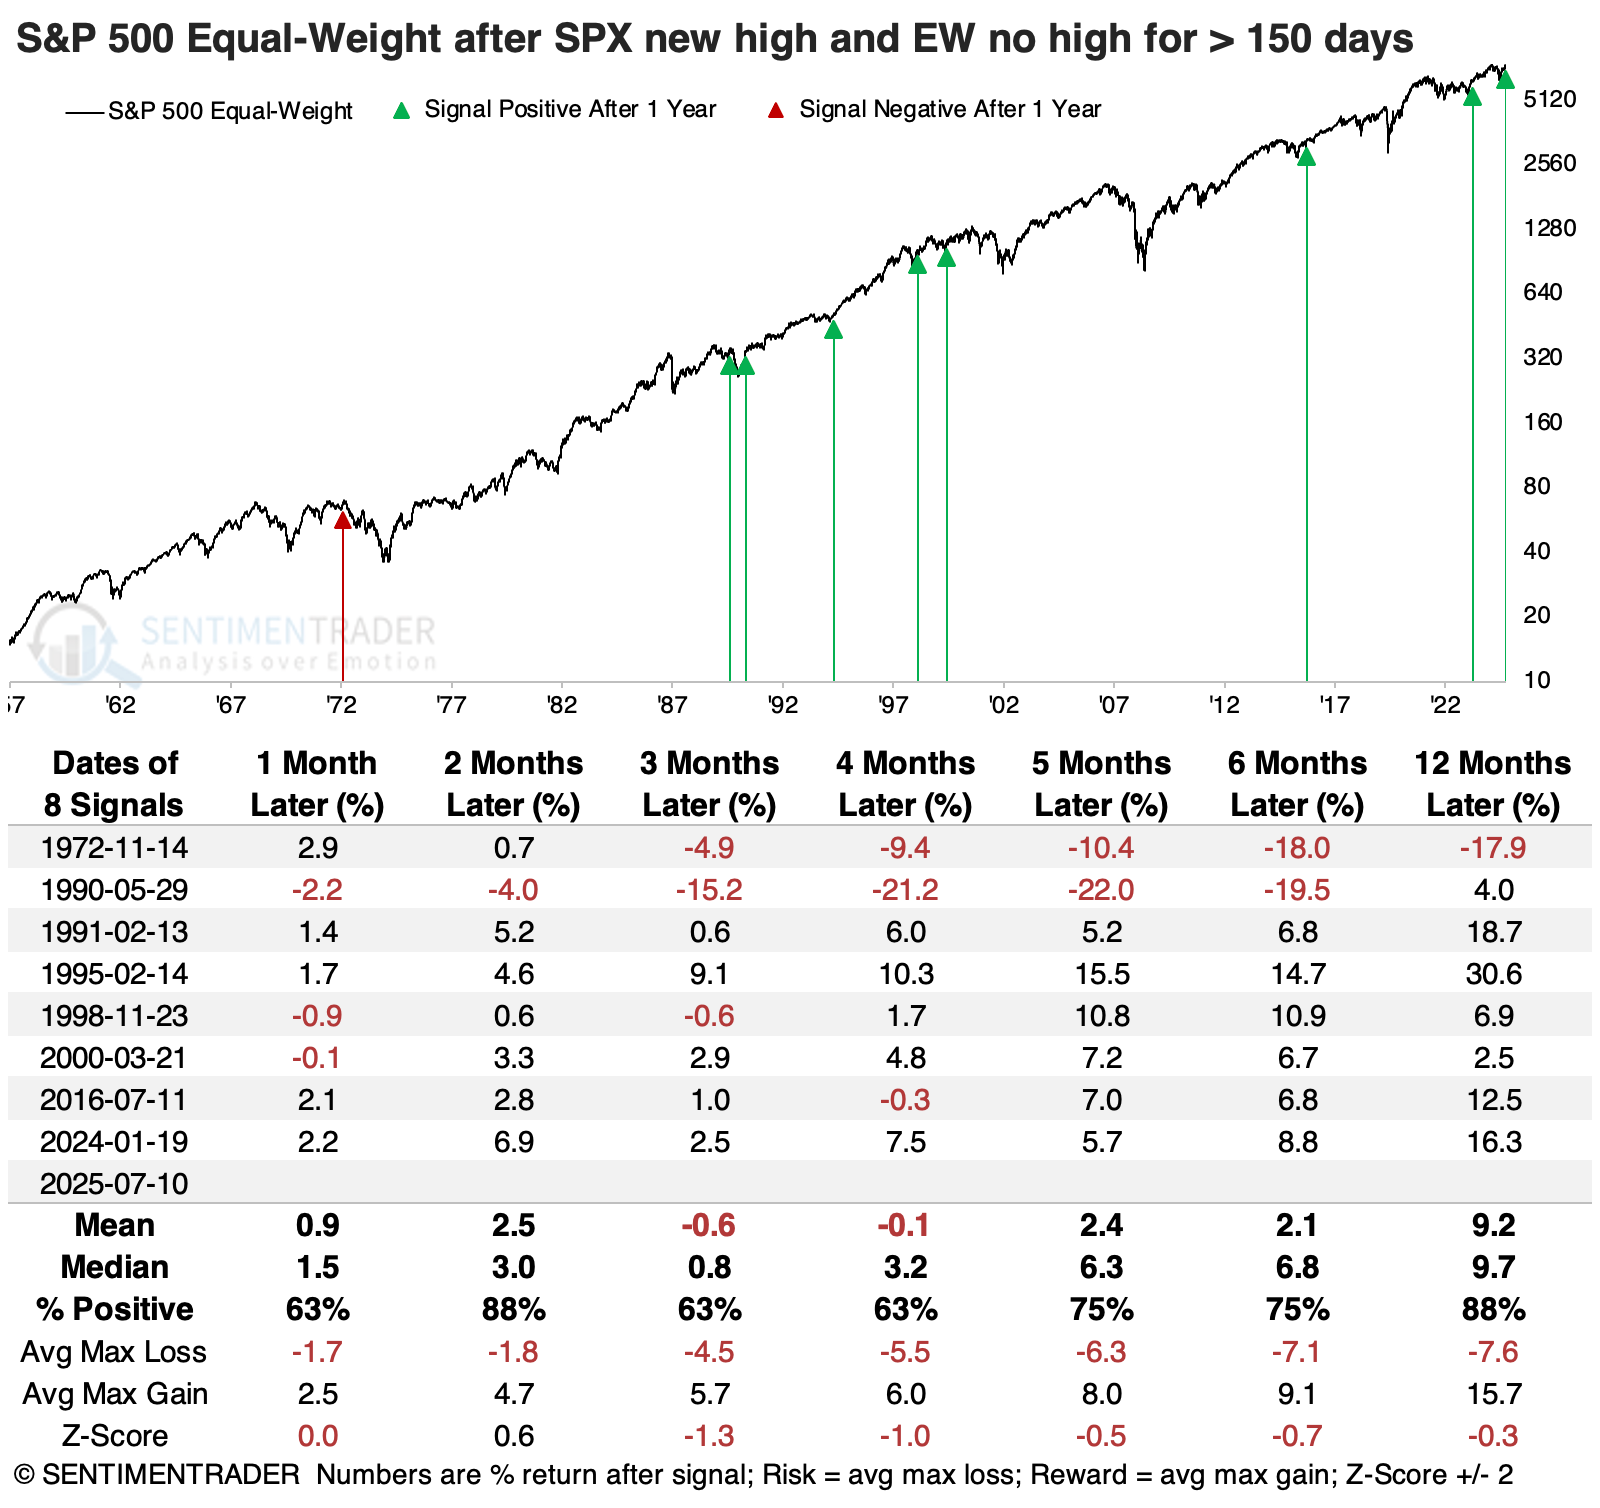
- The equal-weighted version of the S&P 500 hasn't made a new high for more than 150 days
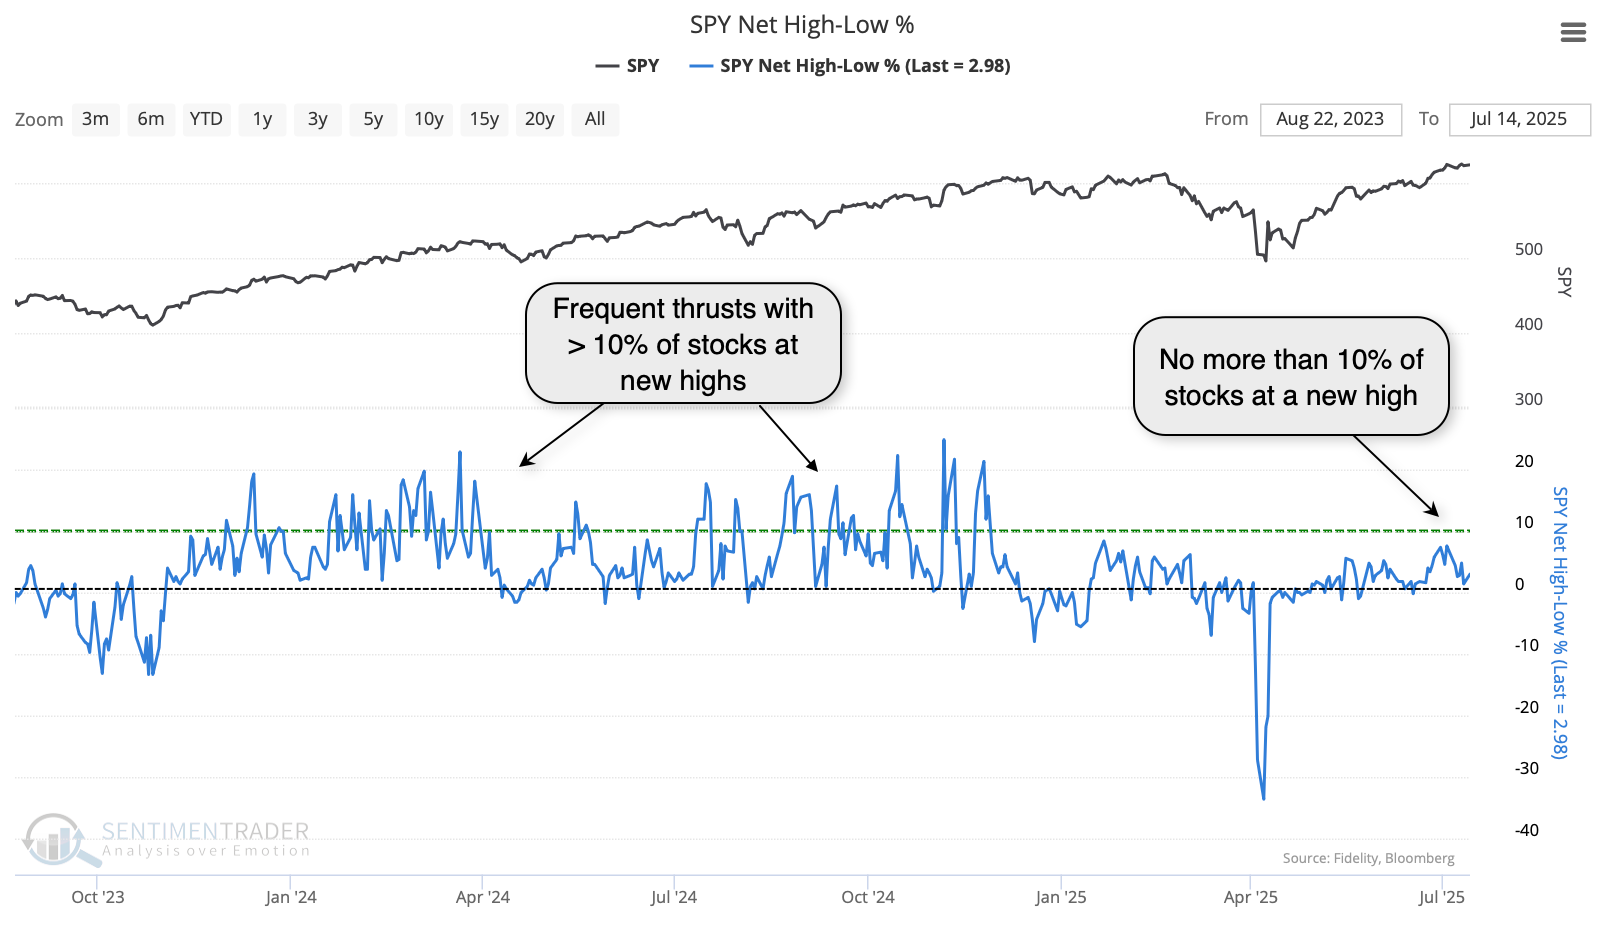
- As the capitalization-weighted version of the index makes new highs, relatively few stocks are also hitting highs
- Similar conditions existed prior to drawdowns in 1990 and 2000, while all other signals preceded gains
The average stock still hasn't made a new high
We saw earlier this week that while the breadth of the market has been okay as indices like the S&P 500 reach record highs, it's not exemplary.
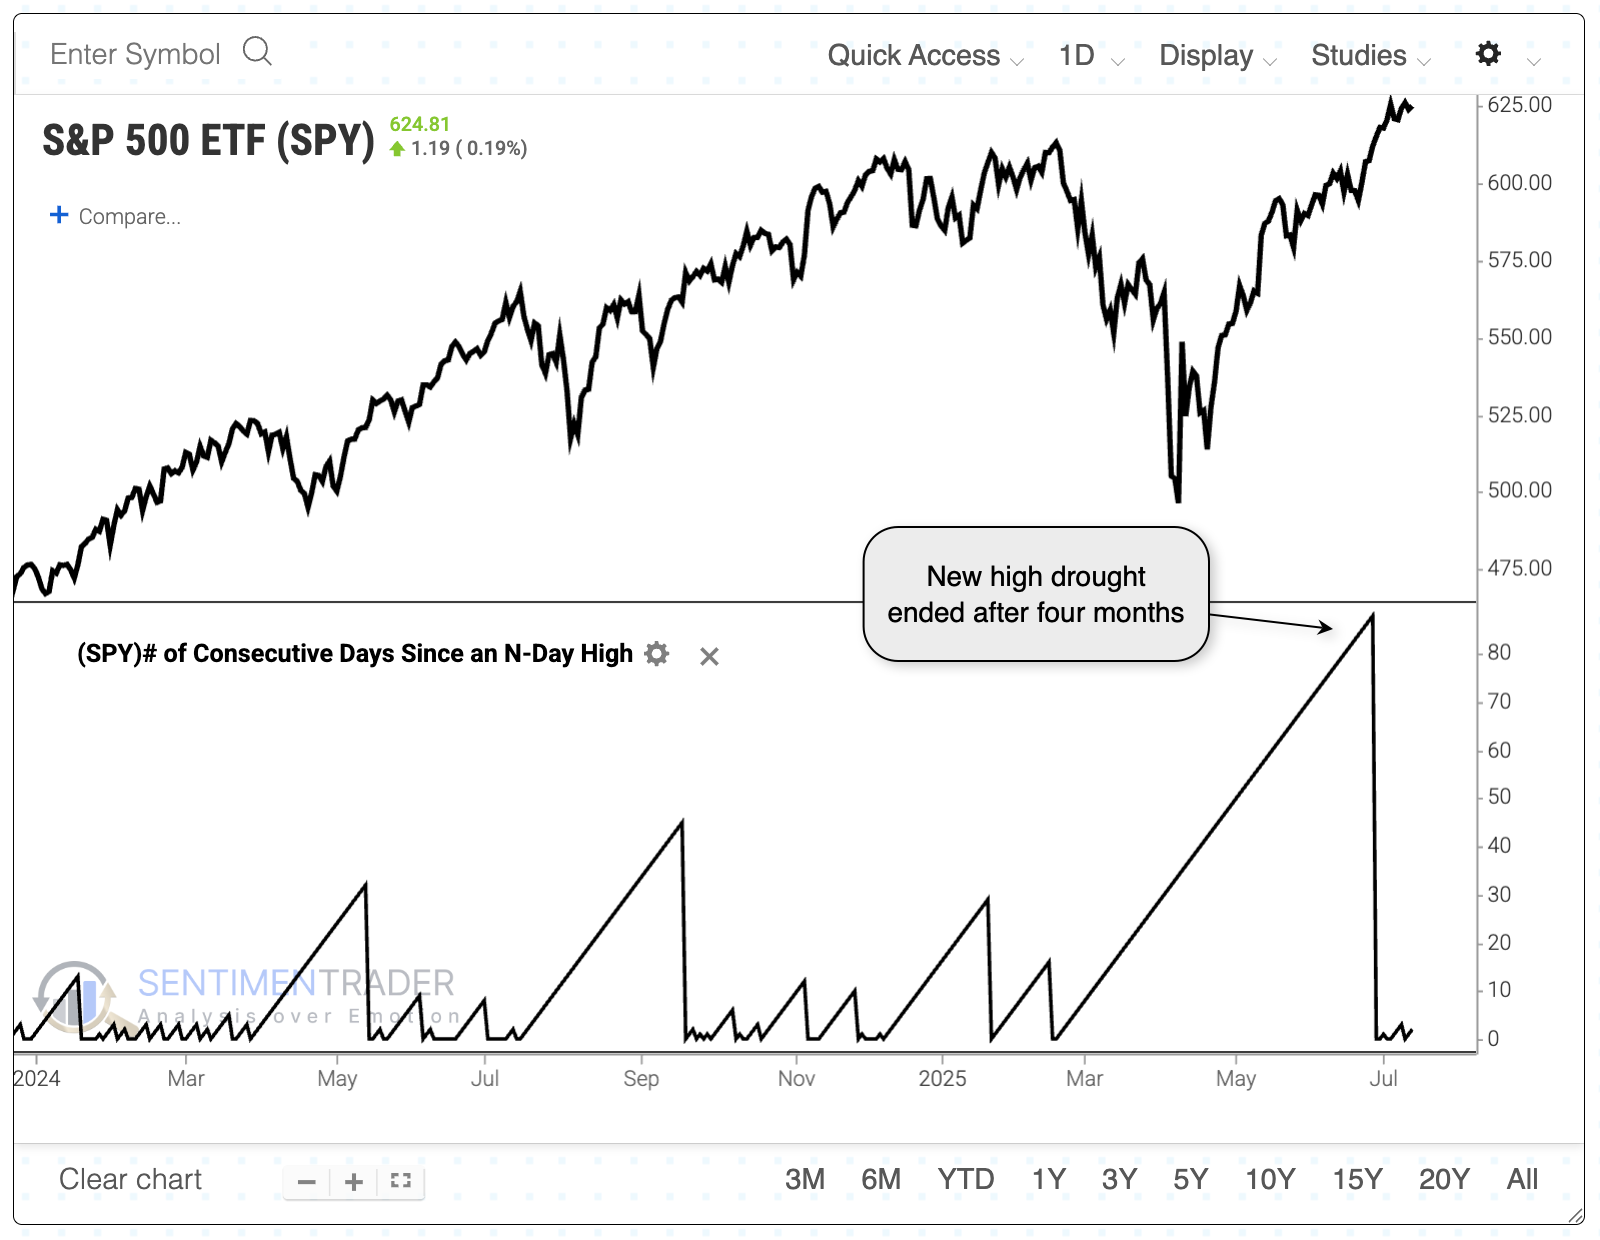
That has been evident for anyone betting on the average stock in the index. The S&P 500, which virtually everyone follows, is weighted by market capitalization. When it reached a record high in June, it ended a streak of around four months since its last record.
The version of the index that weights every stock the same is still waiting. It's been over 150 days since it closed at a new high.
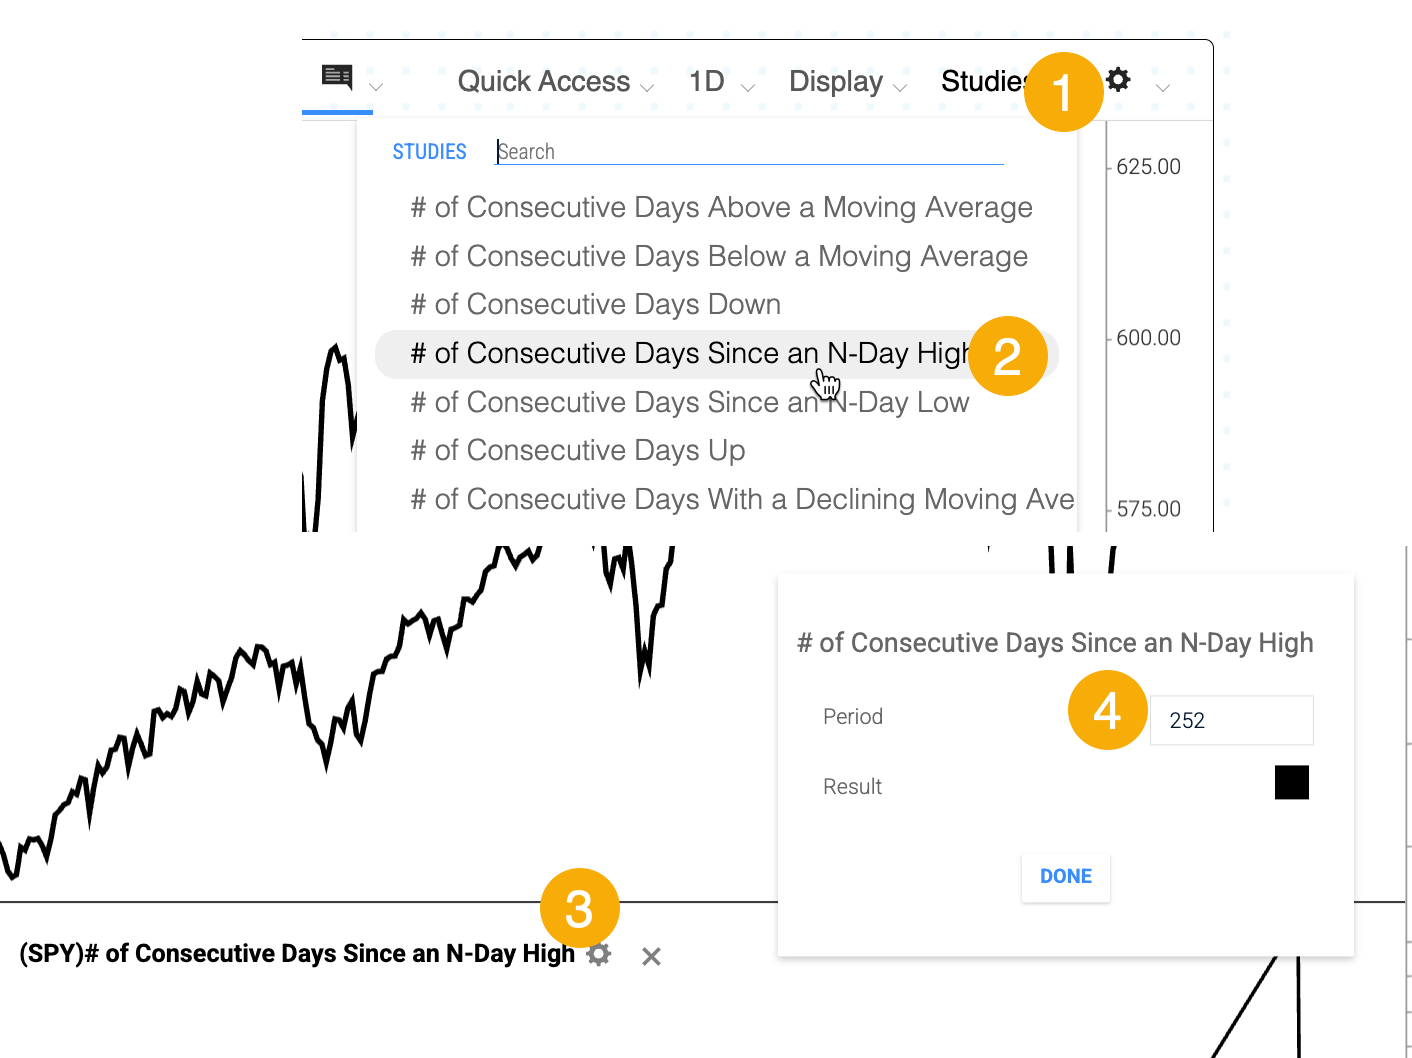
To view or test this indicator with any instrument in the database, go to Backtest Edge and:
- Click "Studies"
- Click "# of Consecutive Days Since an N-Day High"
- Click the gear icon when the indicator shows up
- Change the period if you prefer (the default is a 252-day high)
When the S&P reached a new high but the equal-weight version of the index hadn't for at least 150 days, it preceded a few significant declines for the index. Only two preceded sustained bear markets (in 1972 and 2000), while the others were temporary and soon led to even more new highs. Five of the eight saw the S&P rally by double digits over the following year.
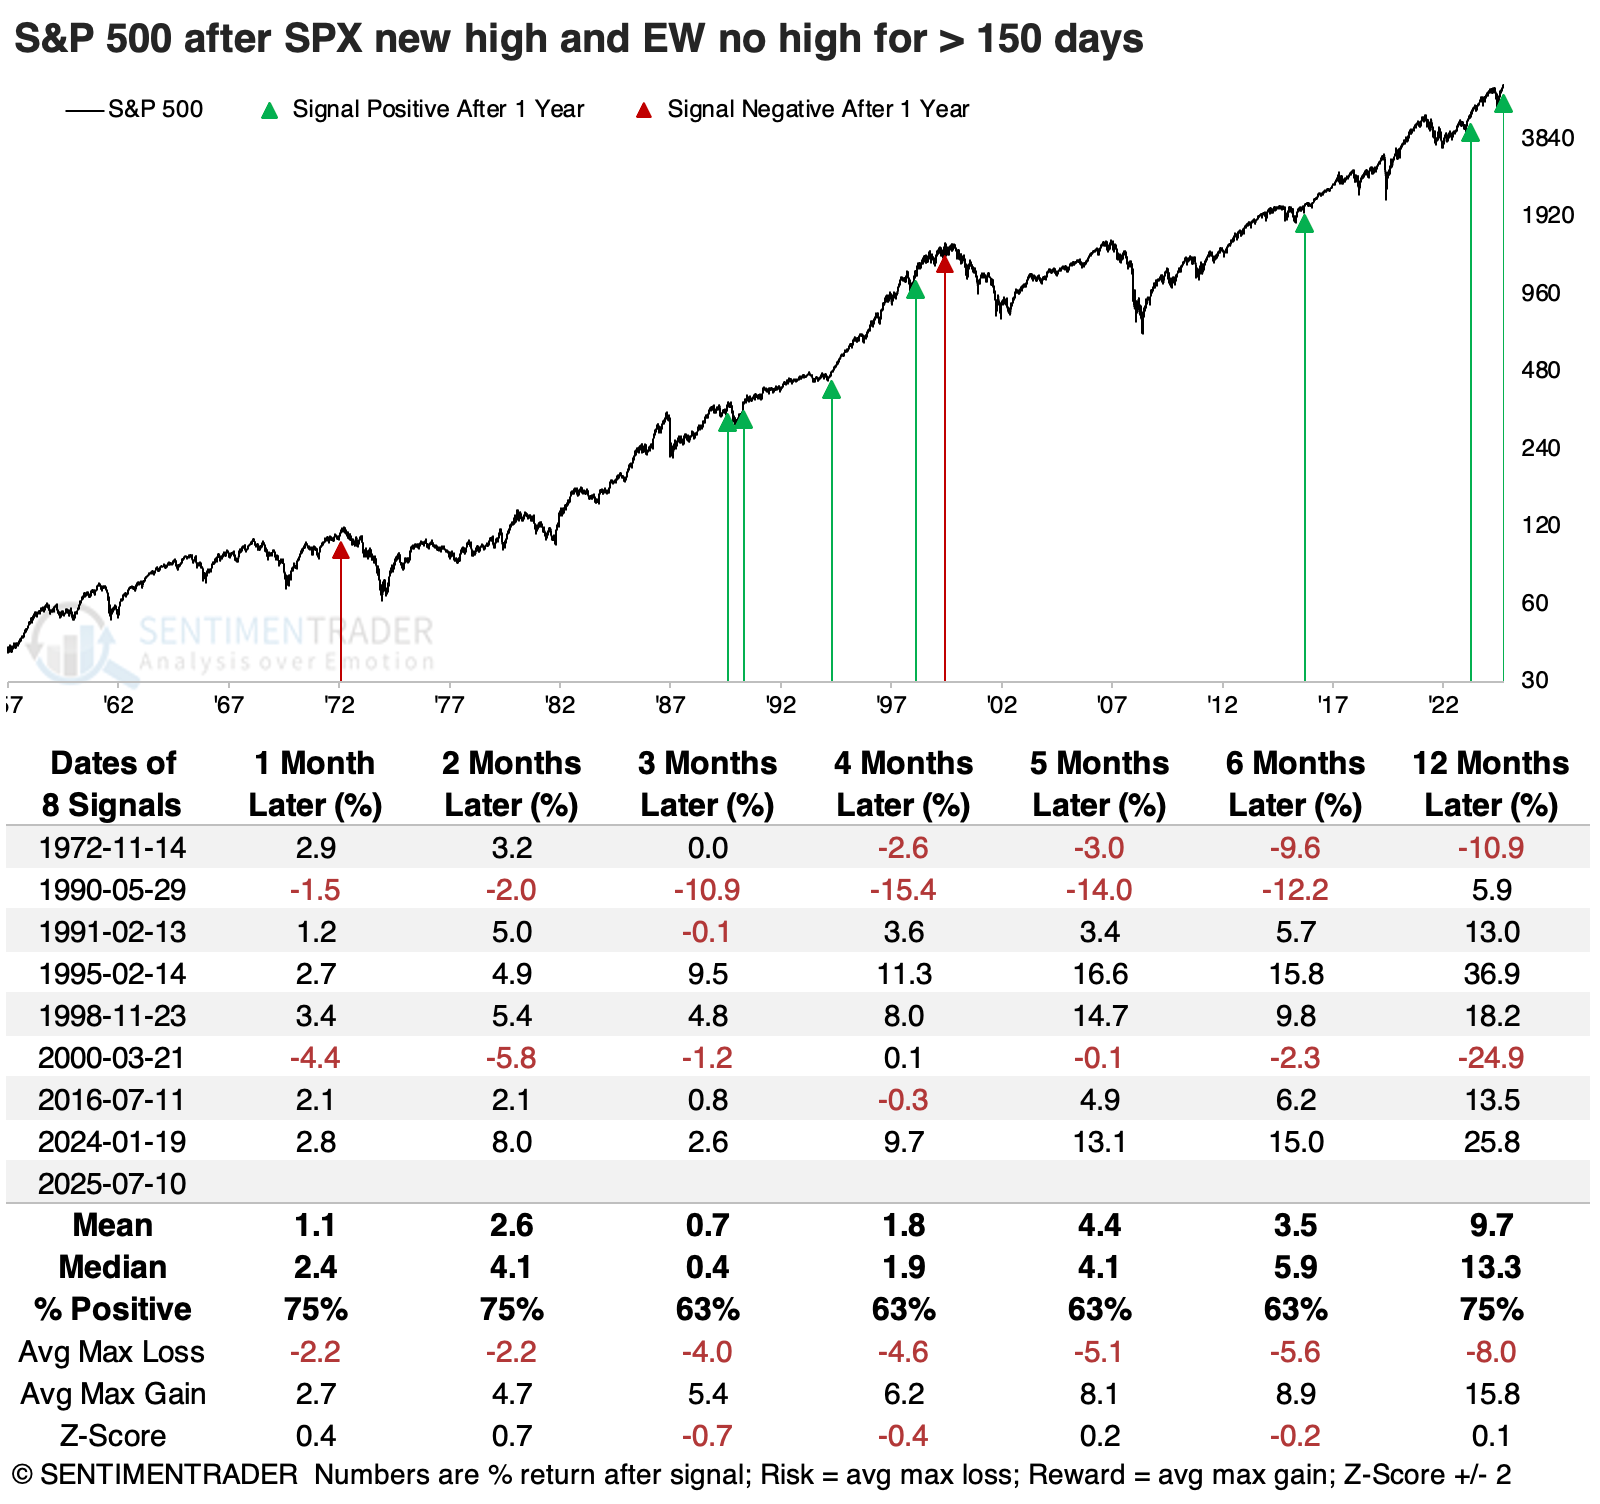
The equal-weight version of the S&P took bigger hits during the 1972 and 1990 declines, but its declines were moderated outside of those two. That was especially the case in 2000, when this version of the S&P held up much better than the cap-weighted version with a gain of +2.5% compared to a loss of -24.9% for the cap-weighted version. Over the past 30 years, each of these conditions preceded rallies.
Relatively few new highs
We can also see the mediocre participation from the relative paucity of new highs among S&P 500 stocks. No more than 10% of stocks have reached a new high throughout the latest breakout. That's far below the prior bull move when it was a regular occurrence.
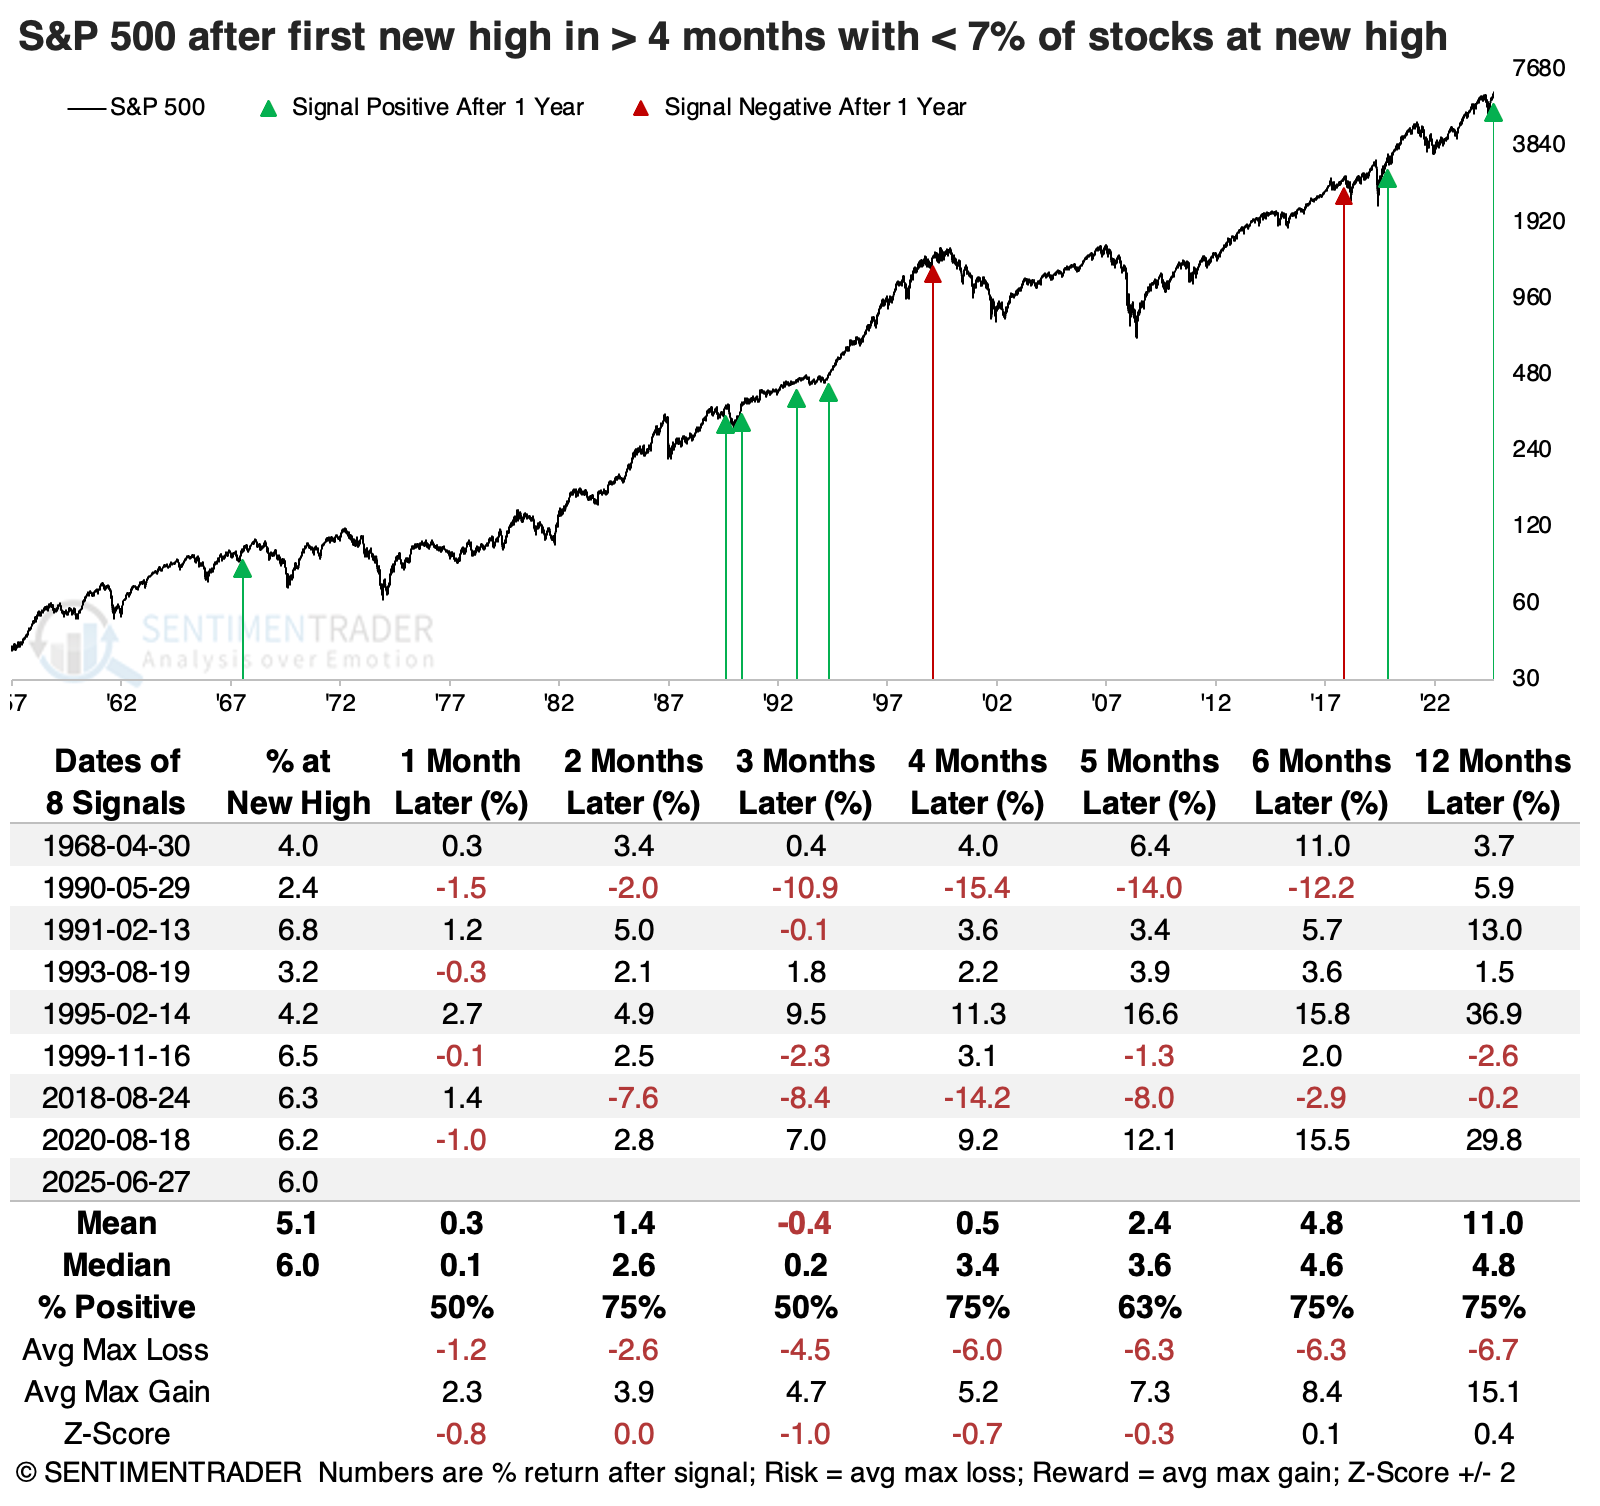
When the S&P 500 reached a new high for the first time in at least four months, but with fewer than 7% of its stocks also hitting new highs, it preceded some rocky markets. Not surprisingly, the 1999-2000 period shows up again, as did 1990.
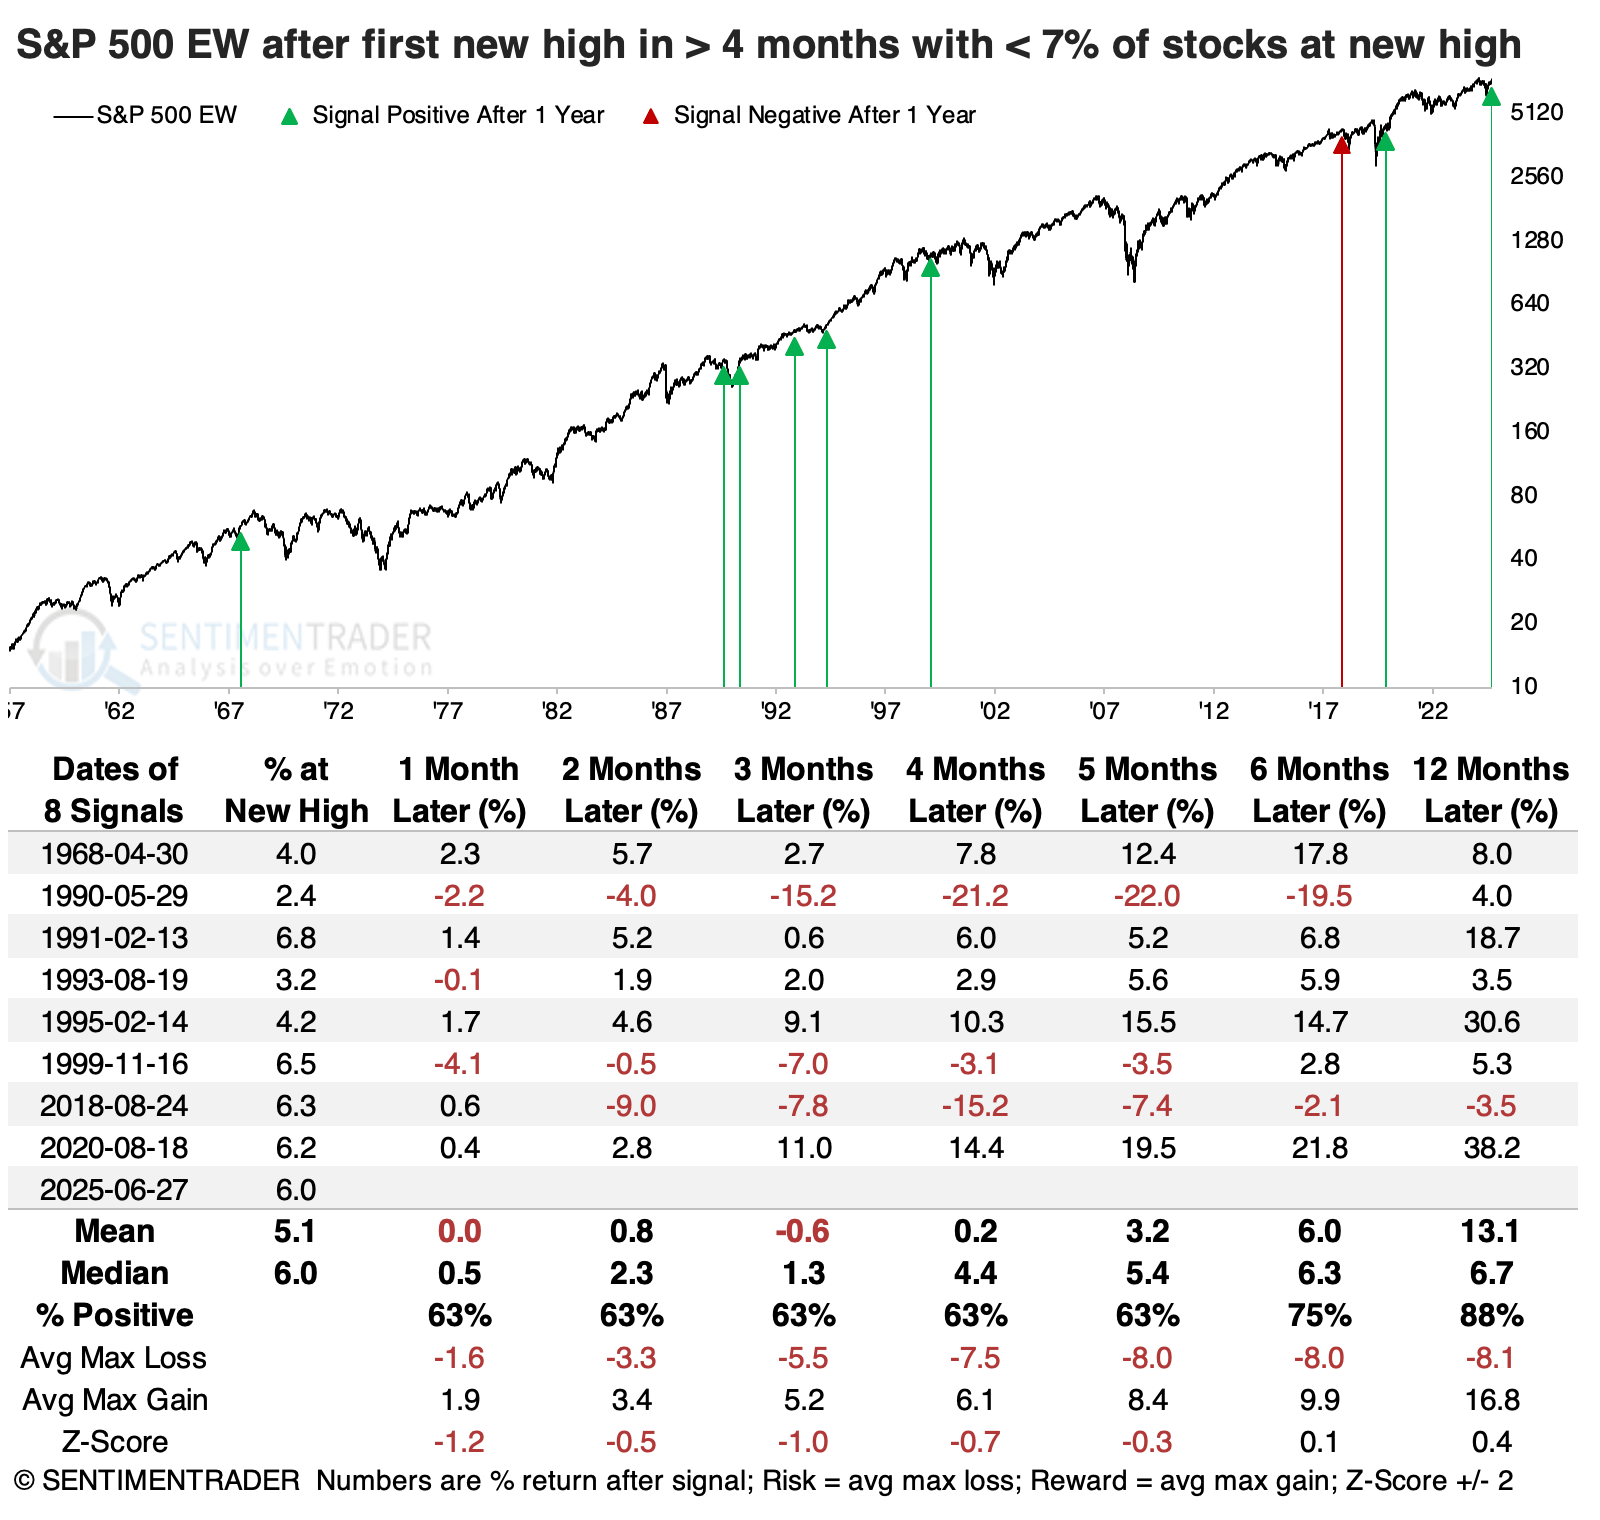
The equal-weight version of the index showed slightly more consistent gains, though that's hard to argue given the small sample size. A year later, it suffered only a single, slight loss.
What the research tells us...
An important question is whether the "right" stocks are leading the latest (and continued) breakout in the S&P 500. It's the most benchmarked equity index in the world, and getting it mostly right takes a lot of work out of the importance of stock and sector selection. And for the most part, the stocks leading the breakout have been good ones.
As always, there are some laggards. But just because the laggards may be theoretically concerning doesn't make them valid in practice, as we saw on Monday. The average stock also hasn't been quite so strong, but that hasn't been too much of a worry. Similar conditions existed before troubling declines in 1990 and 2000, but other than that, it wasn't enough of a concern to suggest reducing exposure.