Products
SentimenTrader Trading Tools
‍
Backtest Engine
My Trading Toolkit
Correlation Analysis
Seasonality
Market Prediction
Indicators & Data API
‍
Proprietary Indicators & Charts
Market Data API
Strategies & Scanner
‍
50+ Trading Strategies
Smart Stock Scanner
Smart Option Scanner
Research Reports
‍
Research Solutions
Reports Library
Free Resources
Simple Backtest Calculator
Simple Seasonality Calculator
The Kelly Criterion Calculator
Sentiment Geo Map
Public Research Reports
Education
Sentiment Indicators
Technical Indicators
Pricing
Company
About
In the News
Testimonials
Client Success Stories
Contact
Log inLoginSign up
< BACK TO ALL REPORTS

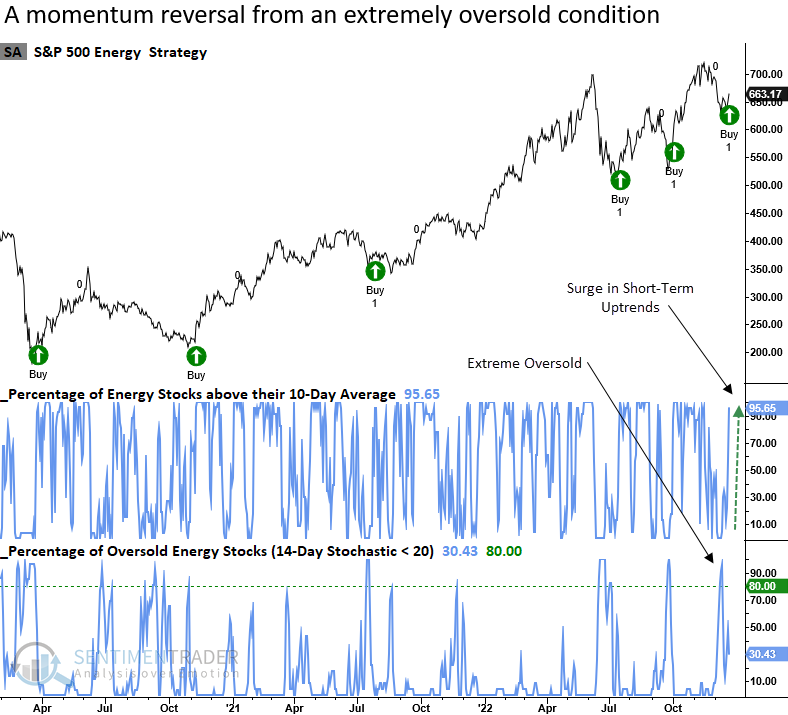
Energy stocks reverse higher after a historic oversold condition

Dean Christians
2022-12-22
Energy stocks reversed from a historic oversold condition, triggering a buy signal for the sector. After similar reversals, the energy sector was higher 79% of the time one month later.

Key points:

  • The percentage of energy stocks above their 10-day average exceeded 95%
  • The surge in uptrends occurred after 95% of energy stocks reached an oversold level
  • After similar conditions, the energy sector was higher 79% of the time one month later
  • When most energy stocks are in long-term uptrends, the outlook is even better

Energy stocks are surging from a historic oversold condition

If you like trading high-volatility stocks, the energy sector is ripe with opportunity. Last week, I published a note highlighting the extreme oversold condition in energy stocks. The slide in the energy group didn't last long, as more than 95% of the members within the sector recaptured their 10-day average. 

Let's assess the outlook for the energy sector when more than 95% of energy stocks exceed their 10-day average in ten days or fewer of an oversold condition. The oversold condition occurs when more than 80% of energy sector members register a 14-day stochastic oscillator reading of less than 20%. 

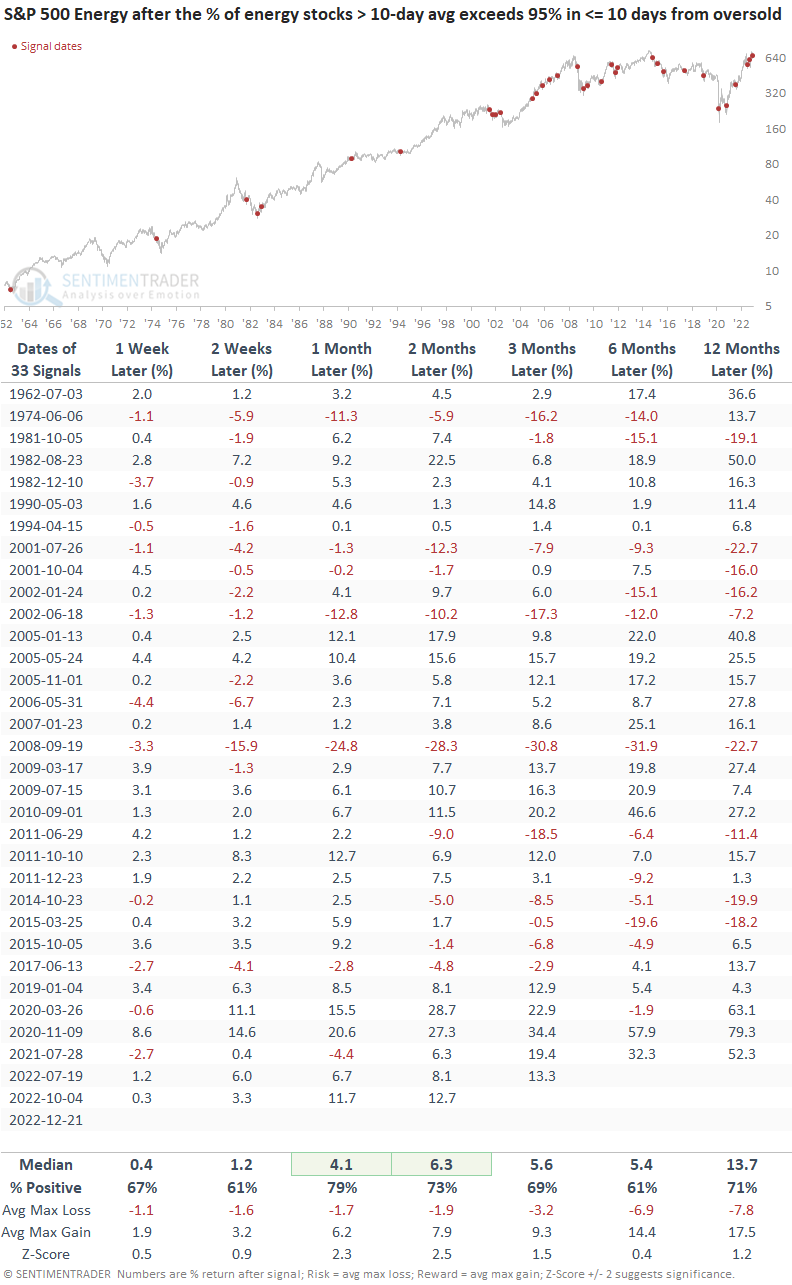
Similar oversold to overbought reversals preceded bullish results

When the percentage of S&P 500 energy stocks above their 10-day average exceeds 95% in 10 days or fewer of an oversold condition, the sector tends to rally, especially one month later. The signal was positive two months later in 28 out of 33 cases. Noteworthy drawdowns all occurred during significant bear market periods. 

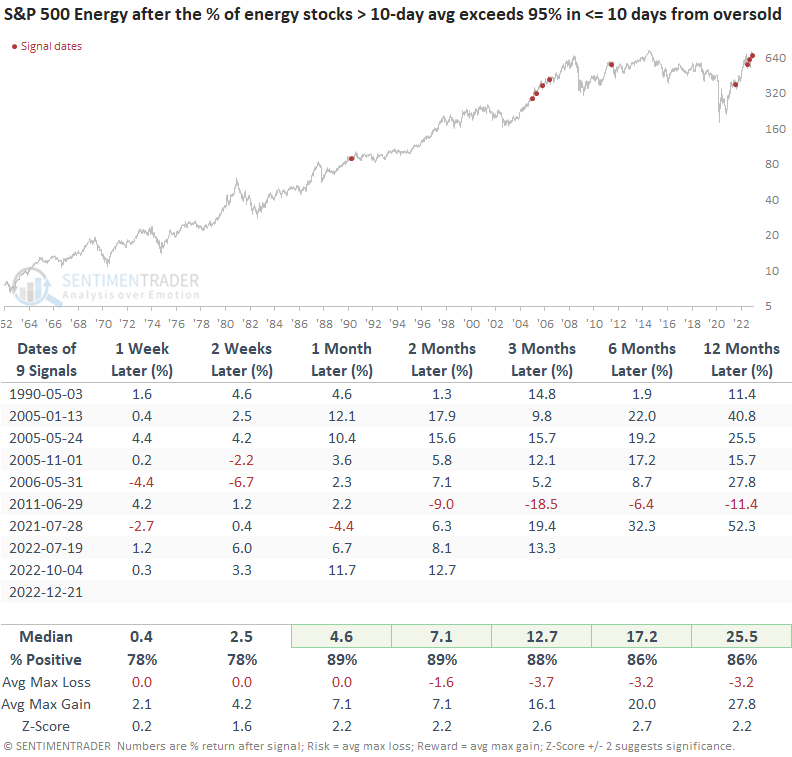
Suppose I include a condition to the original study that requires more than 75% of energy sector members to have a rising 200-day average. In that case, a surge in short-term uptrends from an oversold condition bodes well for energy stocks. The signal in 2011 is the exception, not the norm.

What the research tells us...

Whether a short-term trader or a long-term buy-and-hold investor, the energy sector has been the place to be this year. Typically, buy-the-dip strategies struggle in bear markets, but that's not the case for energy. The industry provided several alpha-adding opportunities this year. And we just got one more. When the percentage of S&P 500 energy stocks above their 10-day average exceeds 95% in 10 days or fewer of an oversold condition, sector performance is impressive, especially one month later.

PRODUCTS
SentimenTrader
Trading Tools
Indicators & Data API
‍
Strategies & Scanner
‍
Research Reports
FREE
RESOUrCES
Simple Backtest
Calculator
Simple Seasonality
Calculator
The Kelly Criterion
Calculator
Sentiment Geo Map
‍
Public Research Reports
‍
Education
Sentiment Indicators
‍
Technical Indicators
‍
Pricing
Bundle pricing
‍
FAQ
‍
Announcements
‍
COMPANY
‍
About
‍
In the News
‍
Testimonials
‍
Client Success Stories
CONTACT
‍
General Inquiries
‍
Media Inquiries
‍
Financial Professionals Inquiries
‍
© 2026 Sundial Capital Research Inc. All rights reserved.
Setsail Marketing
TermsPrivacyAffiliate Program
Risk Disclosure: The information and tools provided are for research and analytical purposes only and are not intended as investment advice. Market analysis involves uncertainty, and outcomes may differ from expectations. Users should conduct their own due diligence and consider their individual circumstances before making any financial decisions. Past performance is not necessarily indicative of future results.

Hypothetical Performance Disclosure: Hypothetical performance results have many inherent limitations, some of which are described below. No representation is being made that any account will or is likely to achieve profits or losses similar to those shown; in fact, there are frequently sharp differences between hypothetical performance results and the actual results subsequently achieved by any particular trading program. One of the limitations of hypothetical performance results is that they are generally prepared with the benefit of hindsight. In addition, hypothetical trading does not involve financial risk, and no hypothetical trading record can completely account for the impact of financial risk of actual trading. for example, the ability to withstand losses or to adhere to a particular trading program in spite of trading losses are material points which can also adversely affect actual trading results. There are numerous other factors related to the markets in general or to the implementation of any specific trading program which cannot be fully accounted for in the preparation of hypothetical performance results and all which can adversely affect trading results.

Testimonial Disclosure: Testimonials appearing on this website may not be representative of other clients or customers and is not a guarantee of future performance or success.