
Energy stock trends improve after a panic

Key points:
- Breadth in the energy sector has cycled from depressed levels to historically high levels
- The sector has had trouble sustaining further gains after similar cycles
- While there are some positives, a lack of insider interest and sketchy calendar add to the caution
Energy stocks get a sudden boost
Given geopolitics and a general increase in interest in commodities, traders have streamed back to energy contracts, and by extension, energy stocks have enjoyed a reflexive bounce.
Anyone around longer than a generation may remember a major speech from President Bush about weapons of mass destruction in the Middle East and the subsequent return on energy stocks. There are more than a few rhymes in recent days.
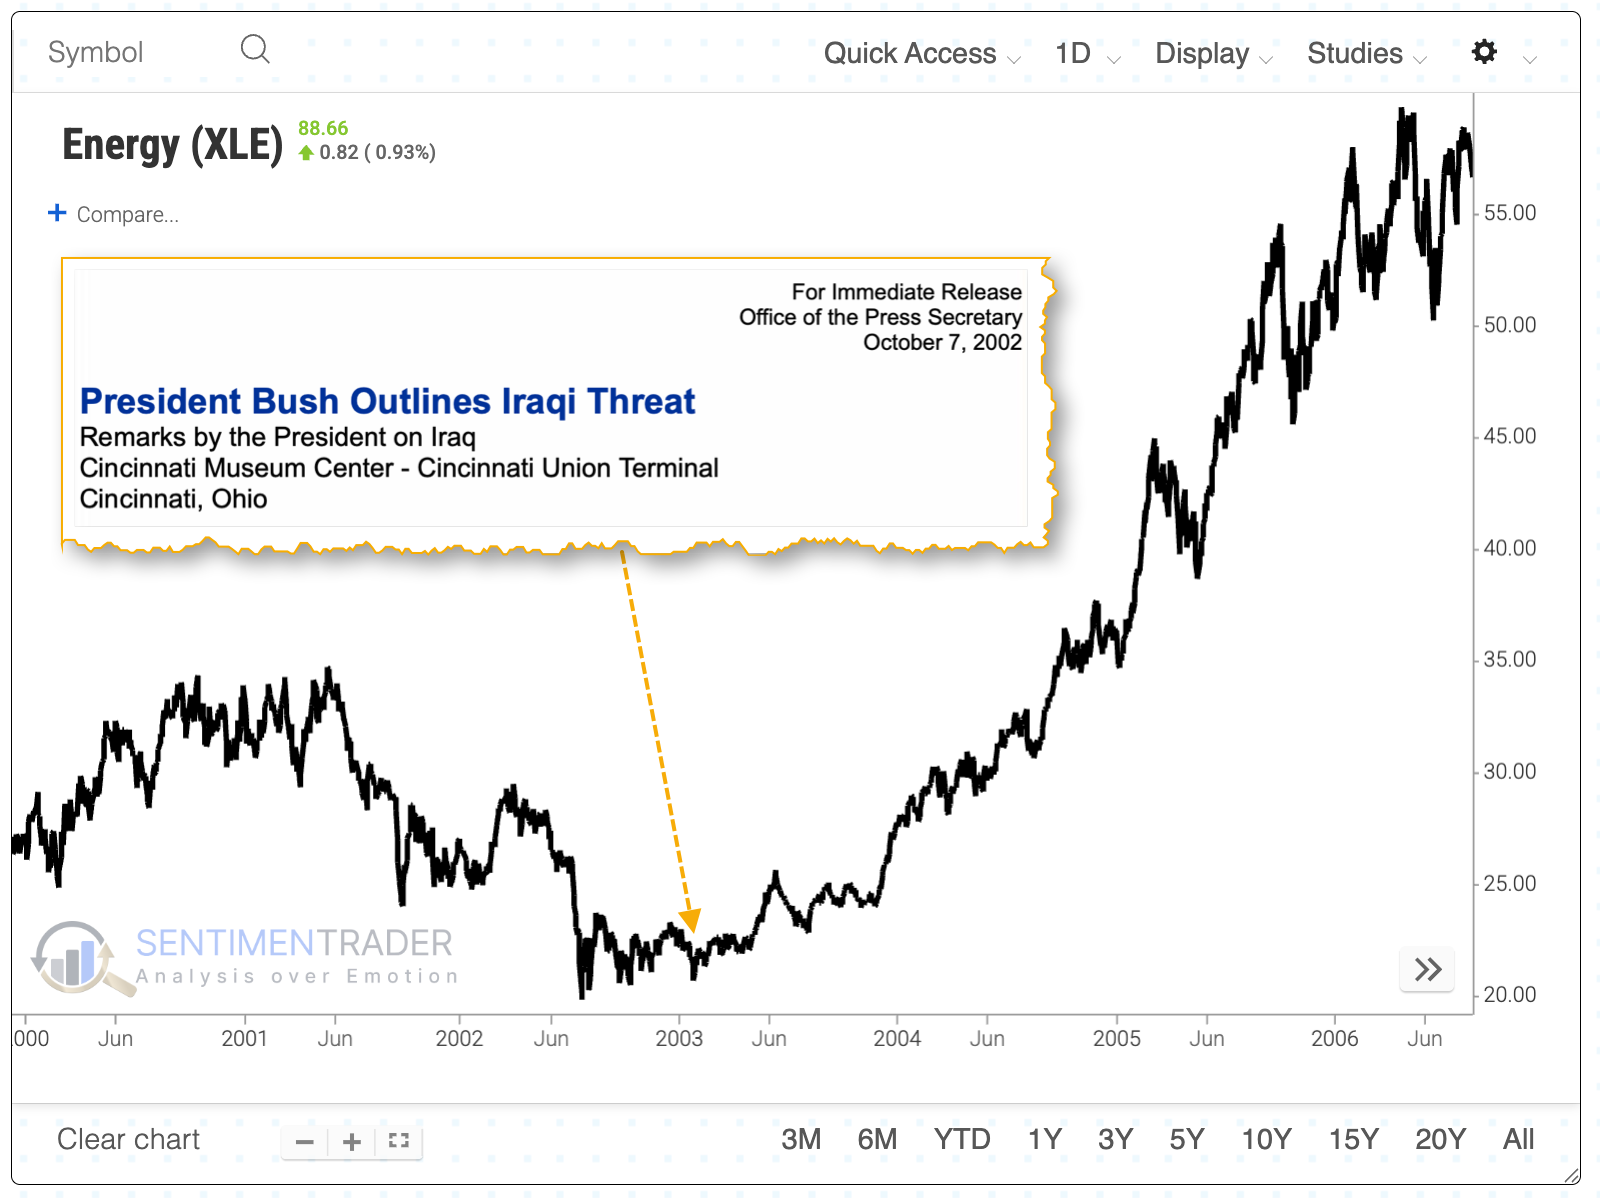
Investors appear to be anticipating a repeat.
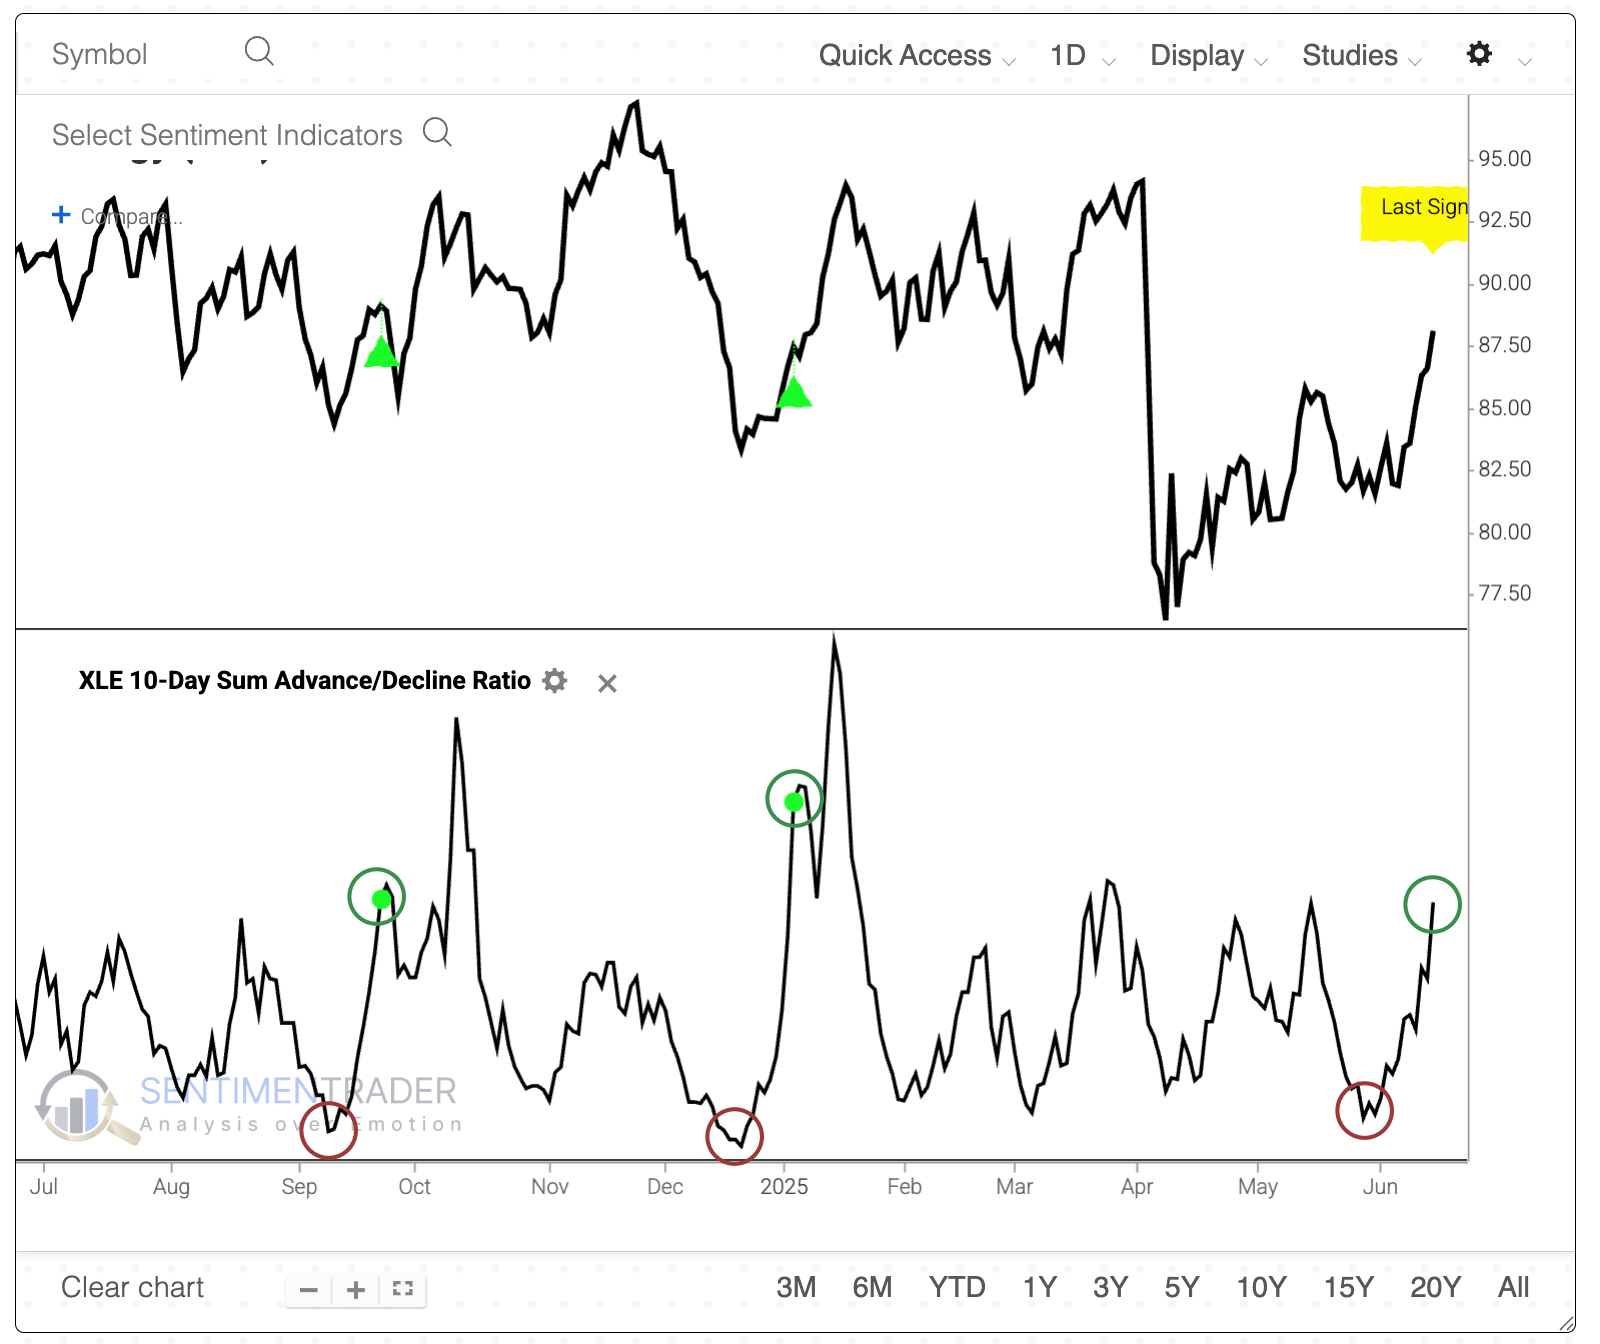
The 10-Day Advance/Decline Ratio for energy stocks has surged above 2.0 for the fourth time this year. This means that over a 10-day span, there were twice as many advancing stocks as declining stocks among those in the XLE fund. That's a stark change from when the opposite condition existed a few weeks ago.
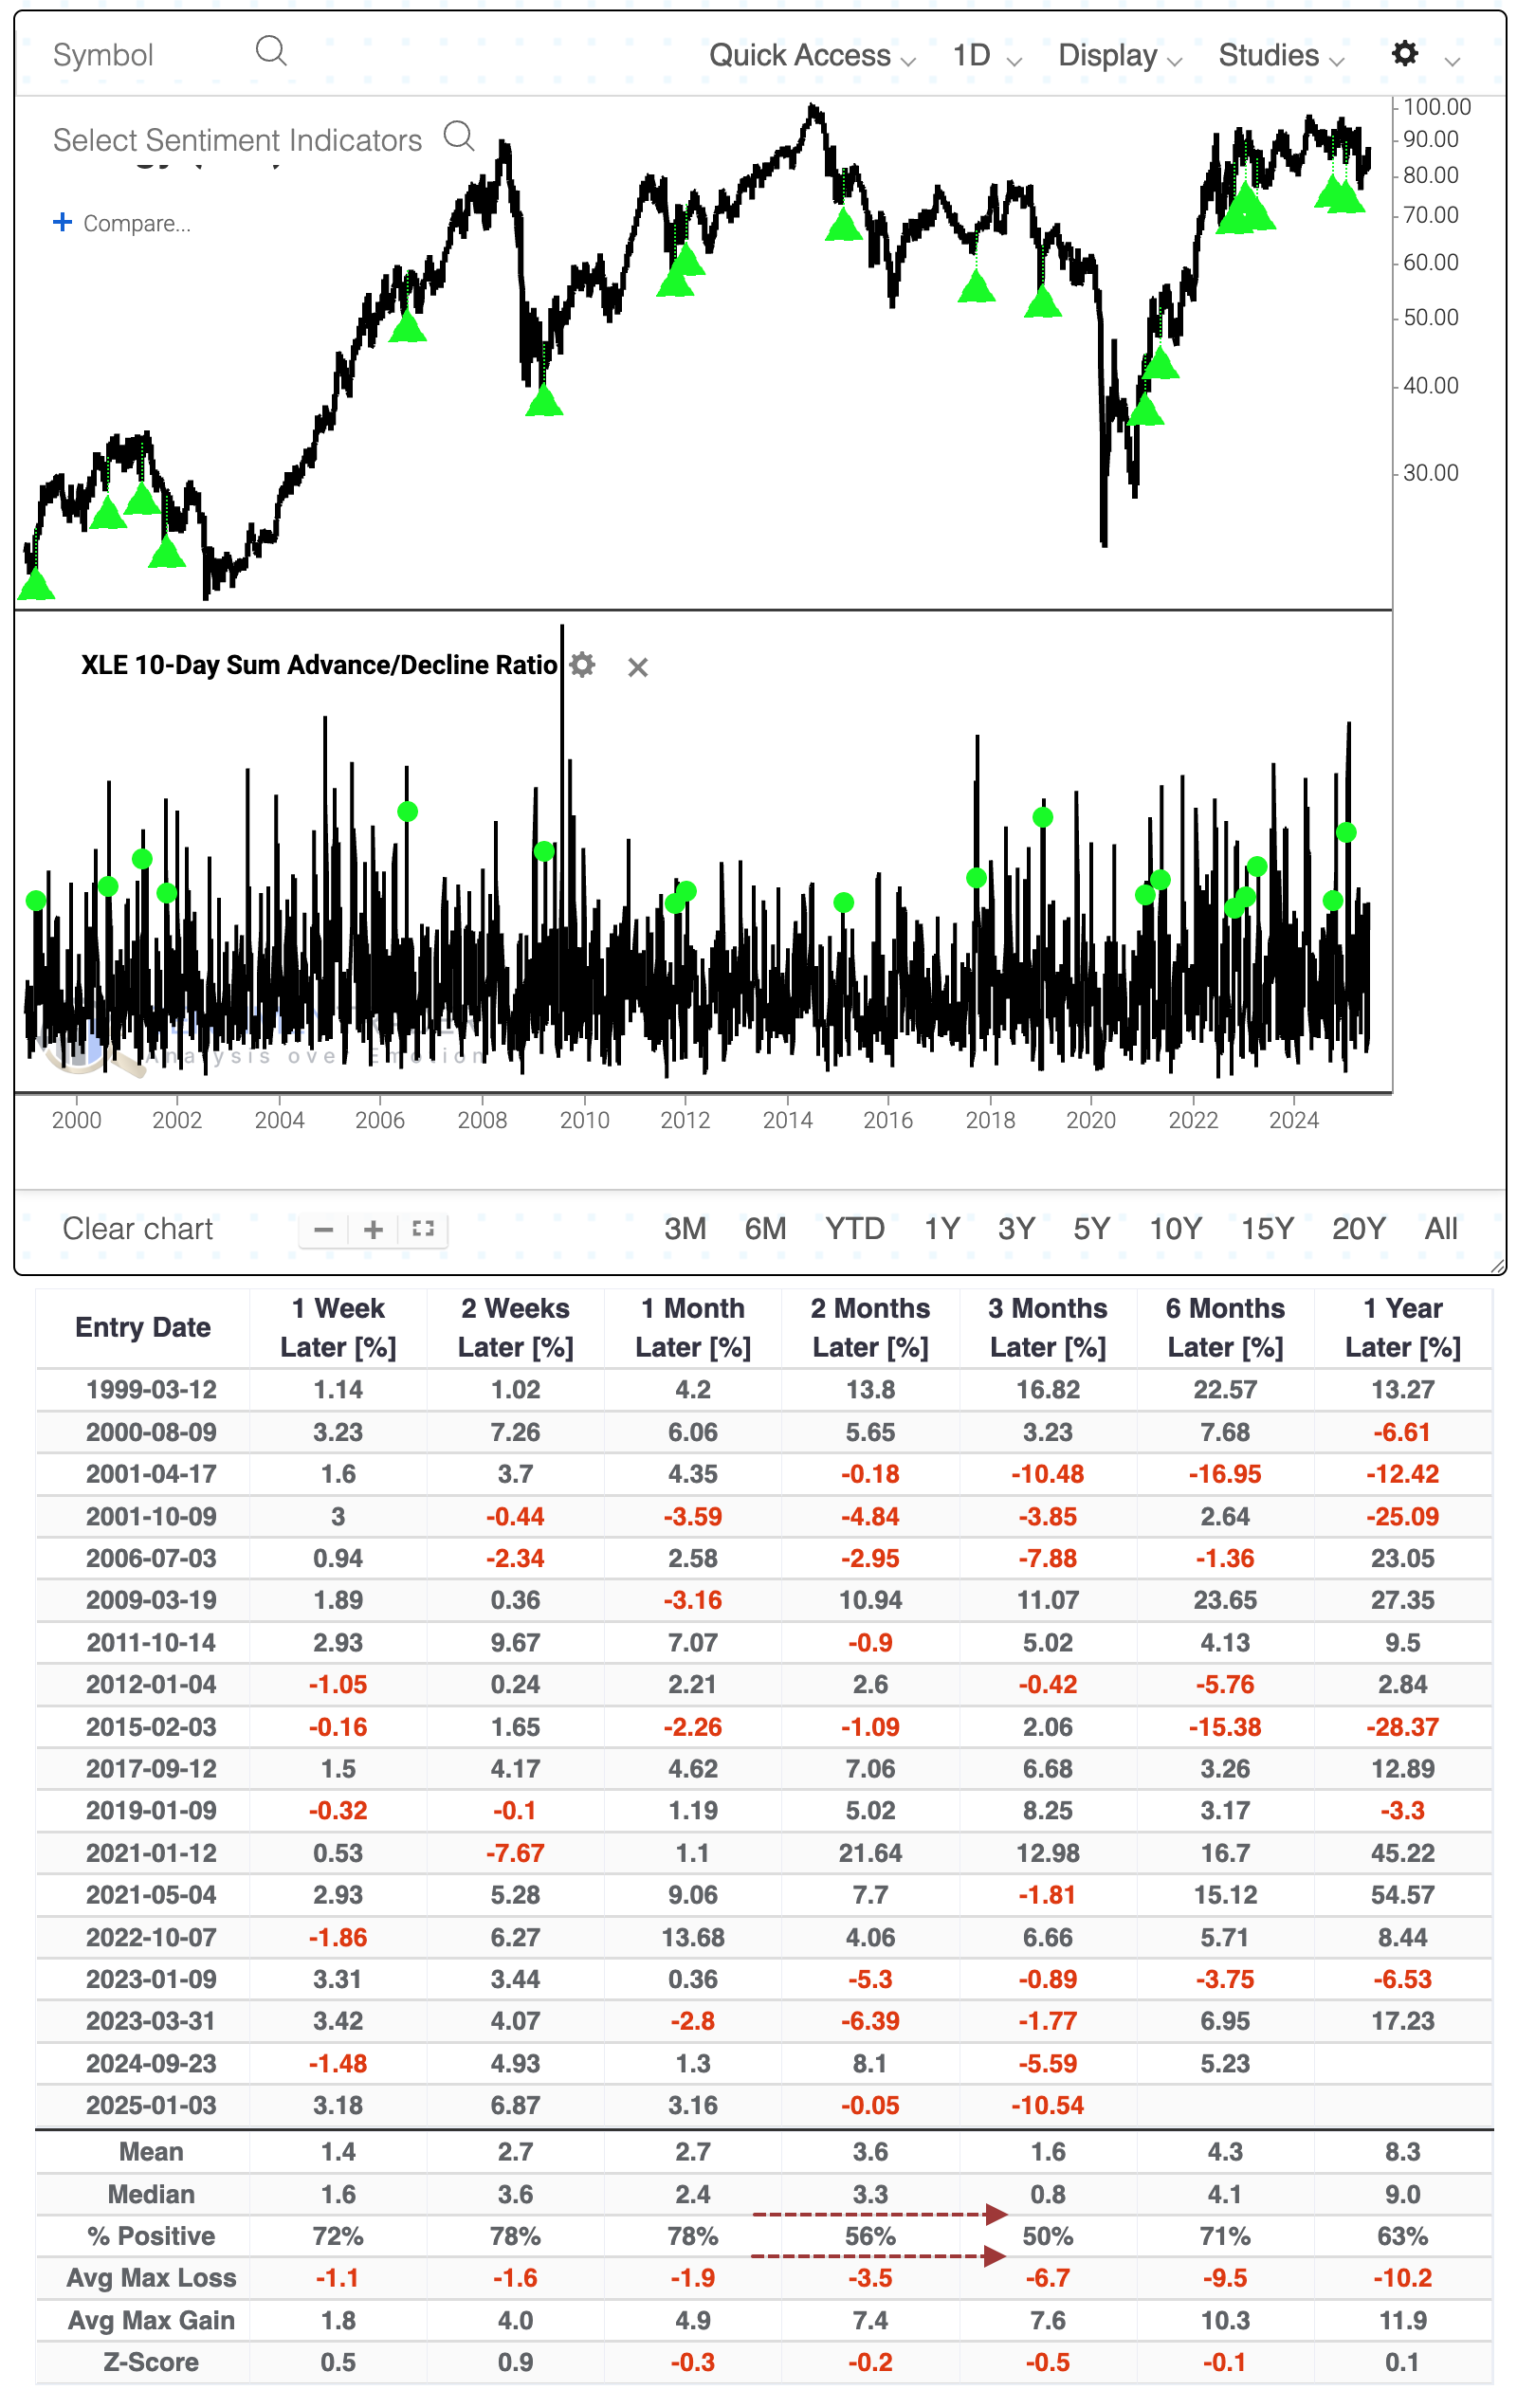
The Backtest Engine 2.0 shows how XLE performed after similar cycles. These are times when the 10-day A/D Ratio cycled from below 0.5 to above 2.0 within 15 sessions. The fund continued to rise about three-quarters of the time over the next couple of weeks, but many of those failed. There was a steady drop in the win rate over the following two to three months.
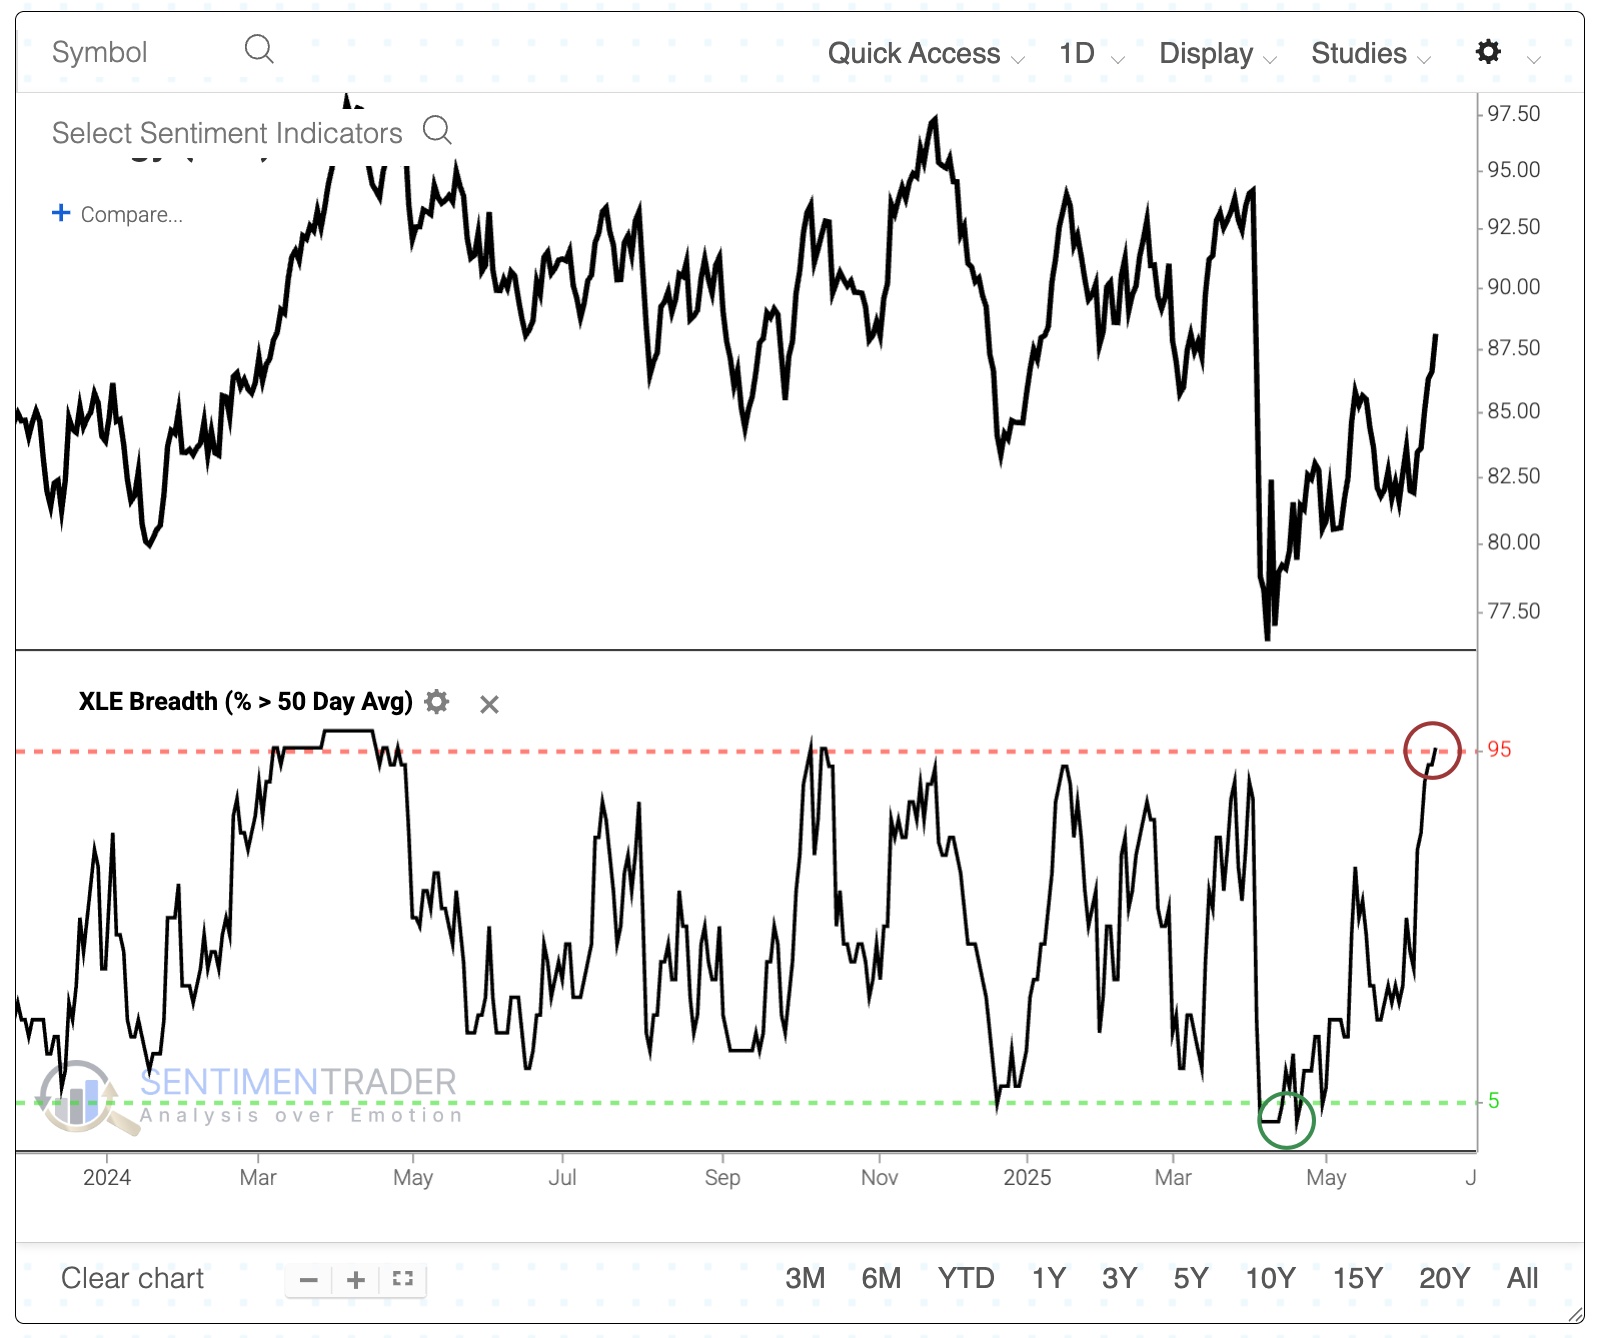
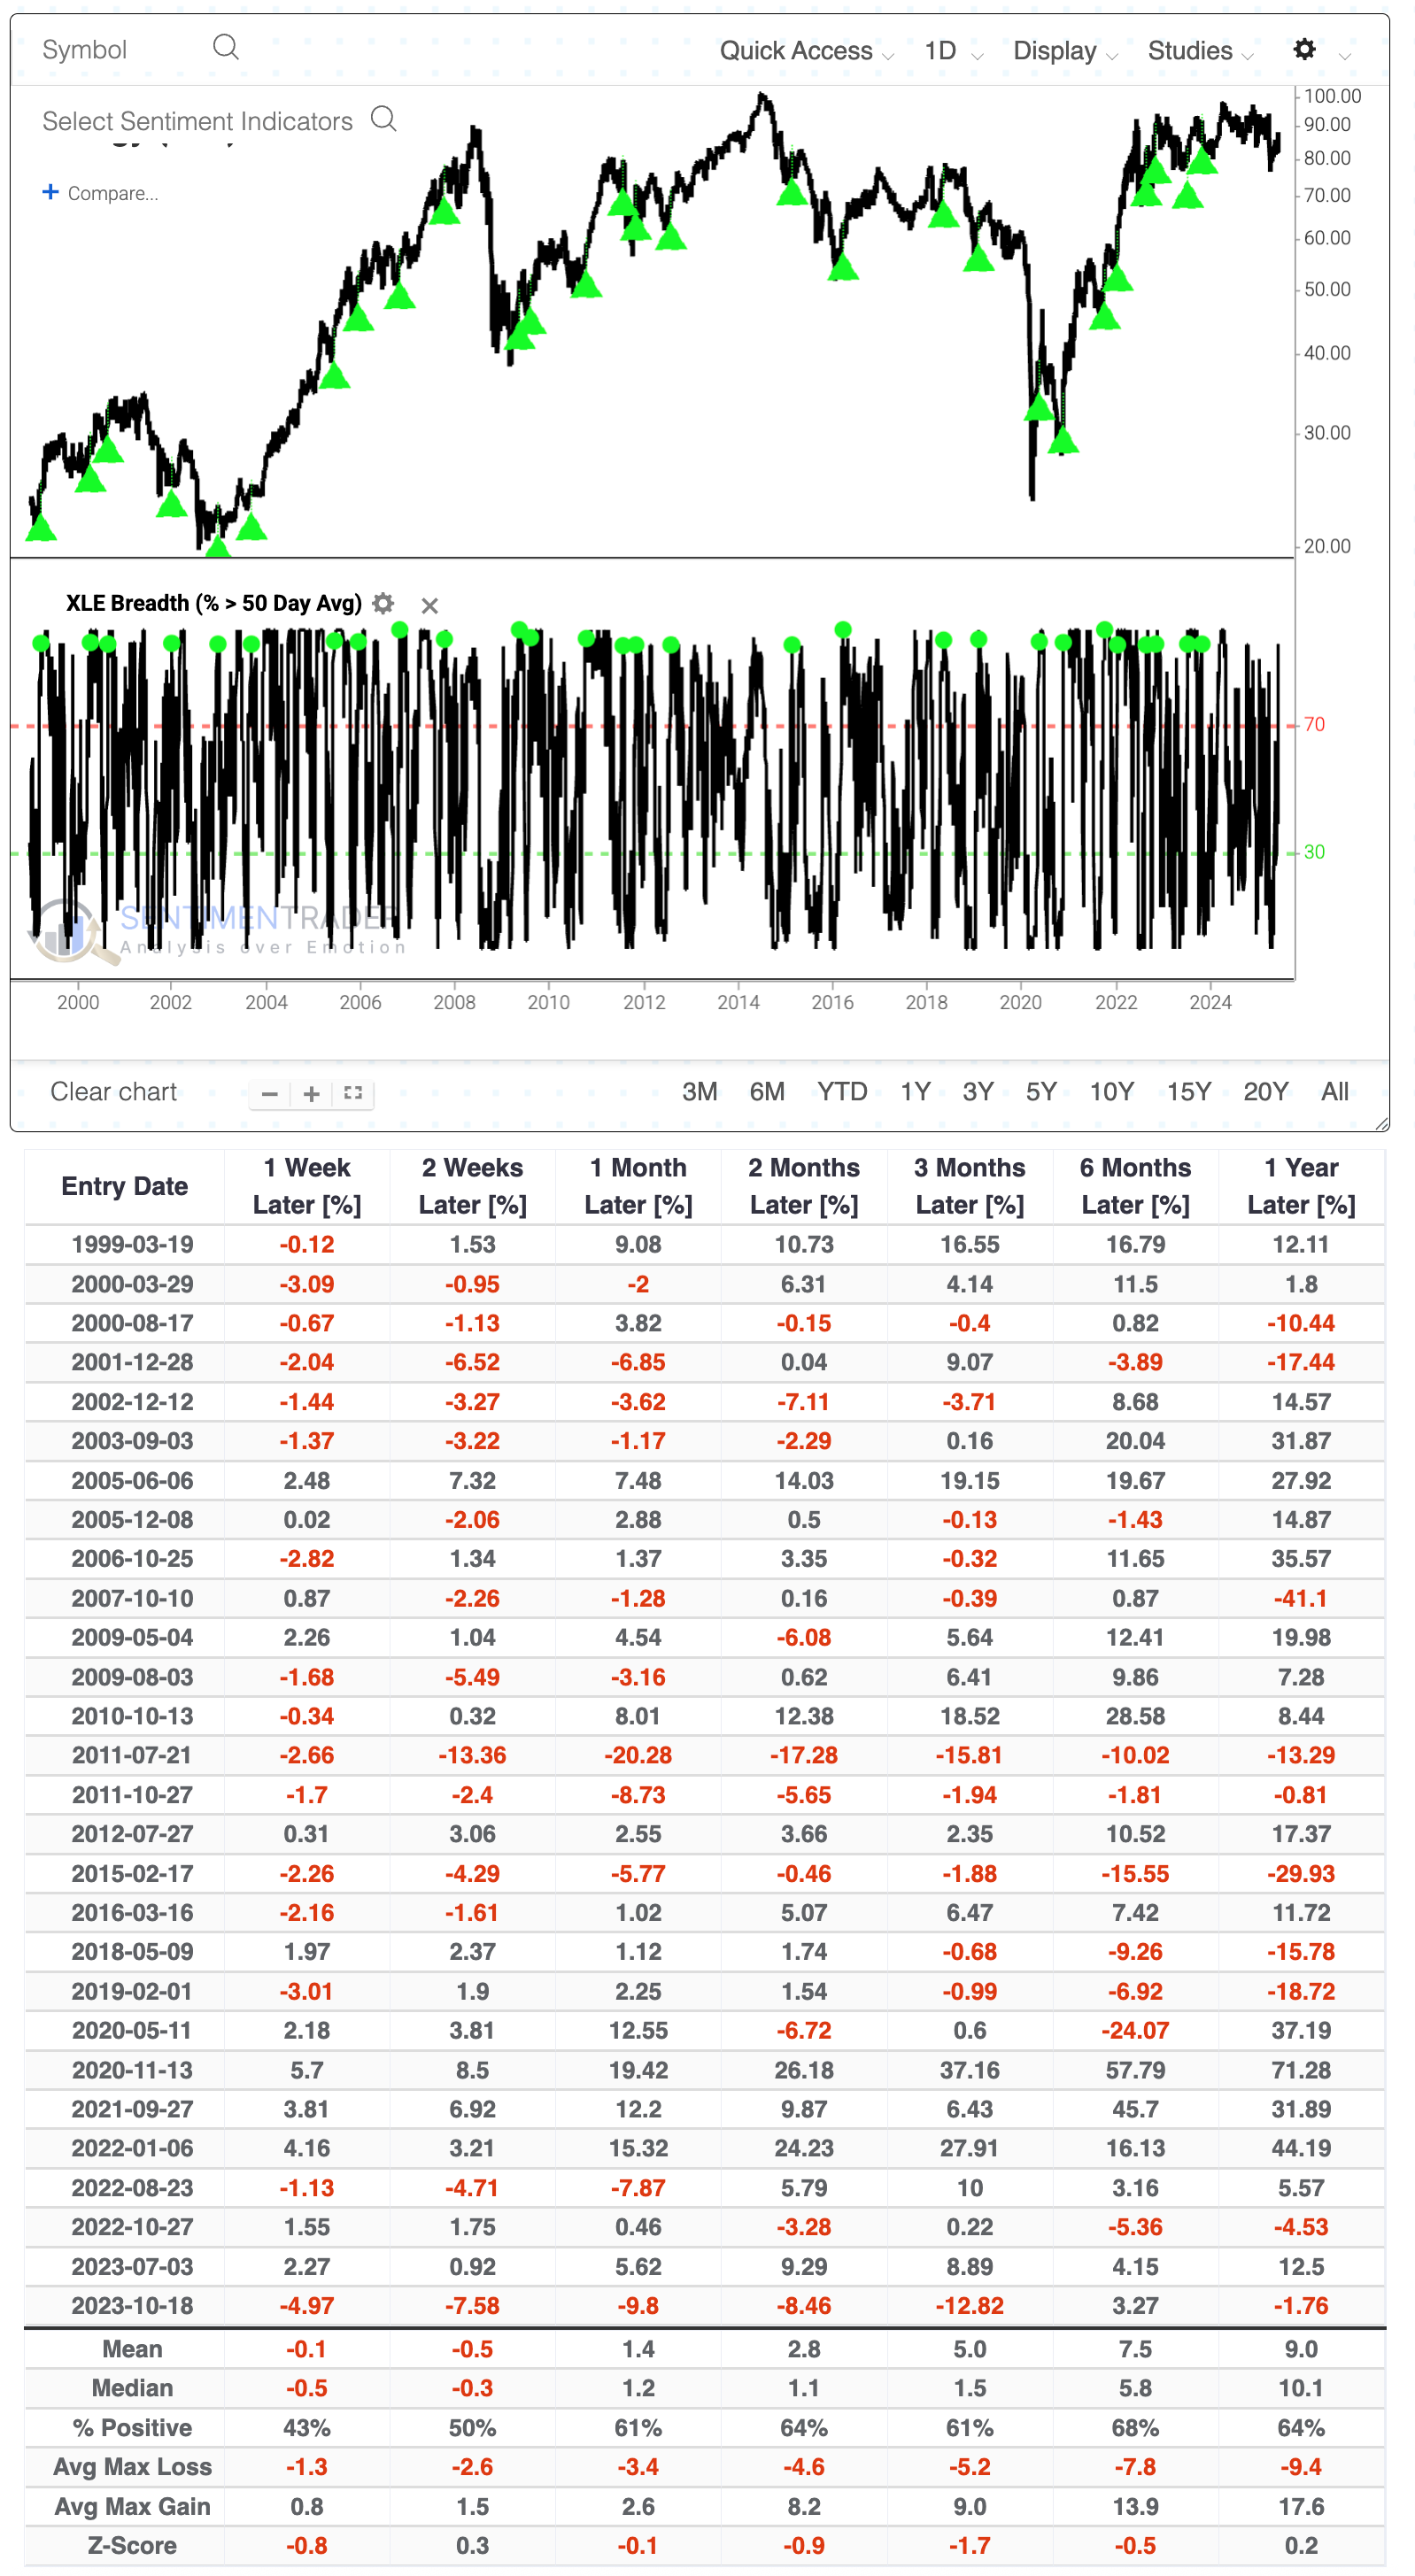
The rally pushed many more stocks above their 50-day Moving Average. After fewer than 5% were trading above their medium-term averages in April, now more than 95% have climbed above.
The fund struggled to add to its gains after similar moves. The post-pandemic 2020-2022 signals were a big exception to the overall trend of mediocre gains or outright losses up to three months after these cycles.
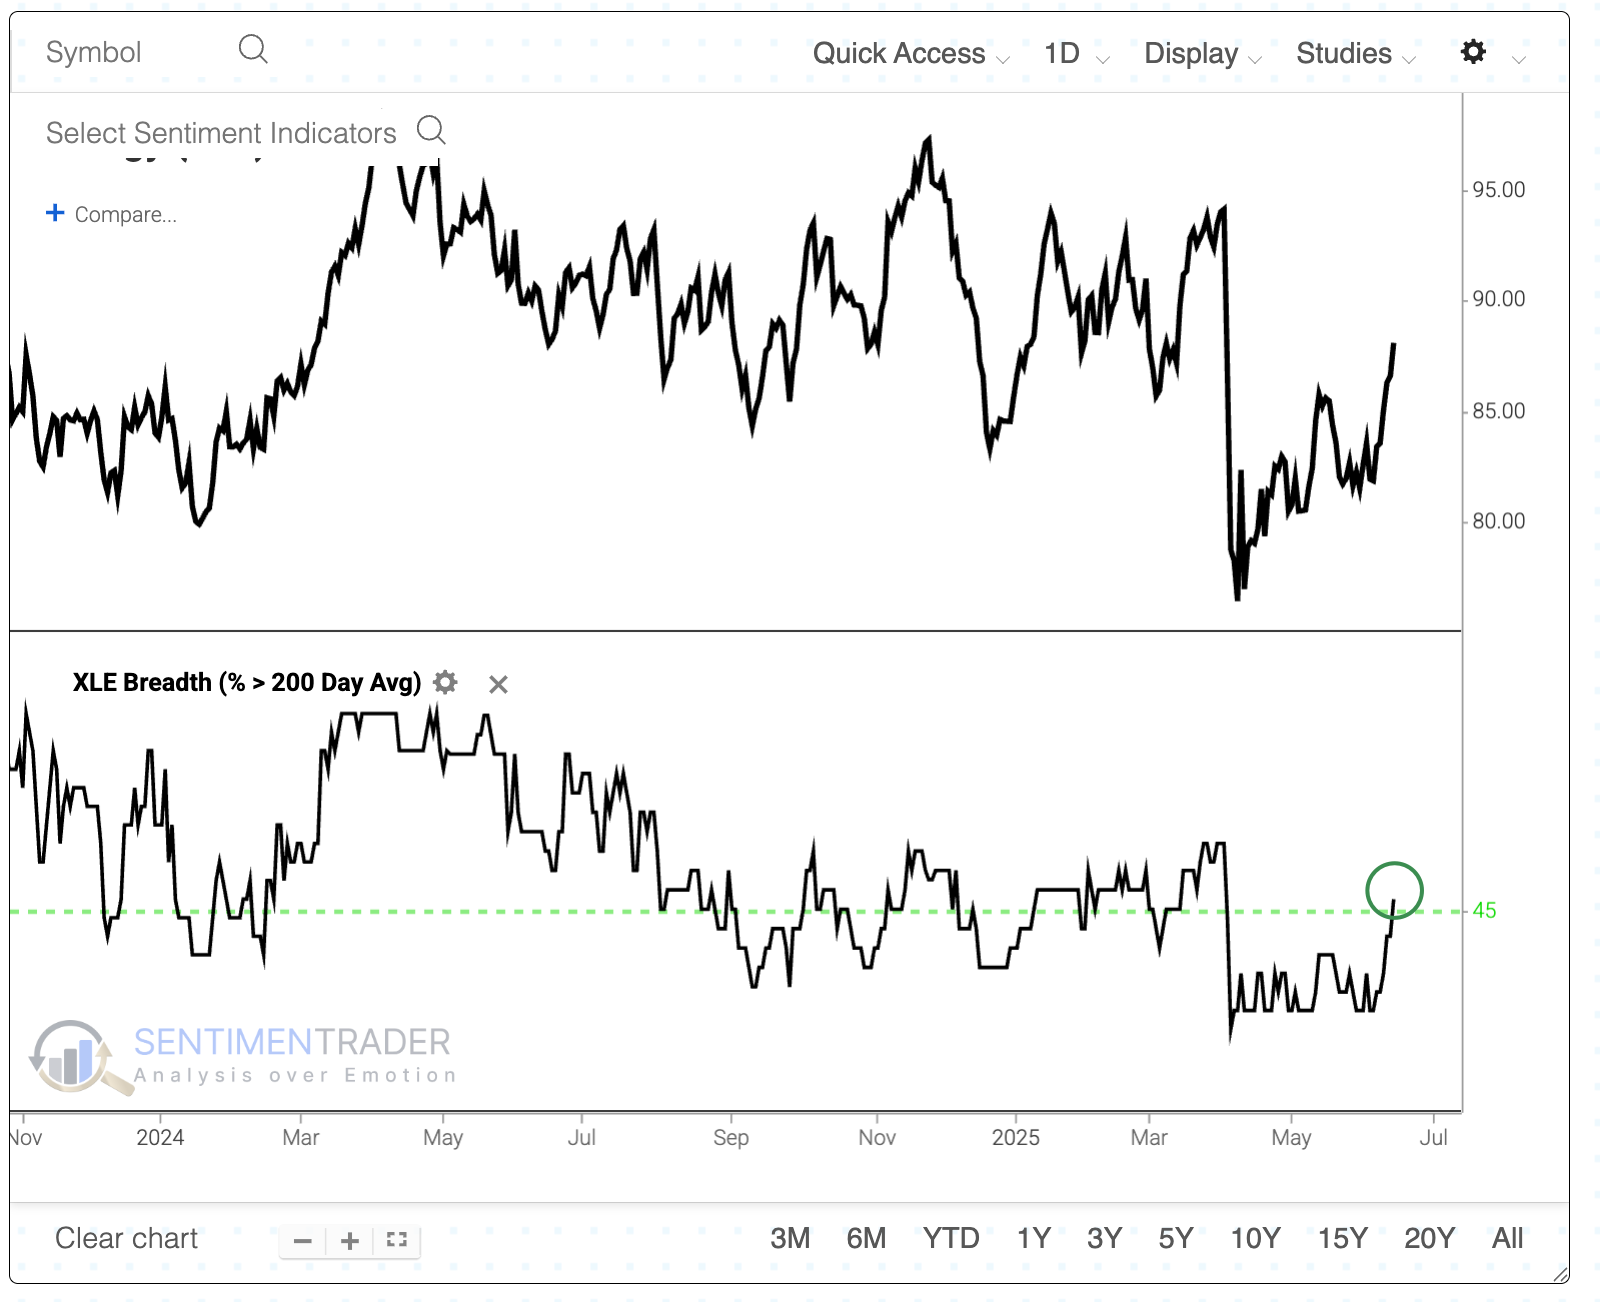
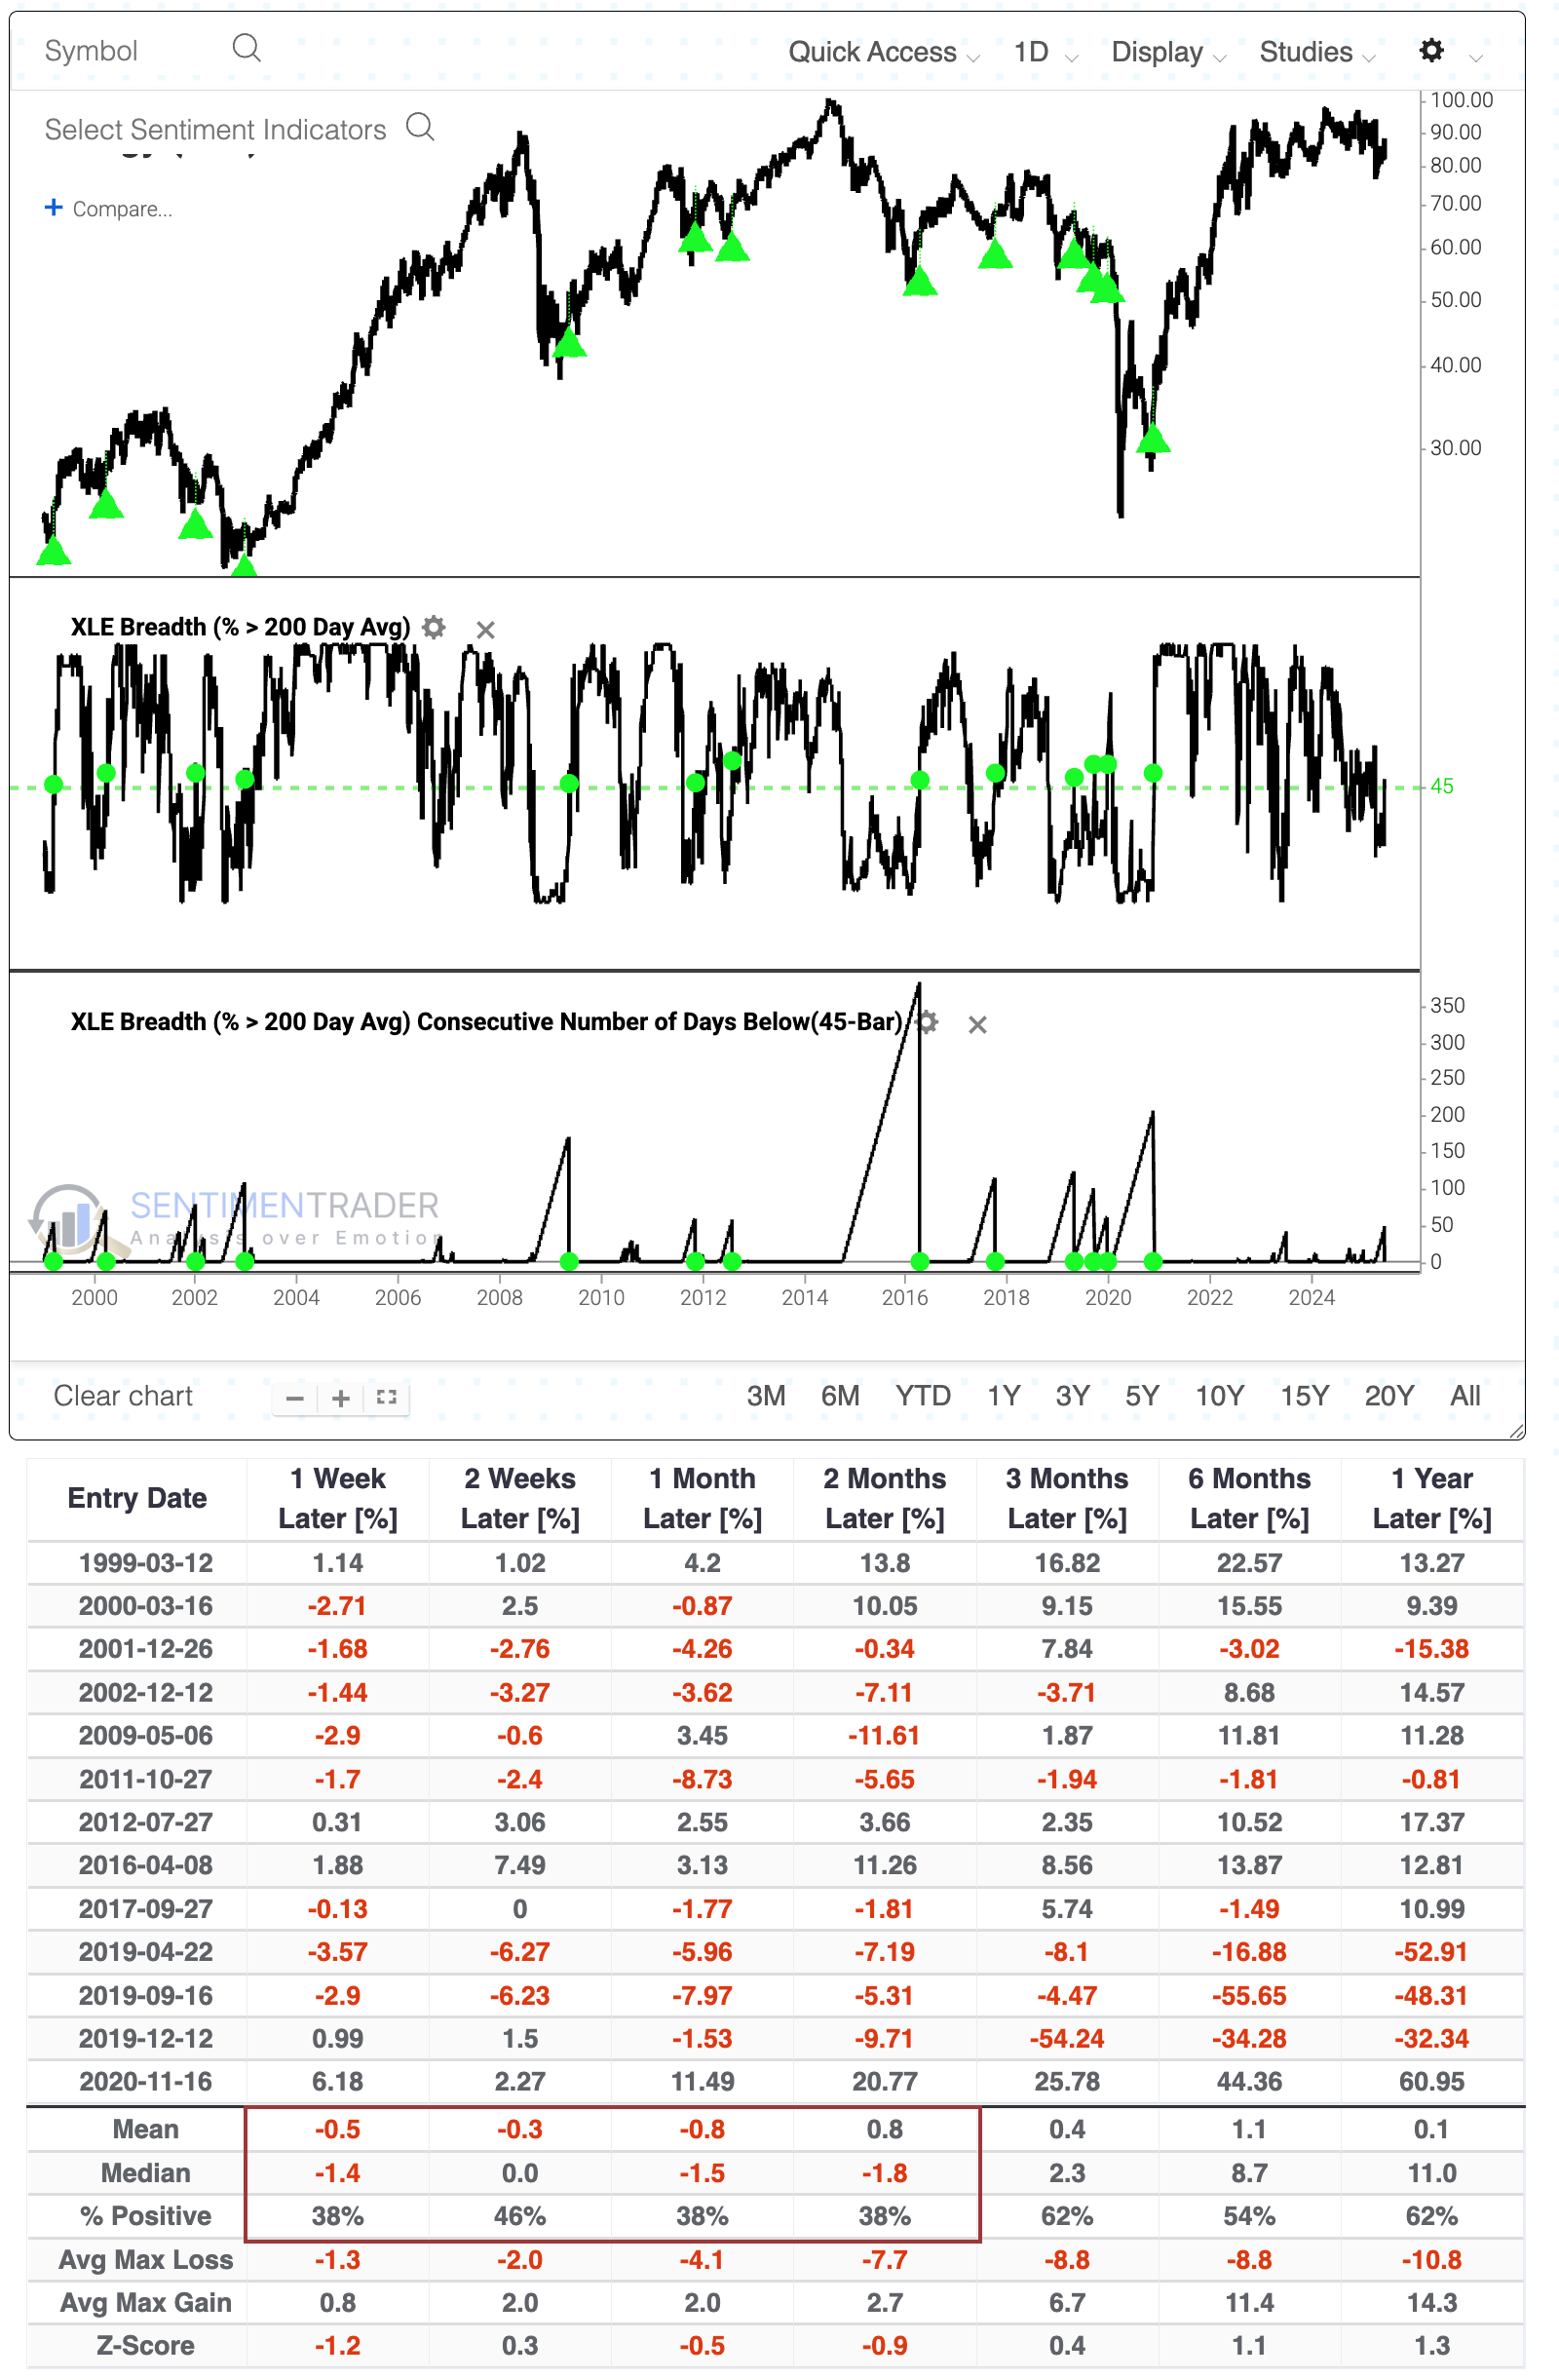
The gains have been enough to push more than 45% of stocks in XLE above their 200-day Moving Average. This is the first time in months that at least 45% of stocks climbed above their average.
Below, we can see that XLE once again had trouble adding to gains. The last signal, in 2020, was the major exception, with most of the others witnessing a give-back of gains up to two months later.
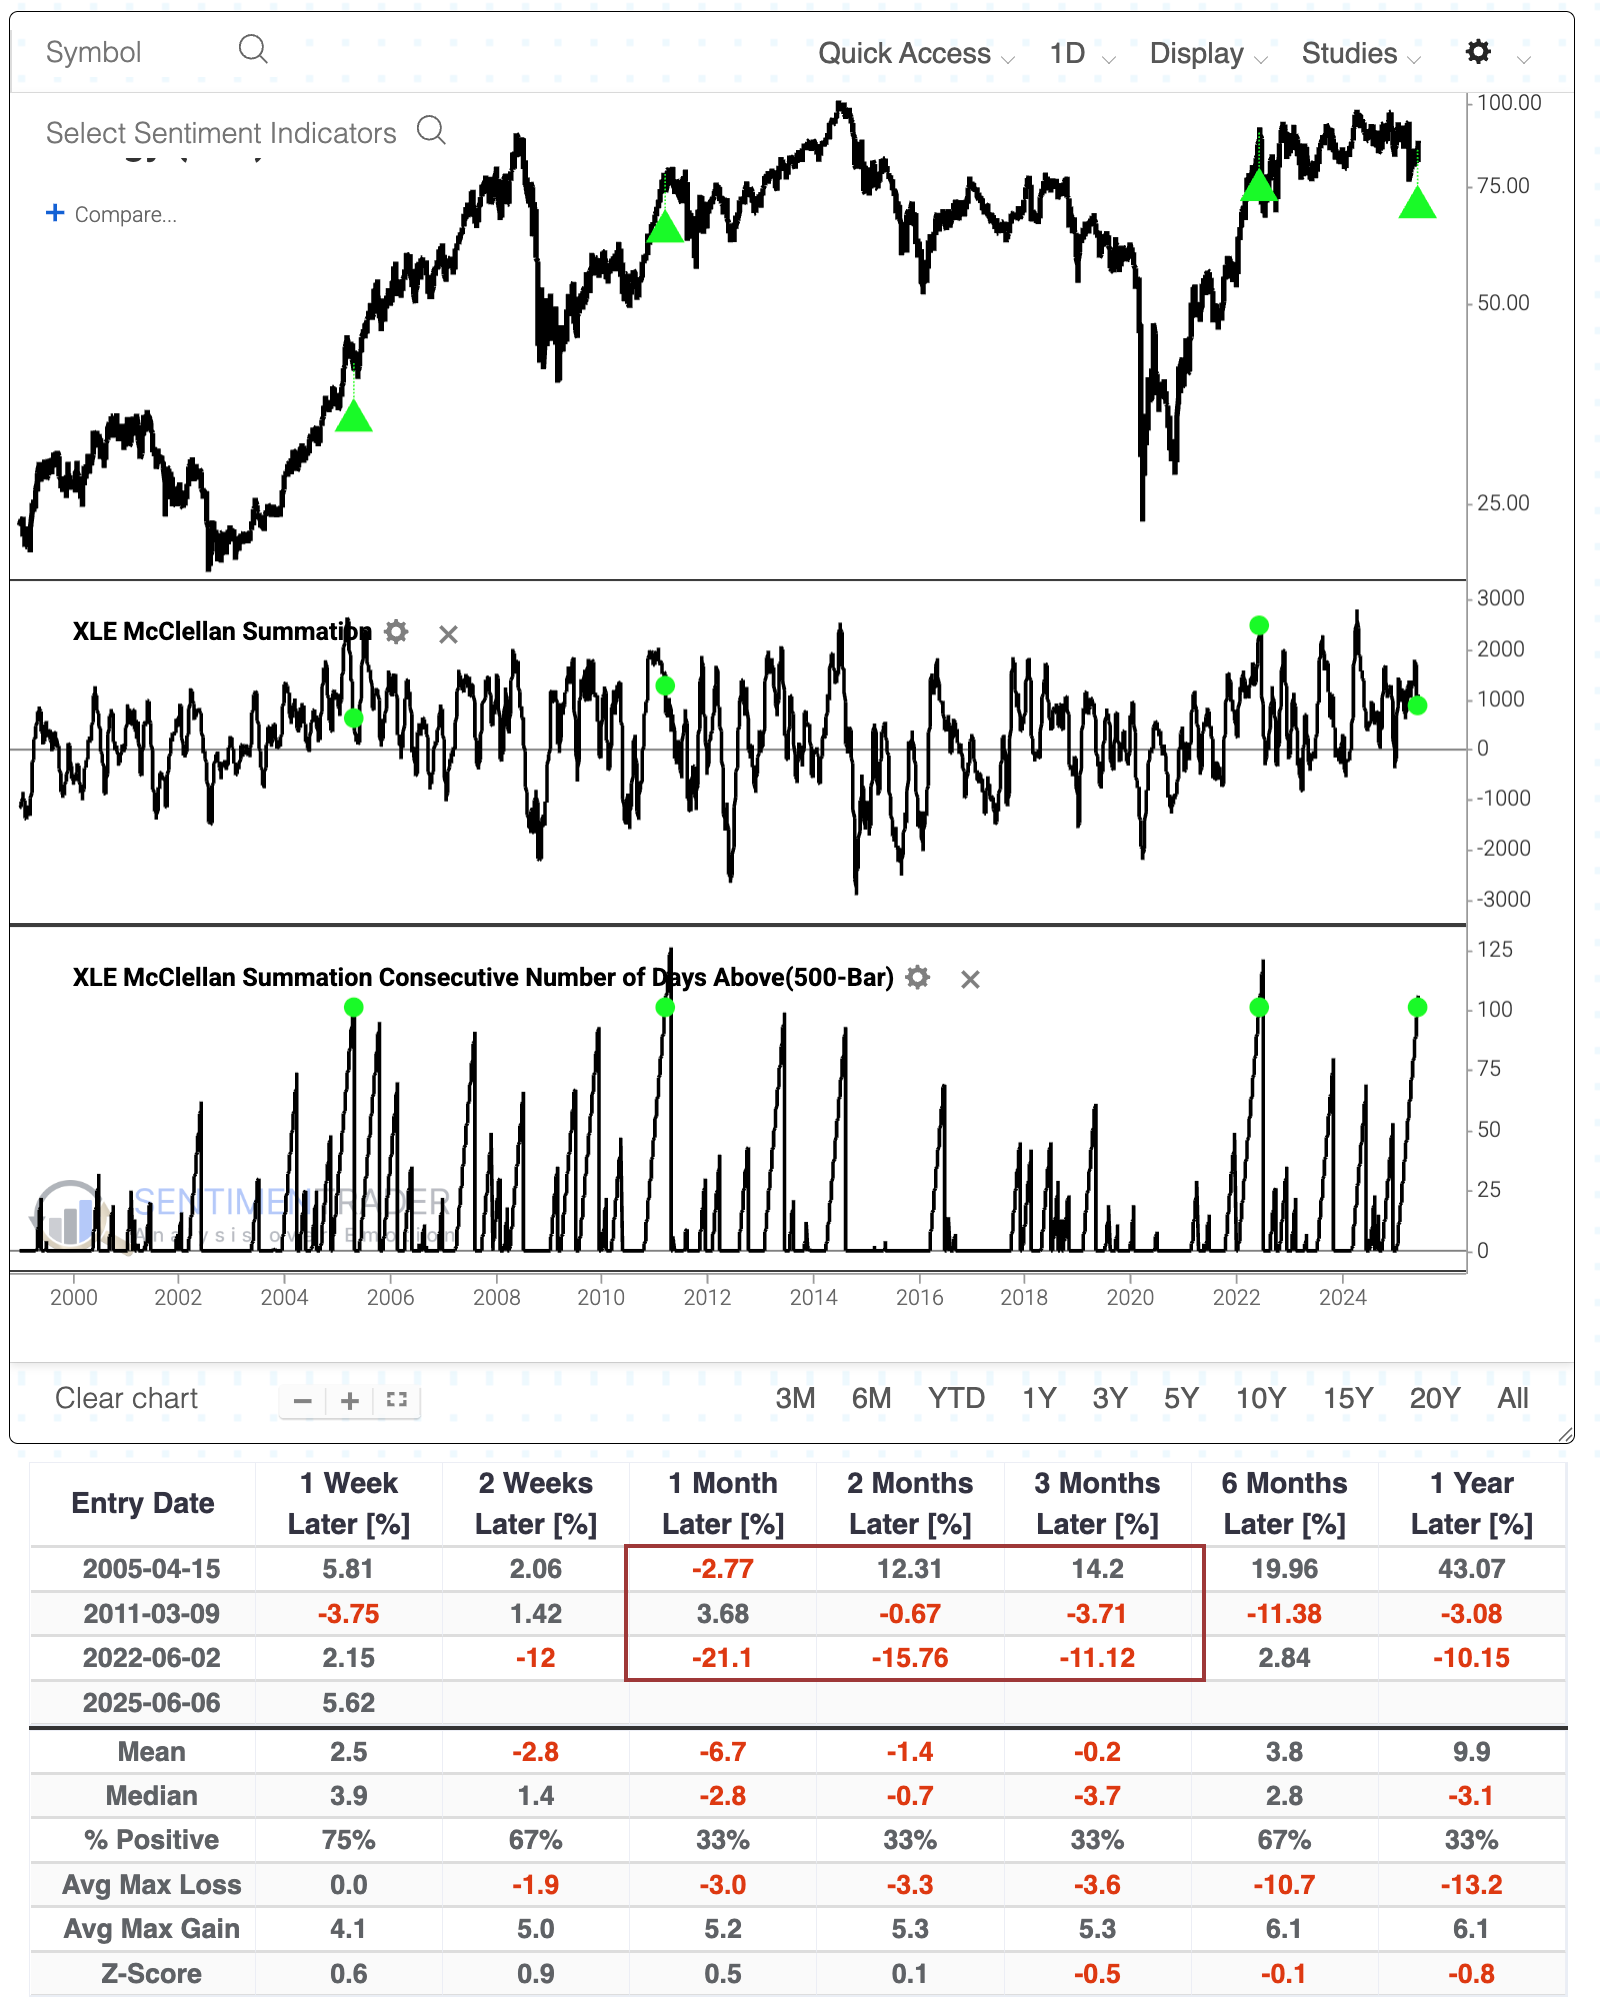
Thanks to the strong recovery in many stocks, the McClellan Summation Index has been holding above +500 for months. This is a strong sign of internal momentum.
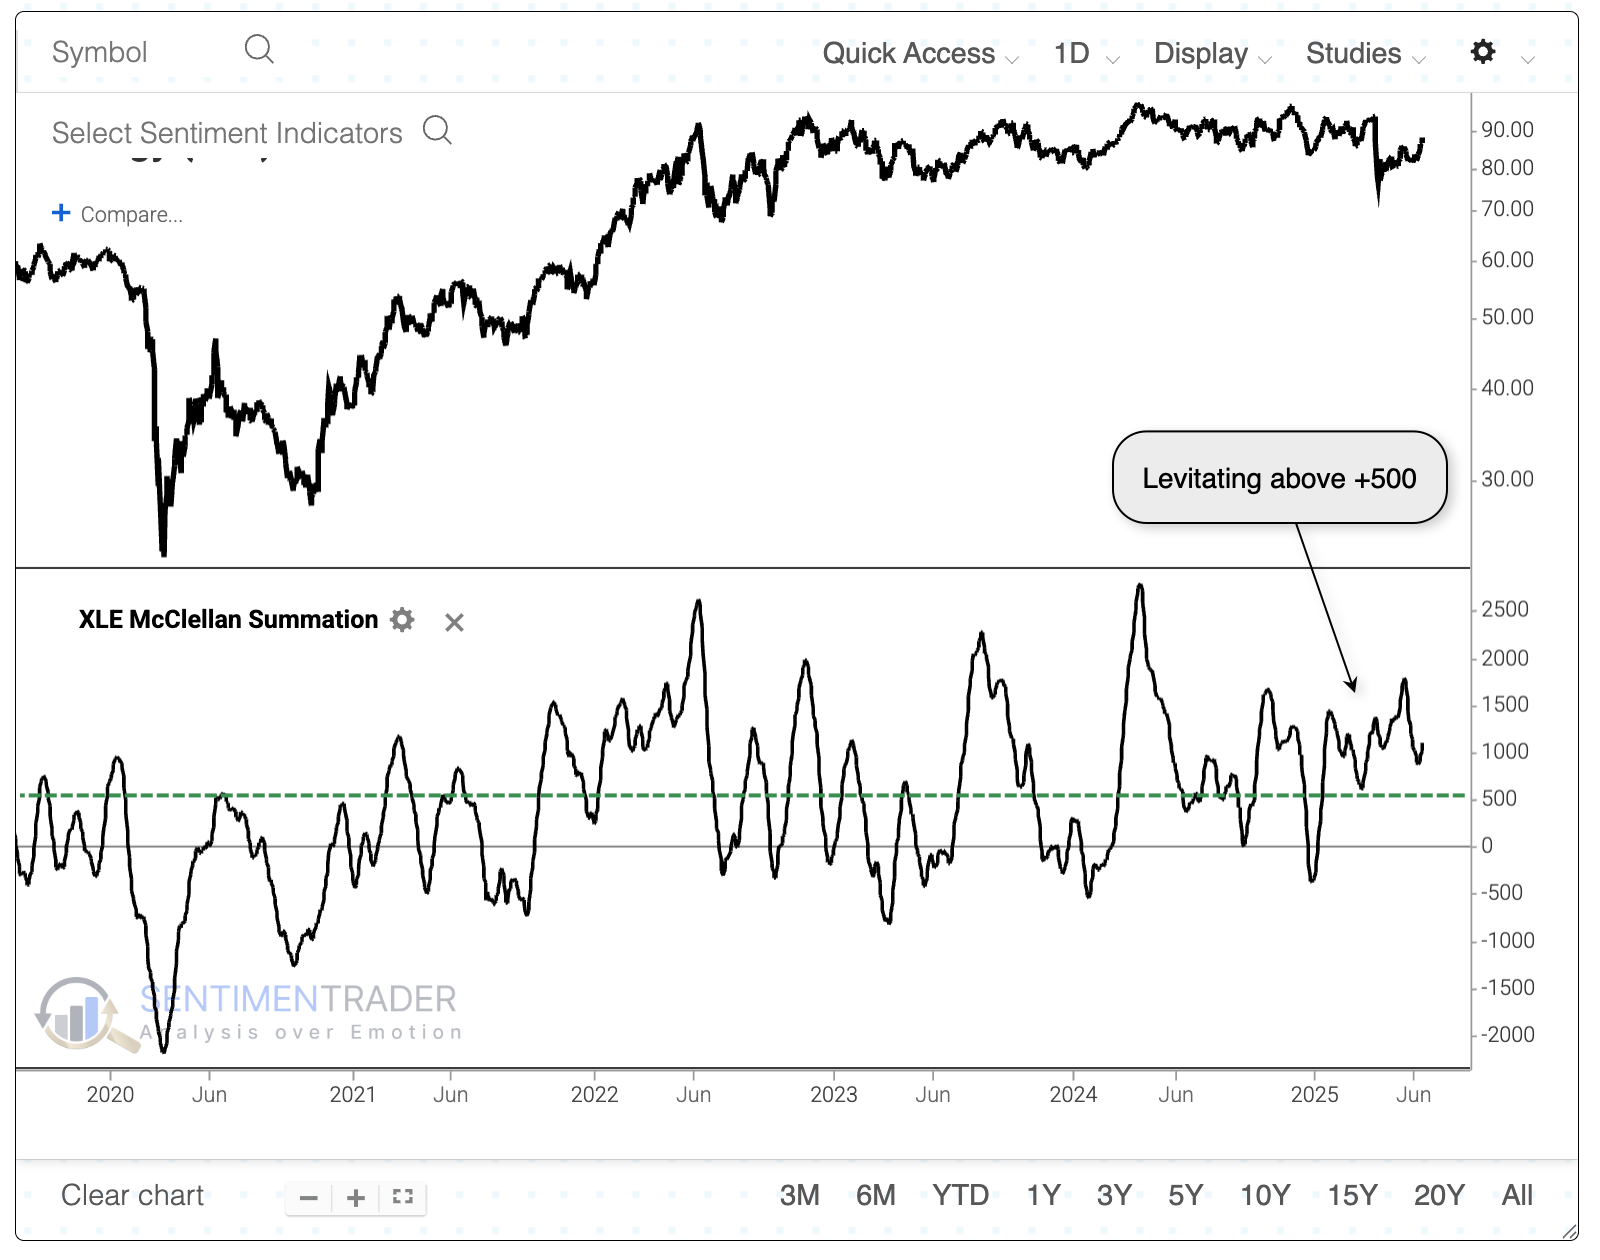
Unfortunately for energy stock investors, such strength has not typically been rewarded. There were only a few times when the Summation Index held above +500 for at least 100 sessions, and all three saw losses either one or two months later. In 2005, that was only a temporary hiccup, while the other two preceded more sustained losses.
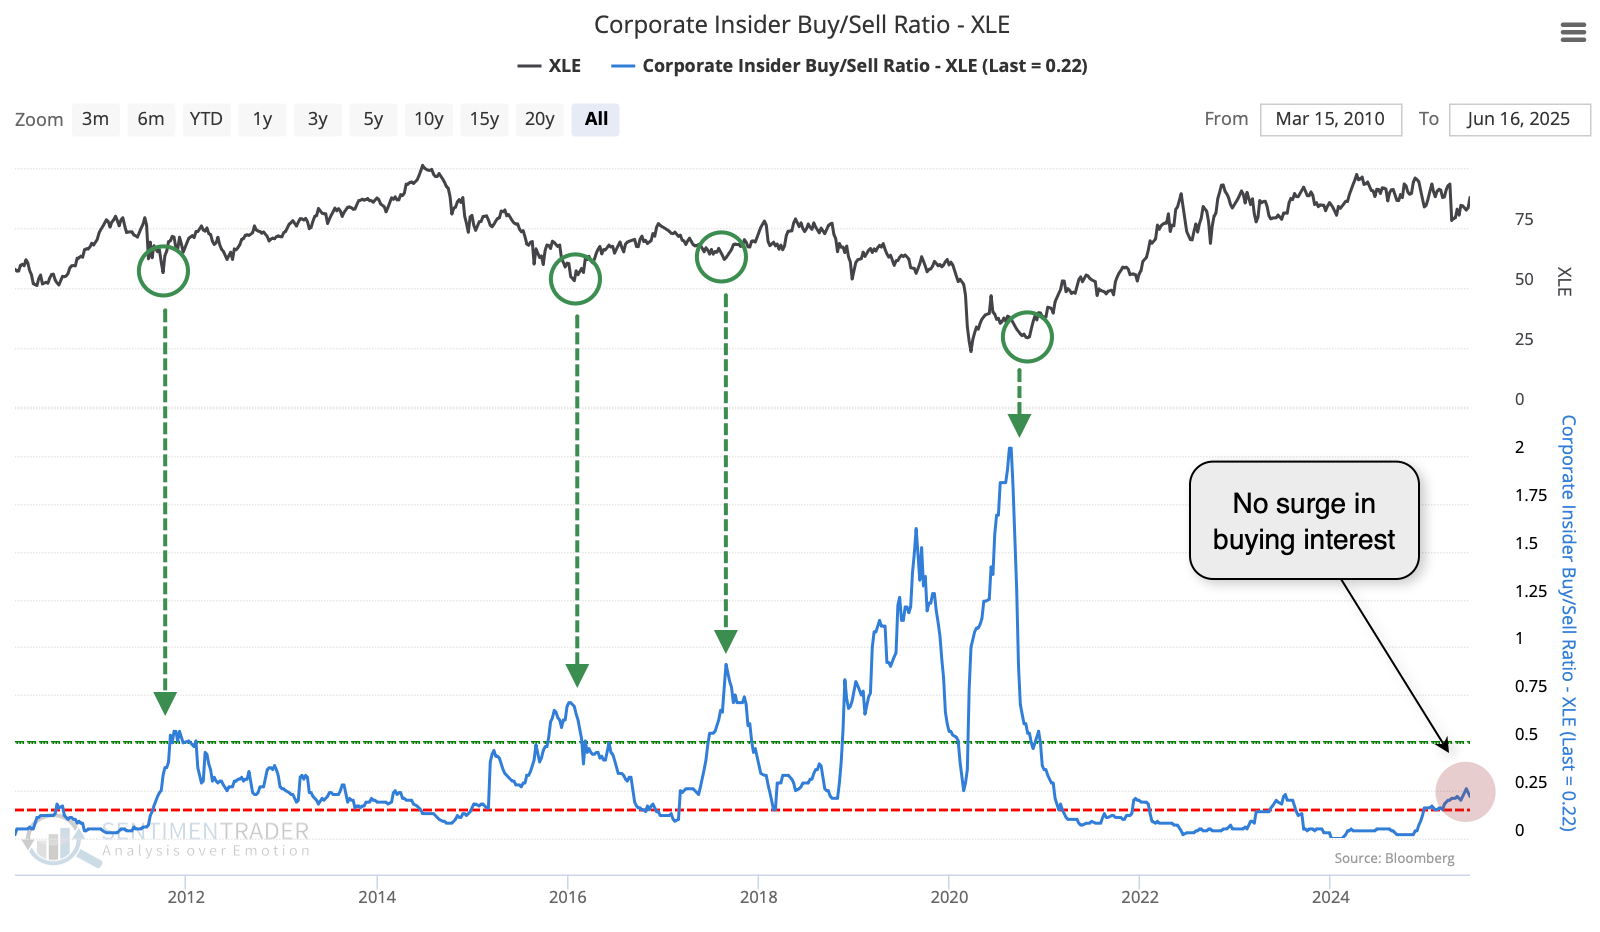
Furthering some concerns, corporate insiders among energy companies don't seem eager to snap up shares. The Insider Buy/Sell Ratio is creeping up, but only out of a depressed zone. Major lows in XLE over the past 14 years were preceded by a Buy/Sell Ratio above 0.5, while right now it is only half that.
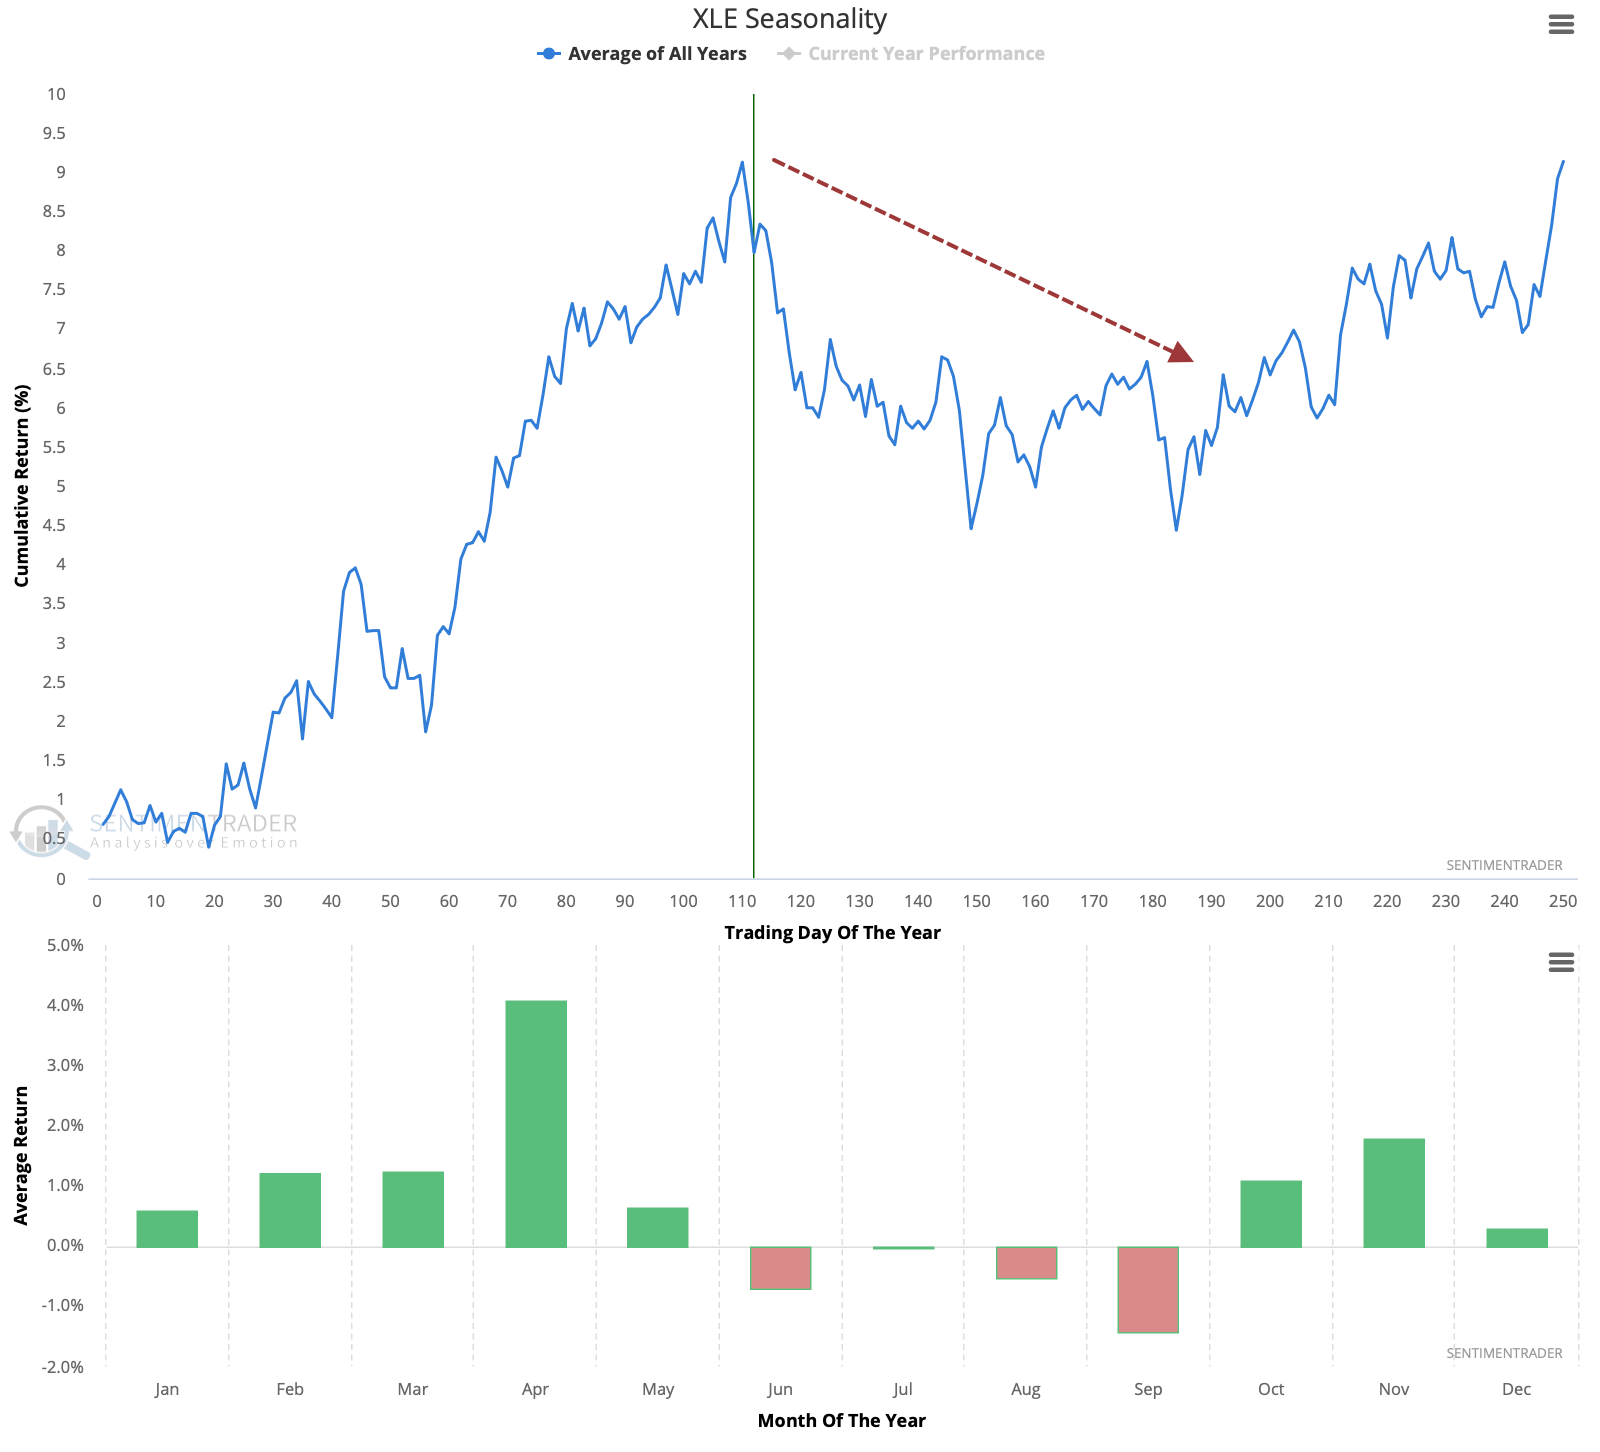
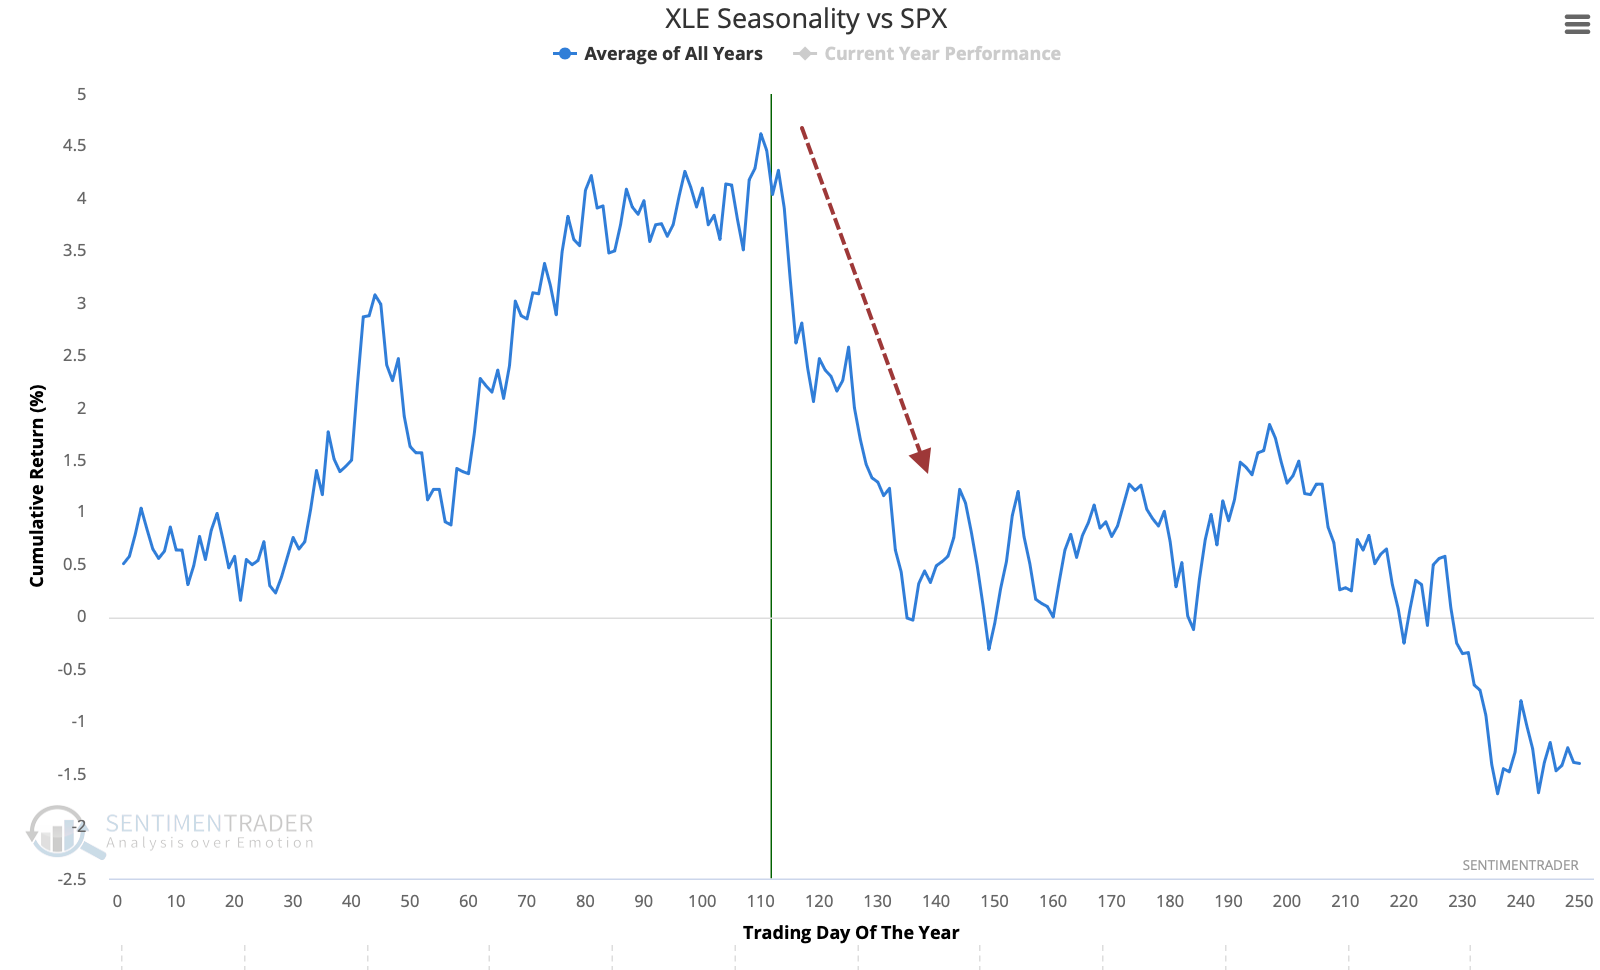
Seasonally, XLE has tended to suffer through a poor seasonal window during the summer months. Its weakest time of the year has been from June through September.
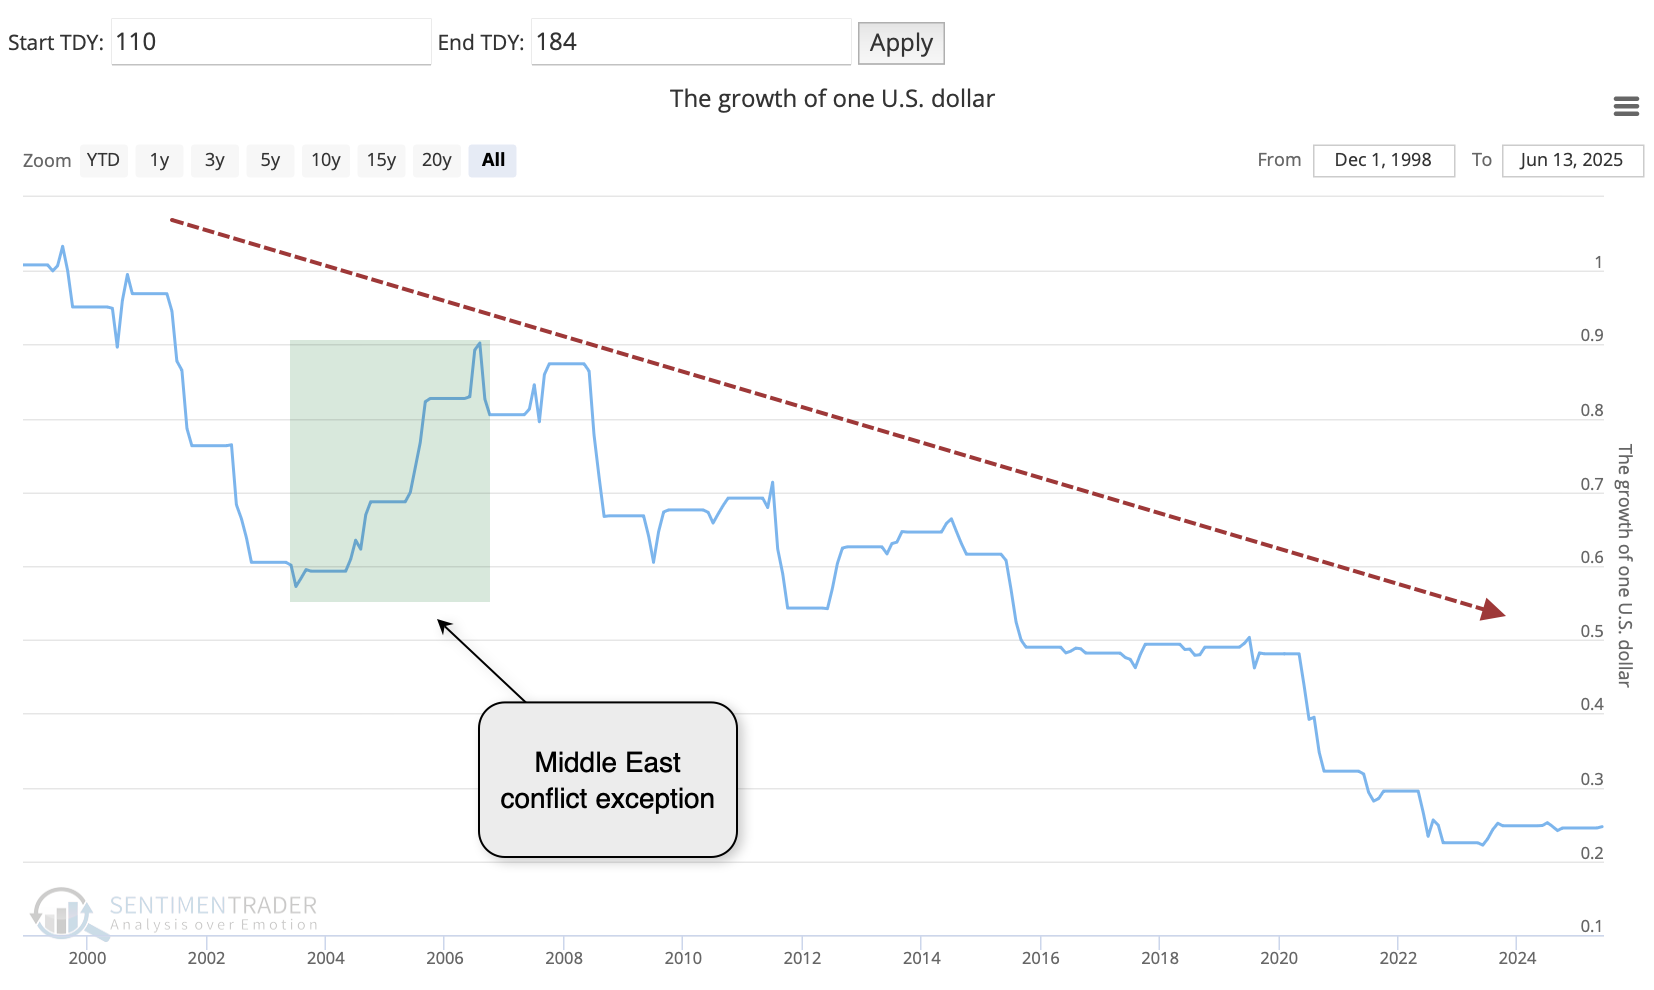
The equity curve from buying XLE at trading day #110 and selling at day #184 is pretty clearly down-and-to-the-right, not very appetizing for bullish positions. Since XLE's inception in 1999, $1 would have eroded into about $0.25 during these yearly windows. The Iraq war bump was the major exception.
XLE's performance was egregiously bad relative to the broader S&P 500 index during this time of year. Right about now, it has tended to take a nosedive relative to the market.
It's not all bad news
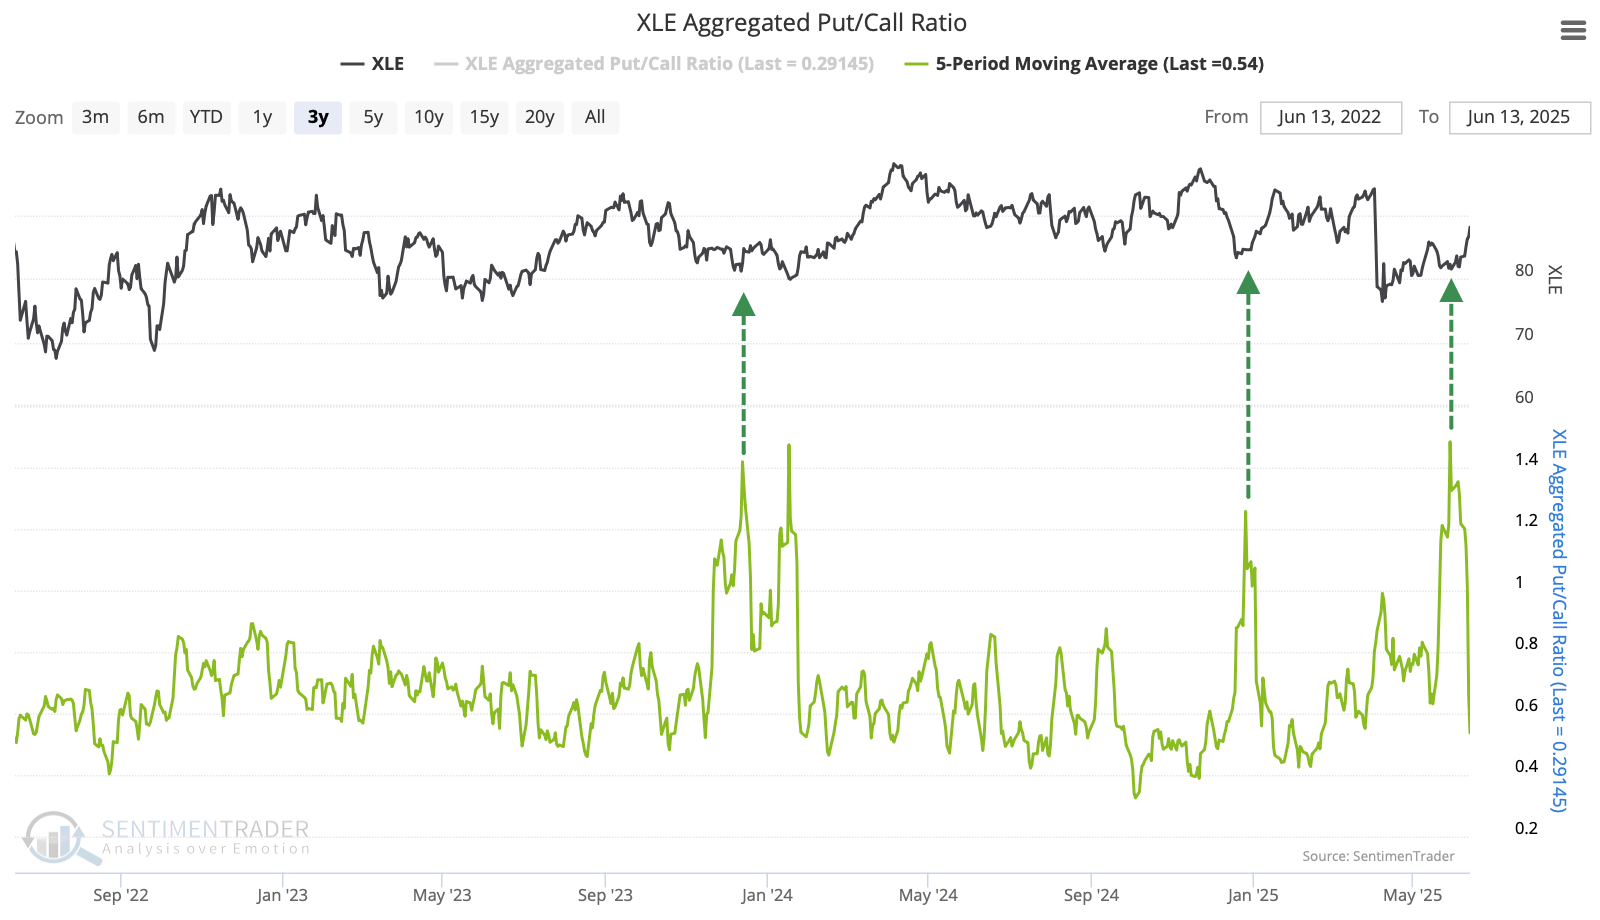
The quick and severe drop in April triggered options traders to turn over a bevy of protective put options, which is only now coming back down. While XLE already rallied from the most recent extreme, the others tended to last a bit longer before rolling over.
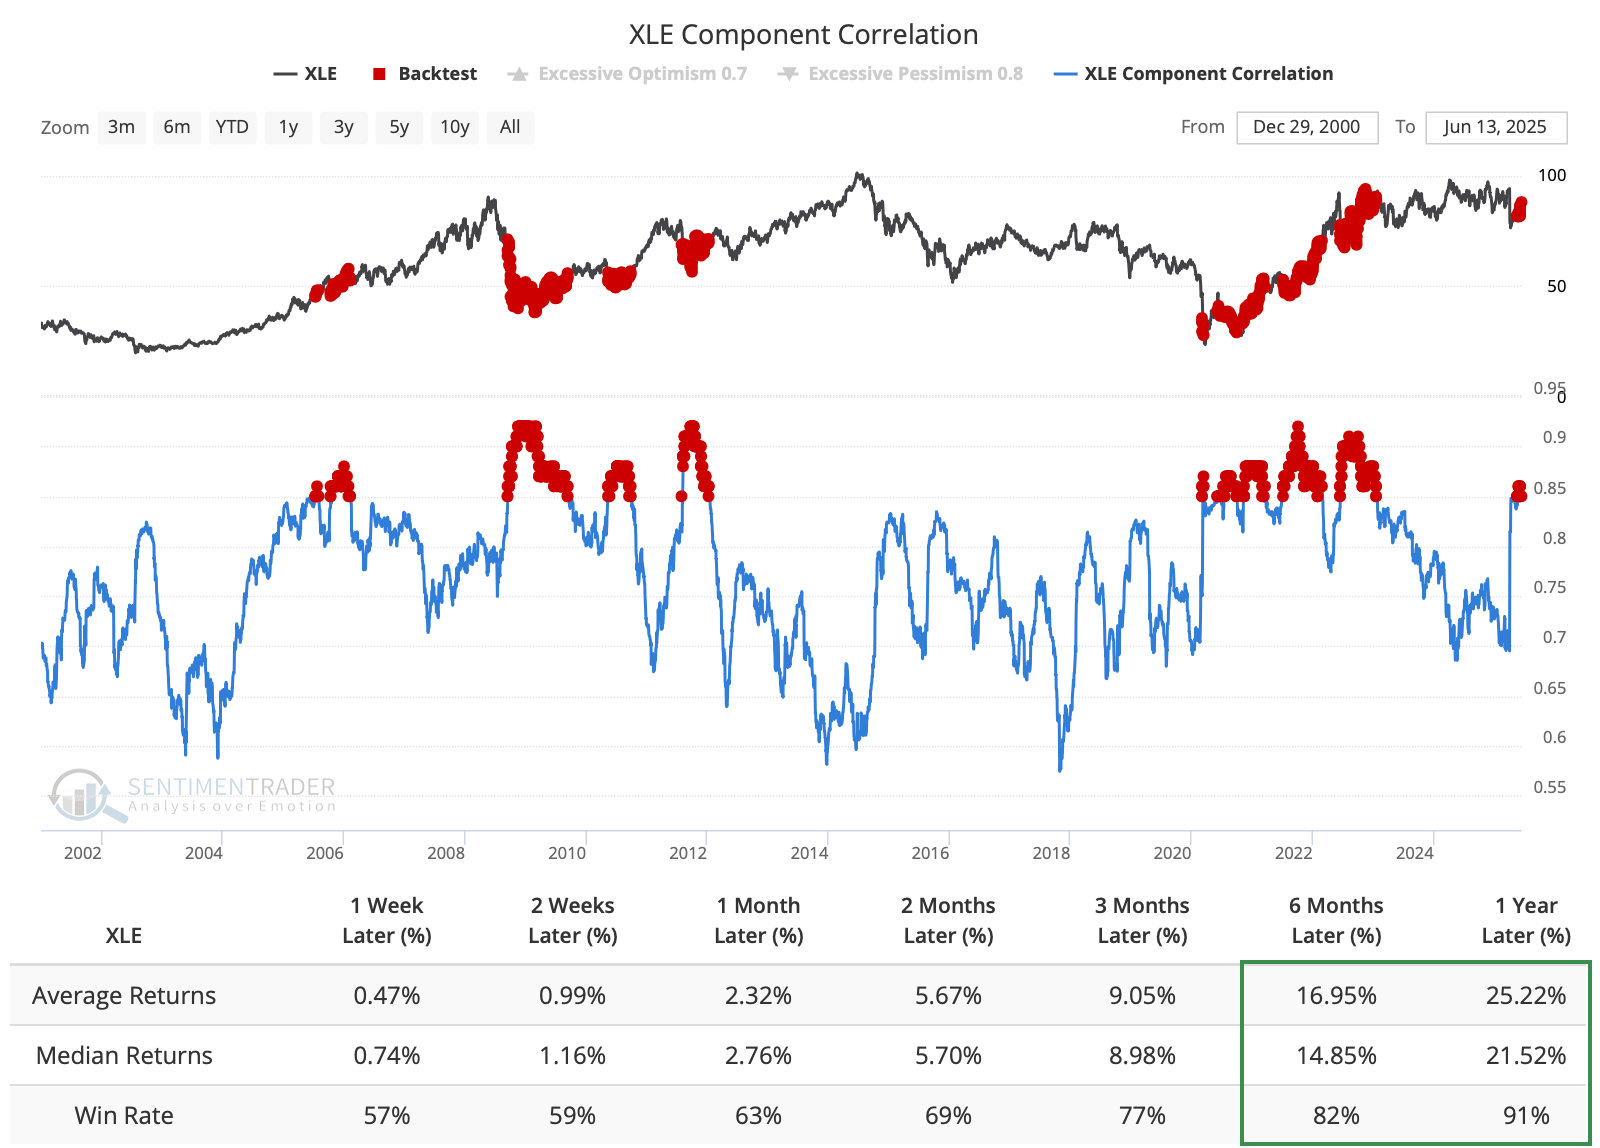
The April decline panicked investors into dumping virtually all energy shares simultaneously, spiking the correlation among stocks. Similar panics tended to precede handsome longer-term returns.
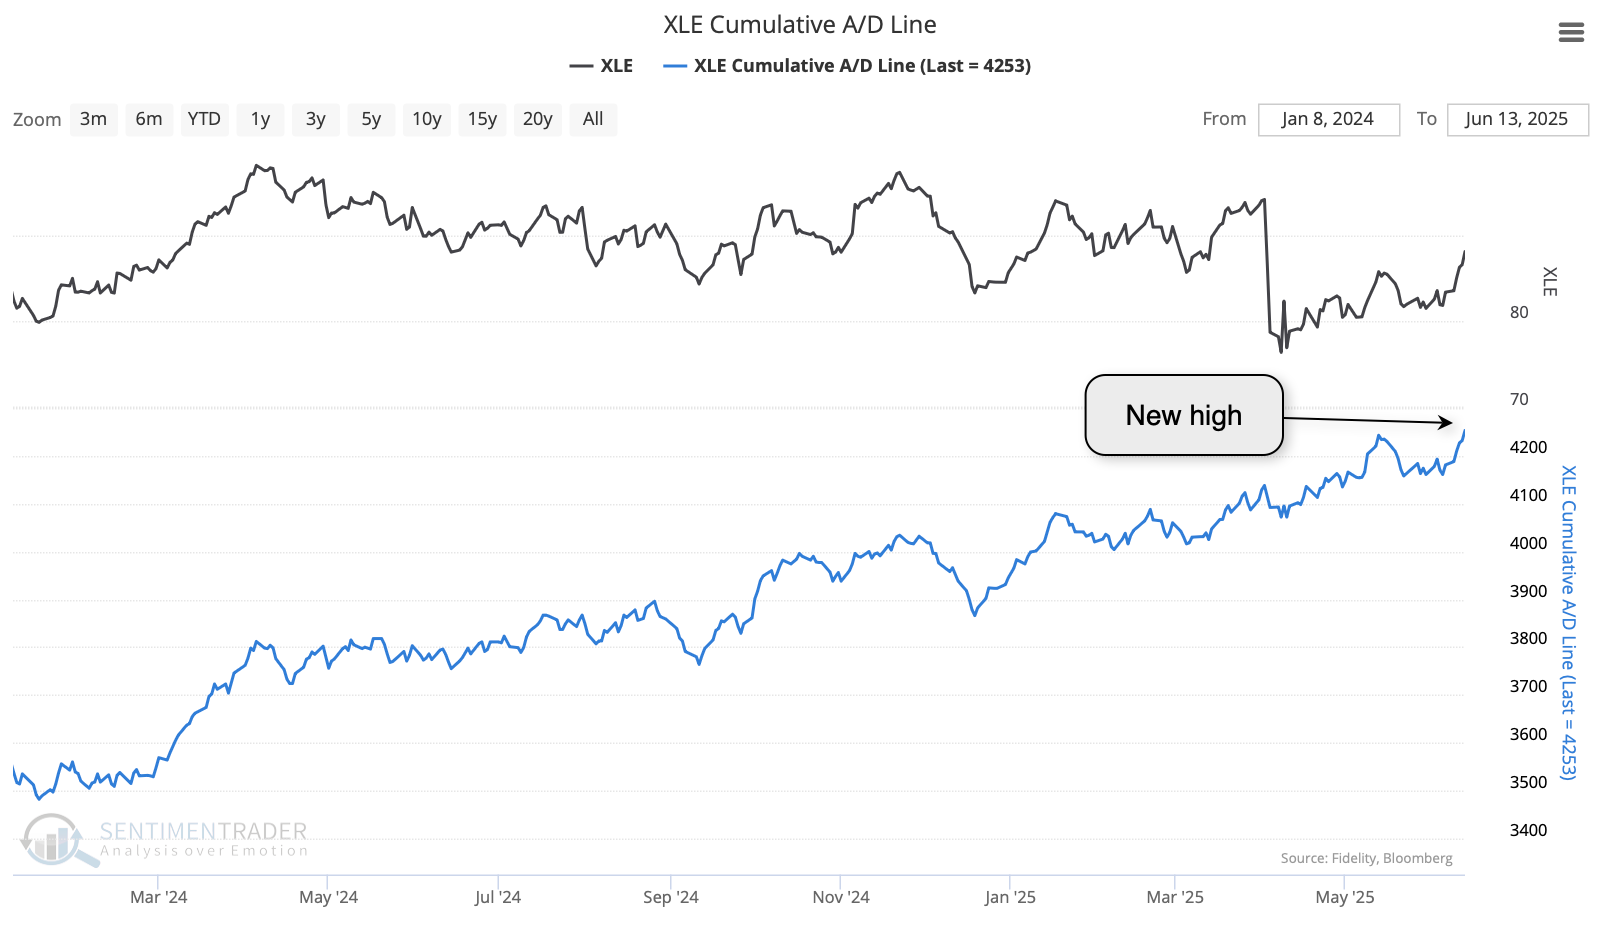
Perhaps most impressively, the Cumulative Advance/Decline Line among stocks in XLE has just scored a fresh record high. It has climbed steadily since the spring of 2024, even as the XLE fund stagnated. This is a sign of broad-based interest in the sector, typically a good sign for sustained advances.
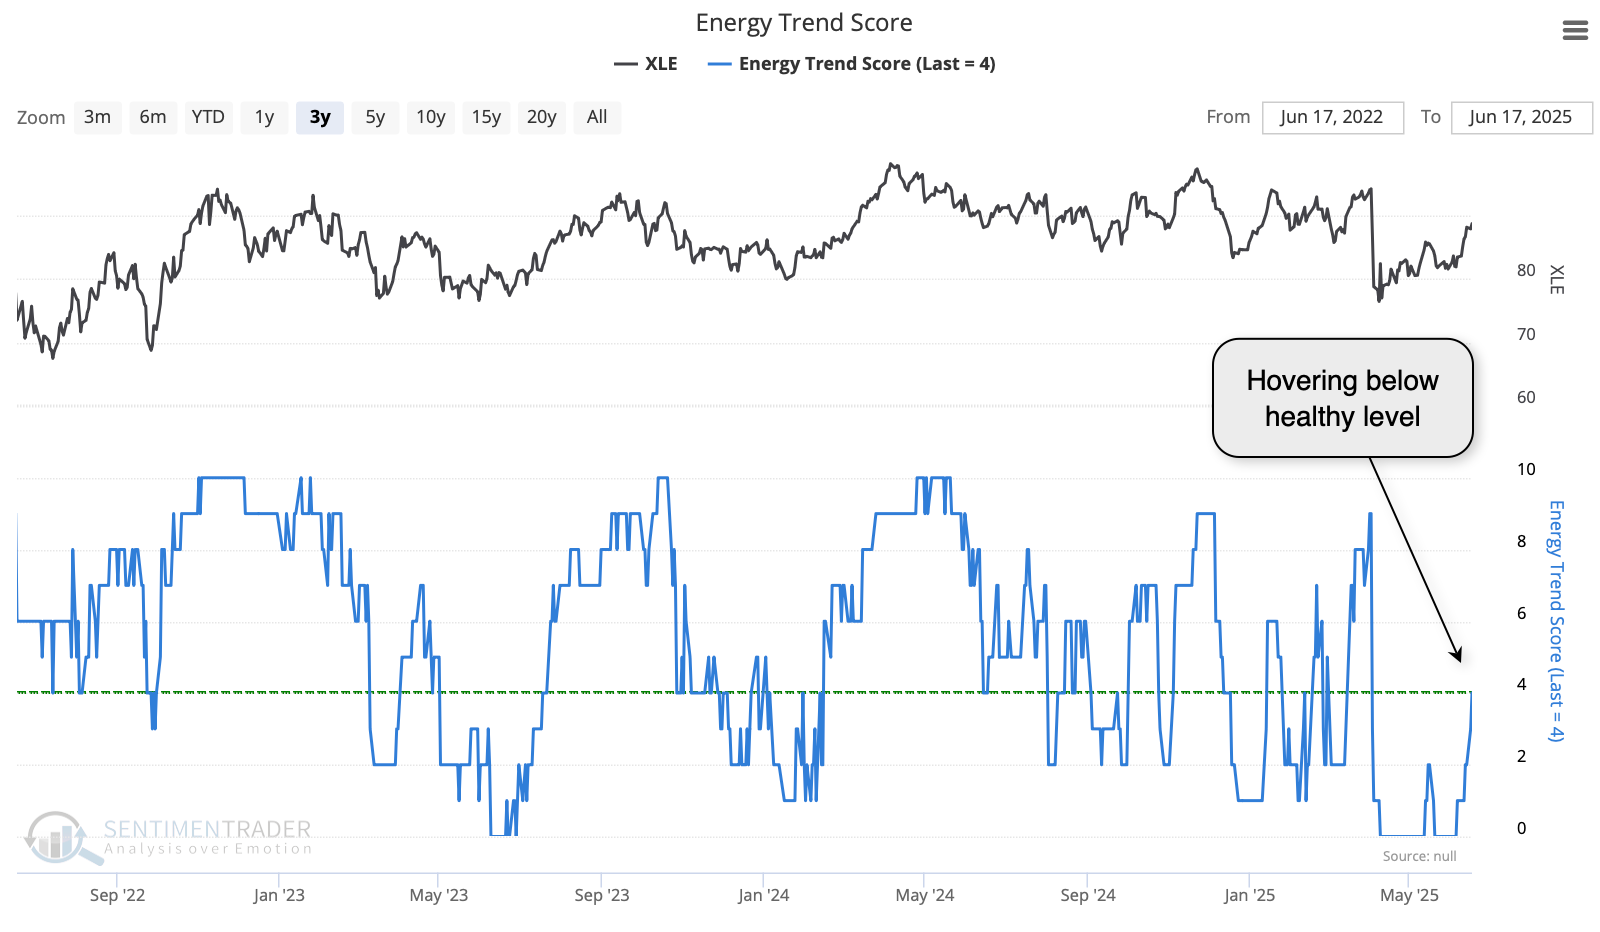
These positives need more time to work, with the Trend Score for XLE remaining weak. It needs time and stronger performance to overcome some of its moving averages; fewer than half of the trend-following measures are in healthy territory. XLE has done better in recent years when at least 4 of the 10 were positive, and it's hovering around that threshold now.
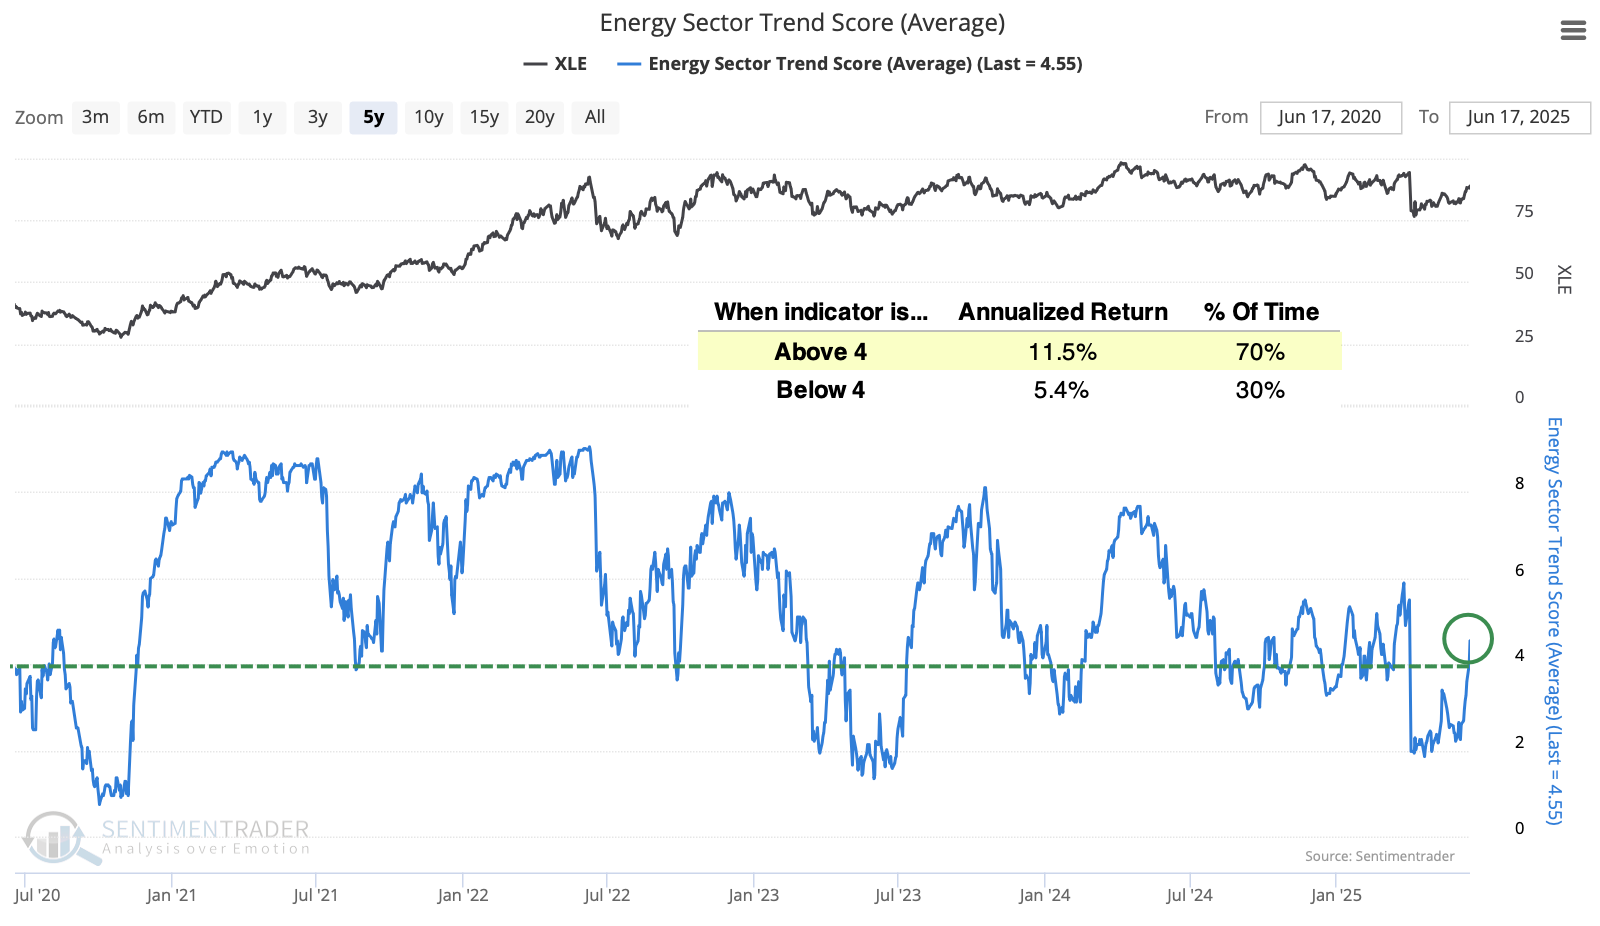
This week, the average trend score among XLE stocks finally climbed above 4. The chart below shows that XLE's annualized return doubles when the average stock in the sector has a Trend Score of 4 or above.
What the research tells us...
Geopolitical developments, or even the hint of them from social media posts, can swing the energy sector by several percent per day, which is currently an even higher risk. Rhymes from 2002 have prompted investors to front-run a potential sustained run higher.
There are certainly some positive signs for stocks in the sector, with a new high in breadth following some panicky April readings, and rapidly improving trend scores. But over the past quarter century, energy investors have often had the rug pulled from under them when trying to jump on suddenly impressive momentum. The sector does not have a good track record of following through on moves like it's seen in recent weeks. Typically, the failures happened right away. If bulls continued to bid up the sector, then XLE had a better track record of sustaining its gains longer-term. Bulls should be watching the coming week(s) closely.