
Energy reverses from oversold to overbought

Key points:
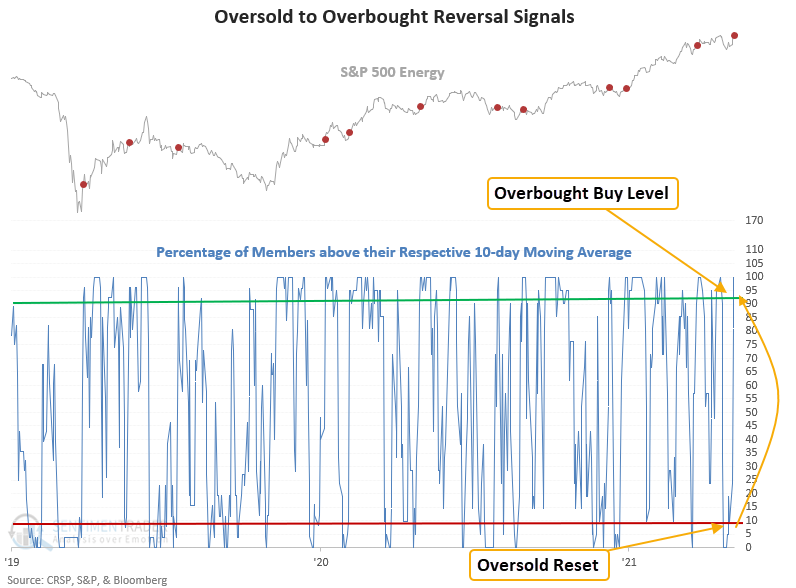
- The number of S&P 500 energy stocks above their 10-day avg cycled from 5% to 100%
- The oversold to overbought reversal occurred over 5 trading sessions
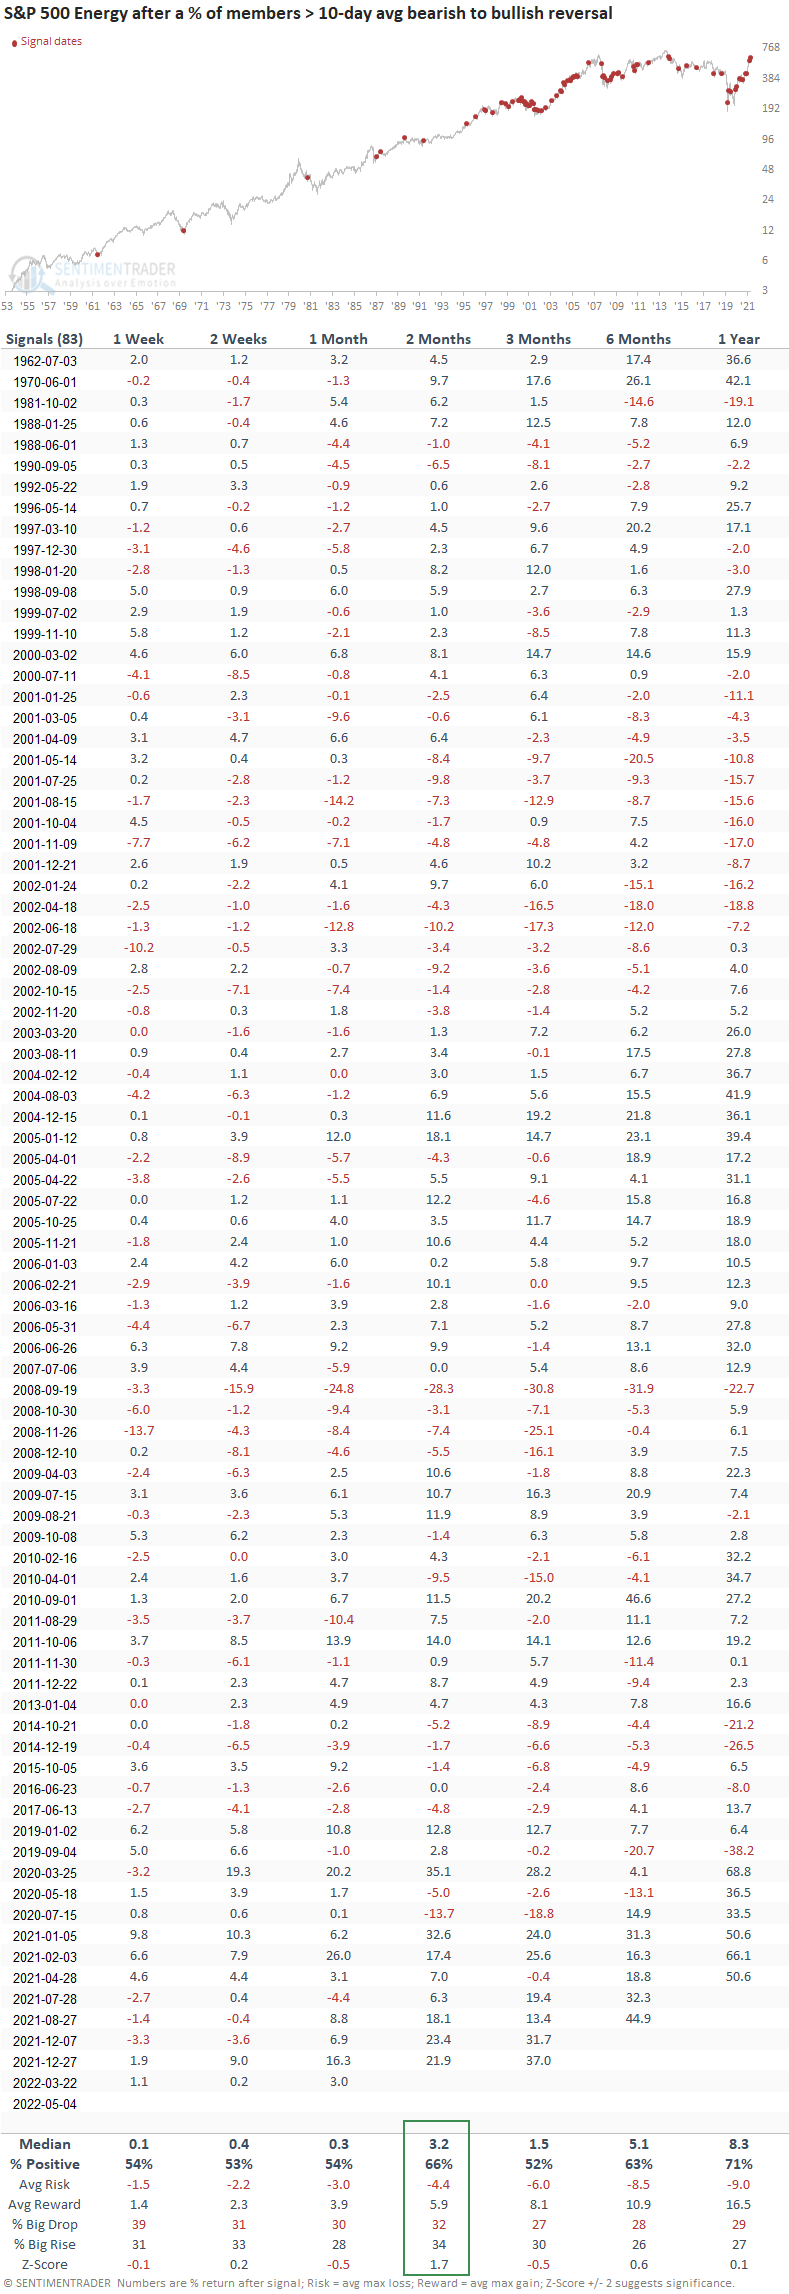
- After other signals, the energy sector rallied 66% of the time 2 months later
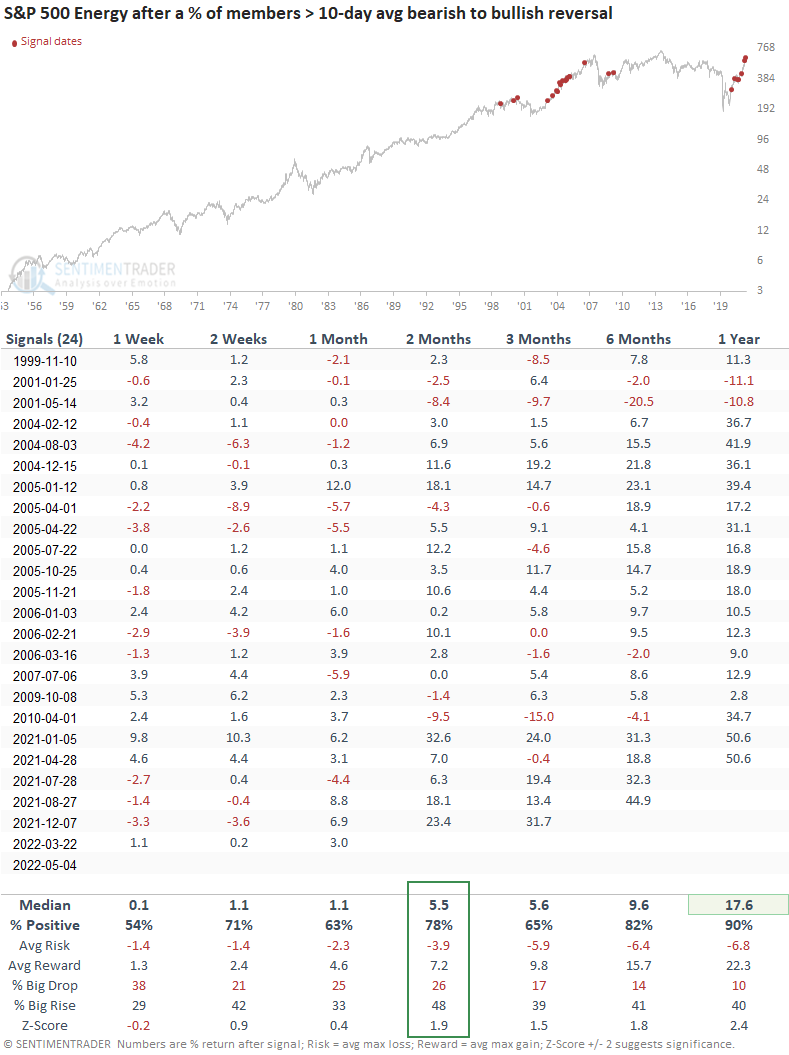
- If I include a trend filter, the sector rallied 78% of the time 2 months later
A trading model that measures a reversal in trend participation
The percentage of S&P 500 energy members trading above their respective 10-day moving average registered an oversold to overbought reversal buy signal on 5/4/22.
The trading signal identifies instances when the number of S&P 500 energy members trading above their respective 10-day moving average reverses from < 10% to > 92% in 5 sessions or fewer.
The energy sector rallied 66% of the time after other signals
This model generated a signal 83 other times over the past 68 years. After the others, the energy sector showed positive returns across all time frames. The 2-month window provides the best outlook with a z-score approaching significance. Signals since the pandemic low have been excellent, with a positive gain at some point in the first month in all 11 instances.
The energy sector rallied 78% of the time after other signals
If I include a trend filter that requires 90% or more energy members to have a rising 200-day moving average when the reversal occurs, this model generated a signal 24 other times over the past 23 years. After the others, the energy sector showed positive returns across all time frames. Once again, the 2-month window provides the best outlook for a trade opportunity. The difference in the number of signals between the two trading models highlights the rarity of sustainable energy stock uptrends. It's essential to mind the opportunity when you get an energy bull market.
What the research tells us...
When energy sector members trading above their respective 10-day average reverses from oversold to overbought, the momentum thrust begets more momentum. Similar setups to what we're seeing now have preceded rising energy stock prices, especially in the 2-month window. If I include a trend filter, the signal results look even better. Once again, the 2-month window provides the best opportunity.
Trading opportunities in the energy sector look constructive as the broad market remains challenging for index investors. I'm watching two potential stumbling blocks that could impact the bullish energy backdrop; an abrupt end to the Russia/Ukraine conflict with a lifting of sanctions or a possible recession. Until something changes, rinse and repeat.