
Energy markets rallying - but warning signs emerge

Key points
- Both crude oil and unleaded gas are trending higher within a favorable seasonal period
- This combination - favorable seasonality accompanied by strong price action - is ideal for a bullish position
- However, several key indicators are flashing clear warning signs for these markets
- This does not mean that the end of the rally is imminent - only that traders should not "fall in love with the trend"
The energy trend is your friend (for now)
Jay's Trading Maxim #37: Recognizing the trend right now (and accepting reality when it truly changes) is worth far more than a thousand predictions regarding what will happen next.
Ultimately, the best indicator is price action itself. Currently, crude oil and unleaded gas are enjoying a newly established uptrend. The charts below display price action (along with a 70-day exponential moving average to highlight the trend) for crude oil futures and unleaded gas futures. Both of these markets have rallied nicely since bottoming in late 2023.
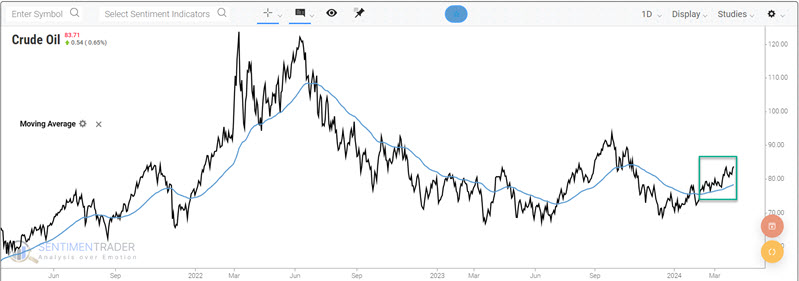
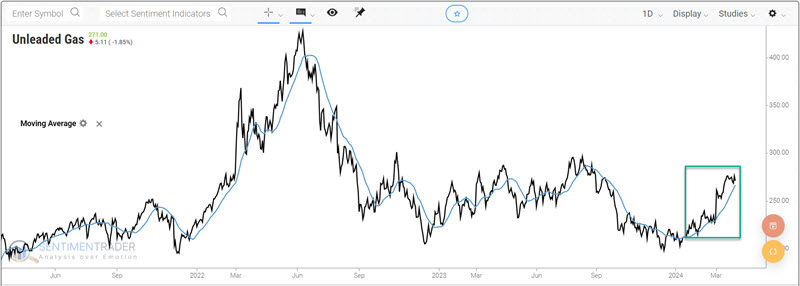
While there is no prediction built into a trend chart, the reality is that identifying the trend "right now" - and simply riding it - is often more helpful than 1,000 predictions. Currently, both markets are above a rising exponential moving average, i.e., in an established uptrend.
Seasonality is a favorable tailwind
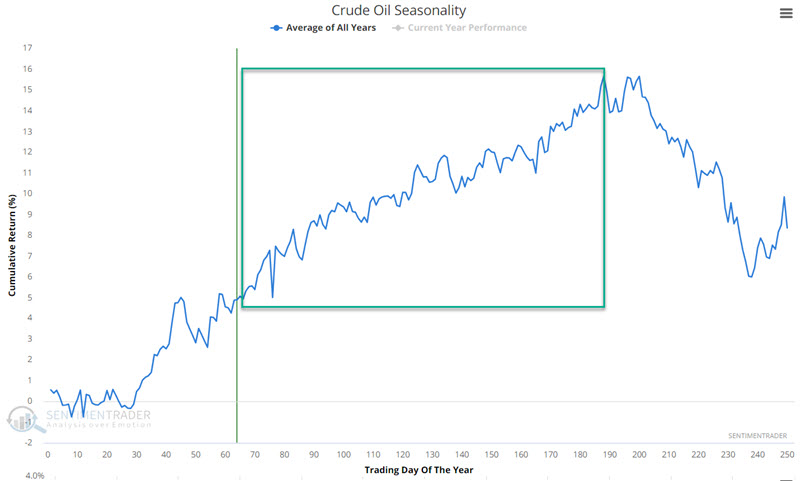
The energy markets are highly cyclical in nature. The chart below displays the annual seasonal trend for crude oil futures.
The chart below displays the hypothetical growth of $1 in crude oil (based on percentage price changes) if held from Trading Day of the Year (TDY) #64 through TDY #188 every year since 1985.
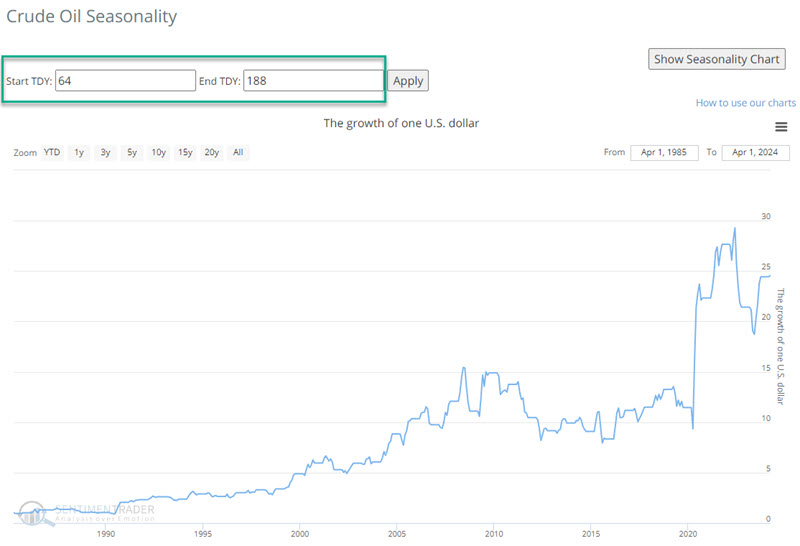
There were years when significant losses accrued. However, the "lower-left-to-upper-right" nature of the equity curve is critical to note. As long as price action remains favorable within this annual period, traders are encouraged to give the bullish case the benefit of the doubt.
We see something similar with unleaded gas. The chart below displays the annual seasonal trend for unleaded gas futures.
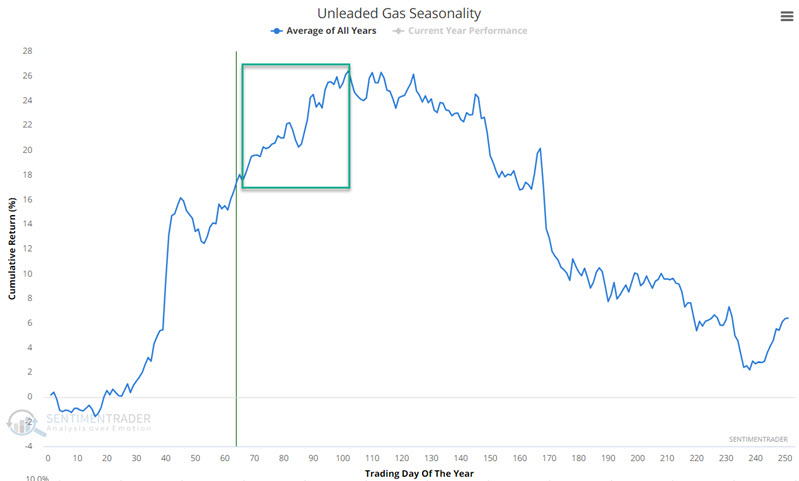
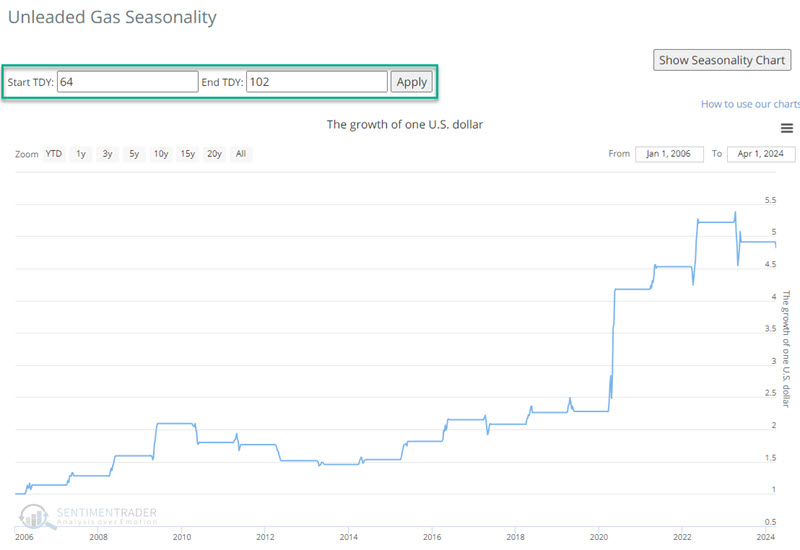
The chart below displays the hypothetical growth of $1 in unleaded gas (based on percentage price changes) if held from Trading Day of the Year (TDY) #64 through TDY #102 every year since 2006. Once again, we see a tendency for higher prices.
The bottom line is pretty simple: As long as price action for crude oil and unleaded gas remains favorable, traders should look for opportunities to play the long side of these key energy markets.
That said, a few potentially significant clouds appear to be gathering for the energy markets.
Crude Oil Term Structure flashes a warning alert
Jay's Trading Maxim #18: Follow the trend, but DO NOT fall in love with the trend.
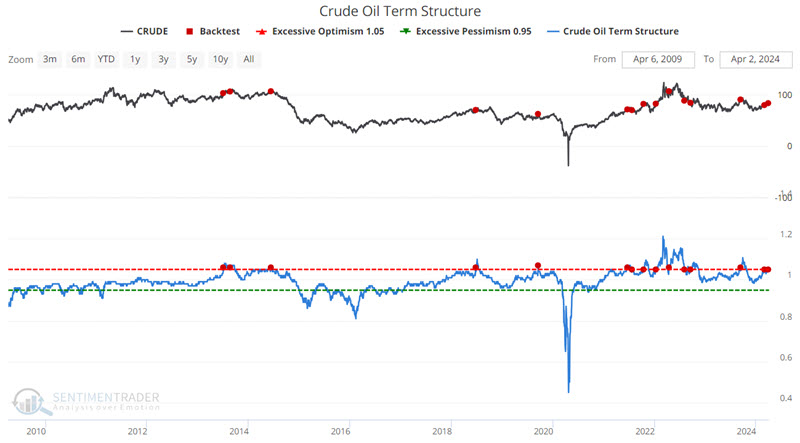
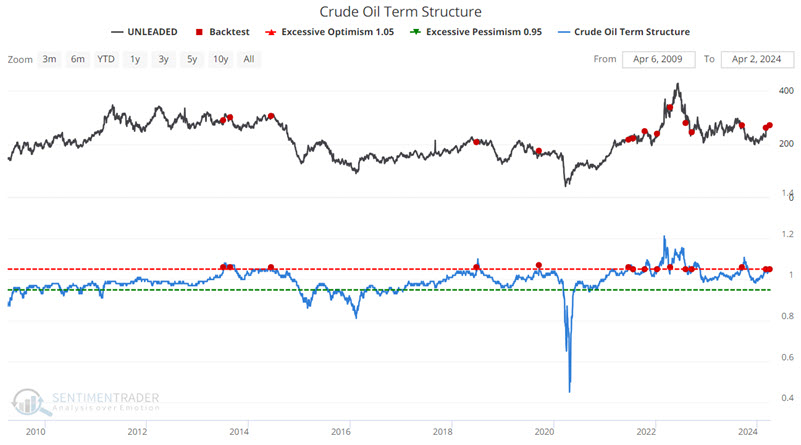
The term structure of crude oil futures shows the relationship of the near-term futures contract to a further-out contract. If it is above 1.00, the near-term contract is priced higher than the further-out contract, called backwardation. If below 1.00, then the market is in contango. Higher readings tend to precede price tops, and lower readings tend to accompany price bottoms.
The chart below highlights those dates in the last 15 years when the Crude Oil Term Structure crossed above 1.05 for the first time in 21 days. The most recent signal occurred on 2024-04-01.
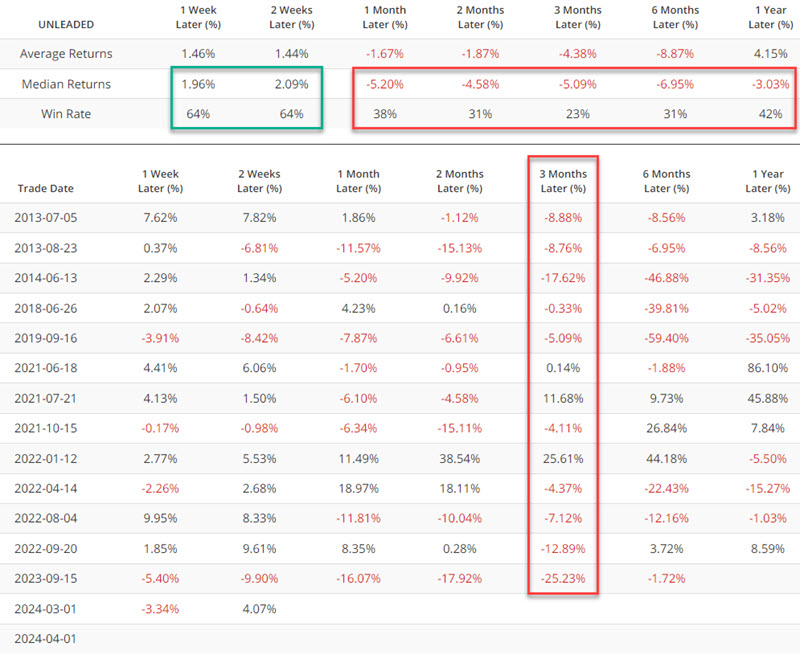
The table below displays the performance of crude oil futures following the dates highlighted in the chart above.
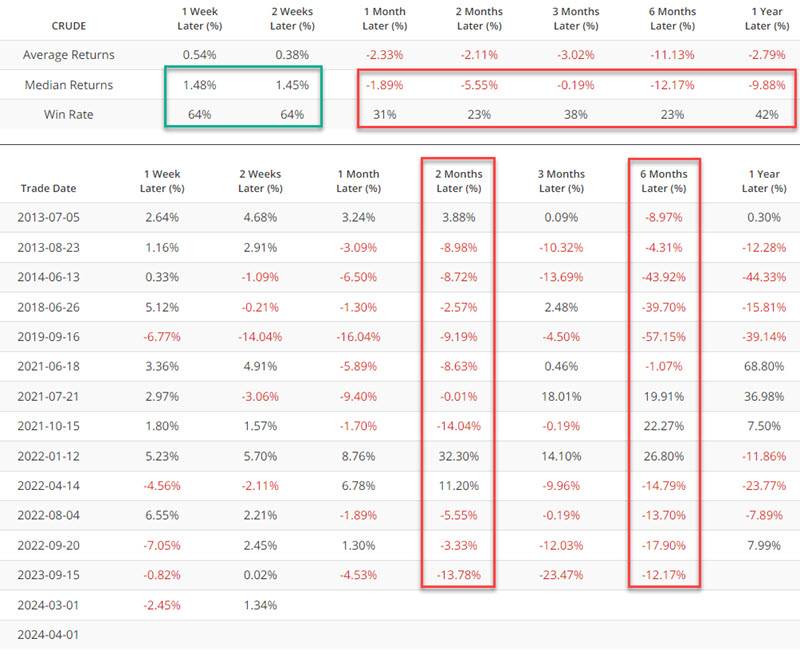
Note the strong tendency for weakness two months and six months after a signal. Results are similar for unleaded gas.
The chart below highlights those dates in the last 15 years when Crude Oil Term Structure crossed above 1.05 for the first time in 21 days versus unleaded gas. The most recent signal occurred on 2024-04-01.
The table below displays the performance of unleaded gas futures following the dates highlighted in the chart above.
Unleaded gas also displays a strong tendency for weakness following a cross above 1.05 for the Crude Oil Term Structure.
There is more potentially bad news.
Unleaded Gas Optix flashes a warning sign
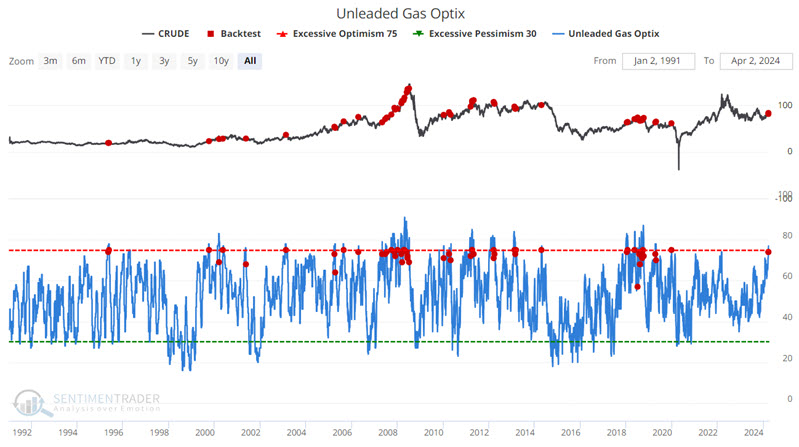
The chart below highlights those dates when our Unleaded Gas Optix indicator crossed below 75%.
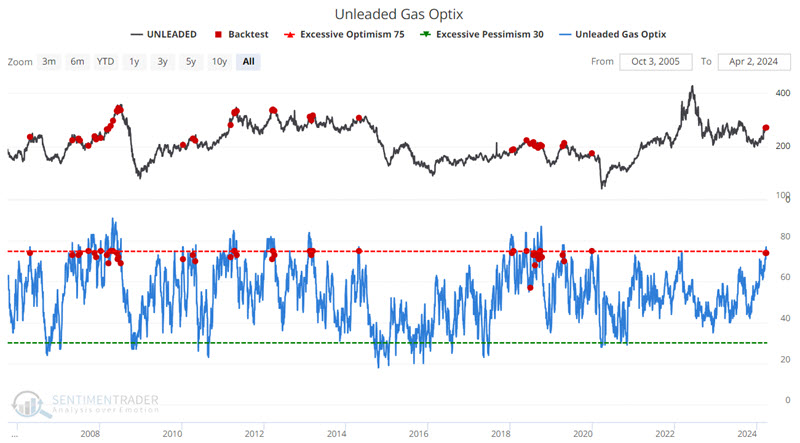
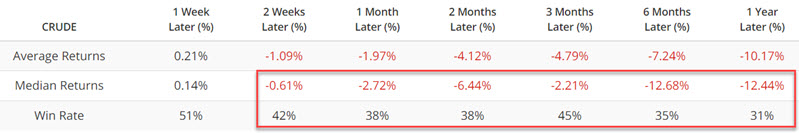
The table below summarizes Unleaded Gas performance following the signals dates in the chart above.
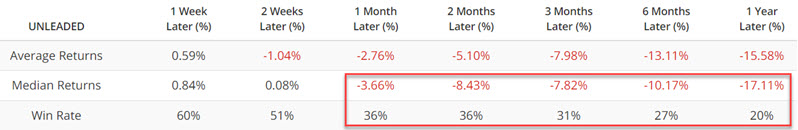
Like the previous indicator, a signal does not necessarily accompany an exact market top. But overall, the historical results are troubling. We can also apply this signal to Crude Oil futures. The chart and table below display Crude Oil futures performance following a cross below 75% for the Unleaded Gas Optix indicator.
What the research tells us…
"Someone" is going to be wrong. Either price and seasonality will win the day, and Crude Oil and Unleaded Gas will continue to trend higher, or the Term Structure and Optix indicators will exert enough influence to reverse the current trend. The implication for energy traders appears to be relatively simple: As long as favorable price trends remain intact, the long side is the place to be. However, if price action falters, a trader may be wise not to linger too long, hoping for another upleg.