Energy is Oversold

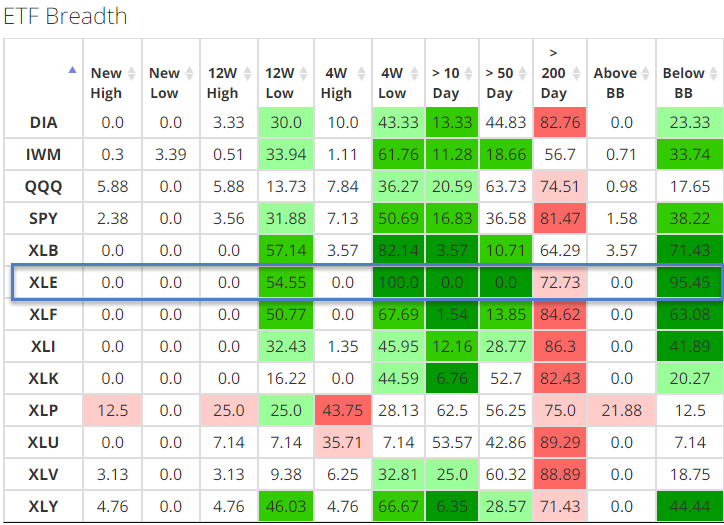
The breadth page on the website is an excellent resource to get a quick glimpse at the internal condition of the market for various indexes, sectors, and countries. Click here for the link. The market swoon over the last few days has created a short-term oversold condition for just about everything, but especially the energy sector. As the table below shows, 100% of the energy sector members registered a 4-week low, and 0% are trading above their respective 50-day moving average.
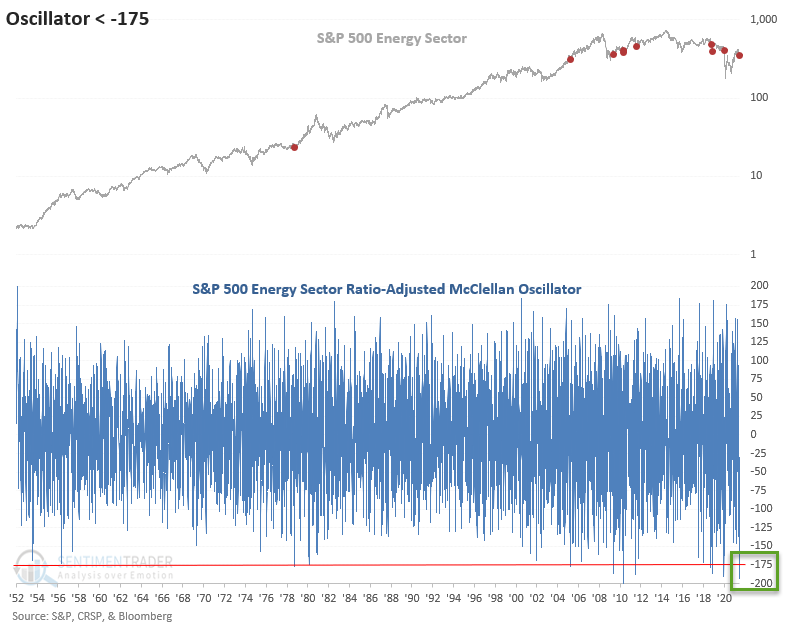
One of the indicators we maintain on the website is the ratio-adjusted McClellan Oscillator, which uses advancing and declining issues in the calculation.
The ratio-adjusted McClellan Oscillator for the S&P 500 energy sector has fallen to the second most oversold reading in history. Would you please scroll down to see the historical chart?
We've had a cautious outlook on the energy sector of late. However, that could change as the data changes.
In a note tomorrow, I will show you how I use the ratio-adjusted McClellan Oscillator to identify low-risk bullish thrust signals.
HISTORICAL CHART