
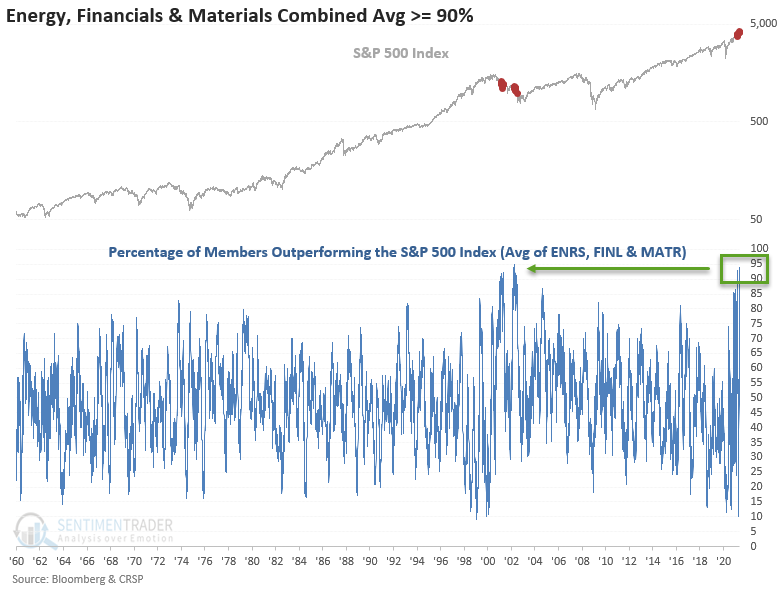
Energy, Financials and Basic Materials Outperformance

The combined average of energy, financial, and basic material sector members outperforming the S&P 500 on a rolling 1-month basis crossed above 94% on Monday, a level last breached in April 2002. The combined average has now crossed above 90% multiple times in the last few months.
Let's lower the threshold to 80% and assess what happens with value and growth stocks when the combined average crosses above 80%.
HISTORICAL CHART
The 90% level is rare and was last reached in the stunning growth versus value unwind in the 2000-02 bear market.
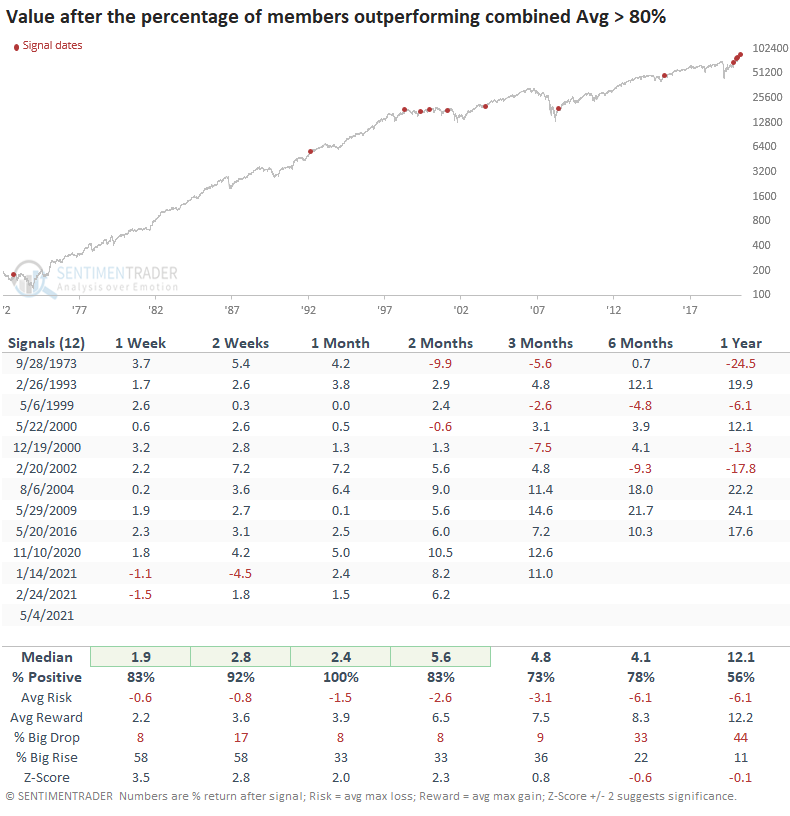
HOW THE SIGNAL PERFORMED - VALUE
Value returns look solid in the 1-13-week timeframe. The 1-year timeframe looks soft due to the 1999-2002 period.
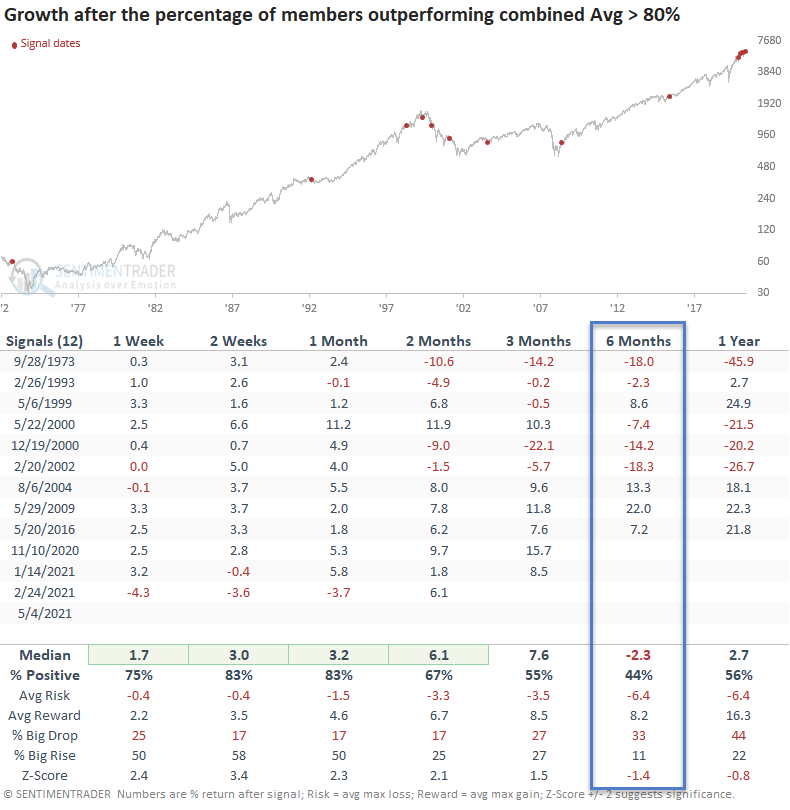
HOW THE SIGNAL PERFORMED - GROWTH
Interestingly, growth performance looks good in the short term. However, the 6-12 month timeframe suggests that the surge in the combined average is signaling that one should favor value.
HOW THE SIGNAL PERFORMED - RELATIVE VALUE VS. GROWTH
While the short-term results are a coin toss, the 3-12 month timeframes favor value.
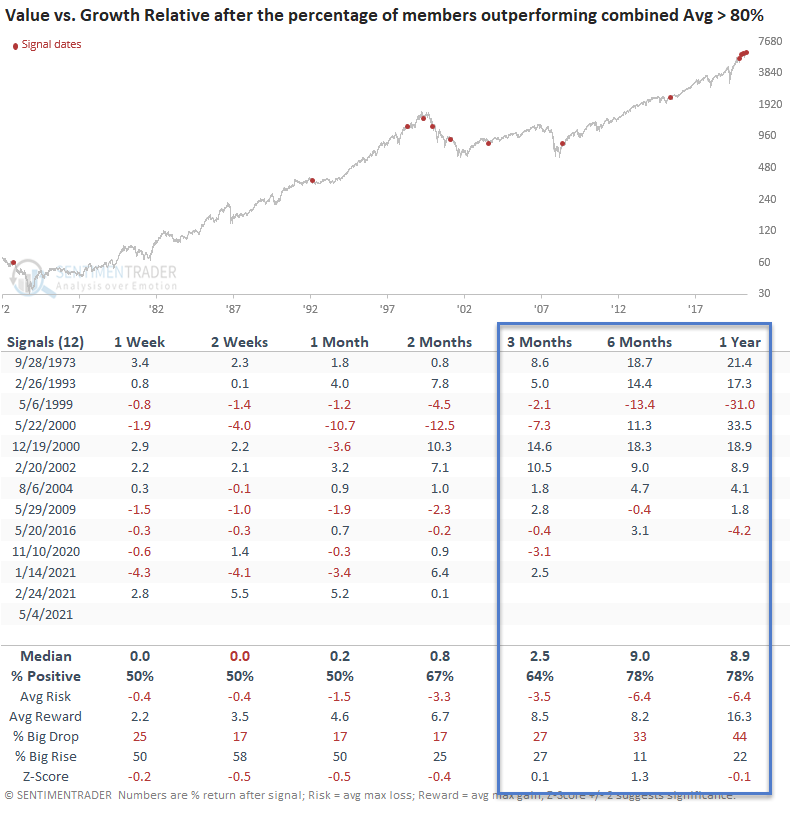
While the value trade may be due for a pause given the recent outperformance, I do not see anything that suggests a significant rotation back to growth is imminent.