
Energy breadth nears record relative to Utilities

Key points:
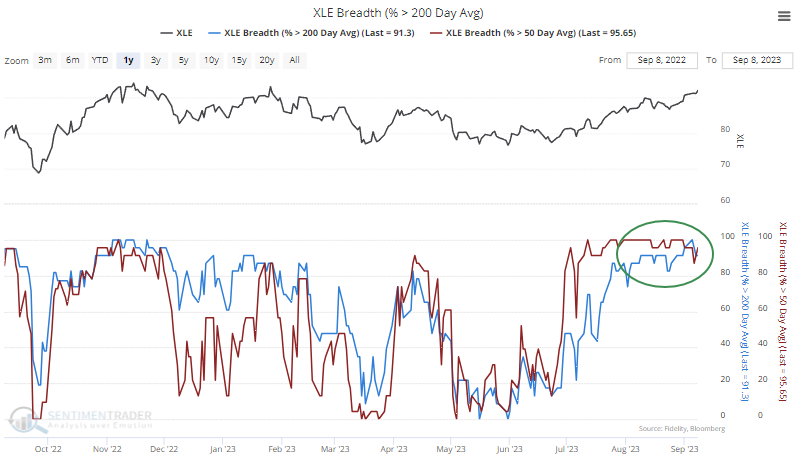
- Breadth among Energy stocks has been stellar, with nearly all the stocks above their major moving averages
- It has been the opposite case in Utilities, with almost all the stocks holding below their averages
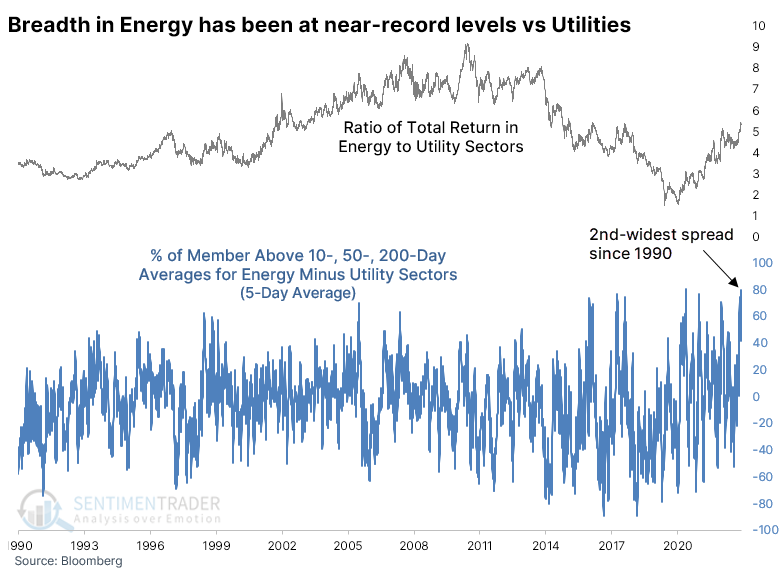
- The spread in breadth between the two sectors is at a near-record, and previous readings saw mean-reversion
Investors have rushed into Energy at the expense of Utilities
We've seen in various research lately how well stocks in the Energy sector have been doing...and how poorly they've been faring among Utilities. It hasn't changed much in recent days.
Almost all stocks in the former sector have been holding above their short-, medium-, and long-term moving averages.
While in the latter, few of the stocks have been able to hold above their averages.
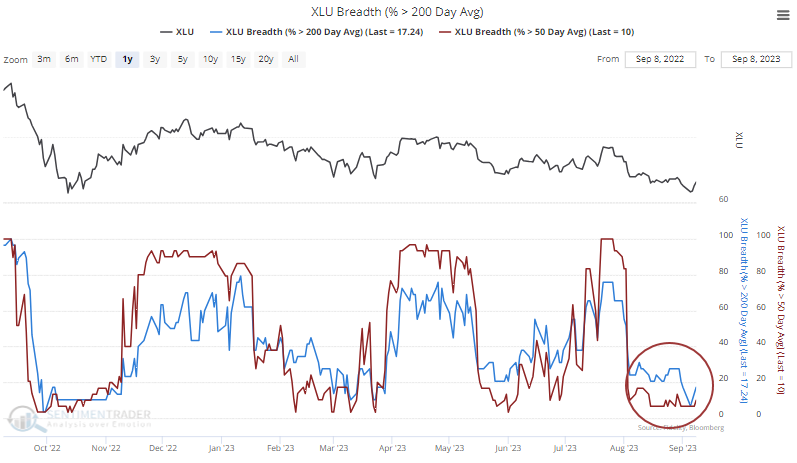
If we average the percentage of stocks in the Energy sector holding above their 10-, 50-, and 200-day moving averages, it comes to over 88%. The same calculation for Utilities results in an average of just 30%, but that's up from a miserable 5% a few days ago.
A 5-day average of the spread between these moving averages for the two sectors is below. Over the past week, that reading reached its 2nd-highest level in more than 30 years, just missing the previous record from March 3, 2021. That extreme nearly marked the multi-month peak in the spread between the total return in the Energy versus Utility sectors.
Big spreads in momentum tended to favor the beaten-down one
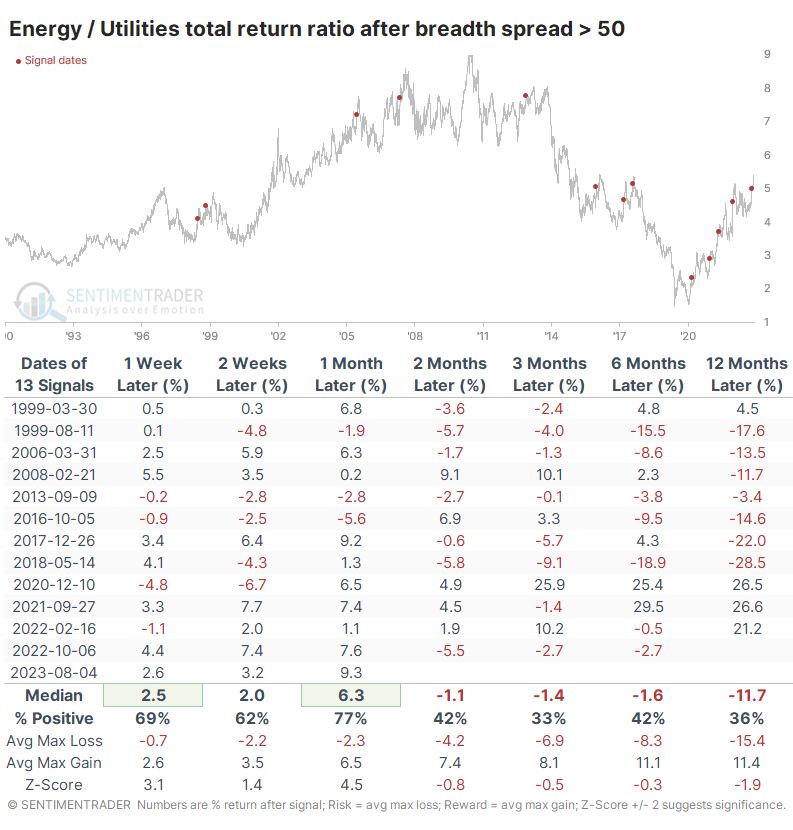
The table below shows other times when the spread in breadth between the two sectors reached at least 70% for the first time in at least three months. The sample is tiny, but there was only one time when the spread continued to widen over the following three months, and that one quickly - and severely - reversed in the months after that.
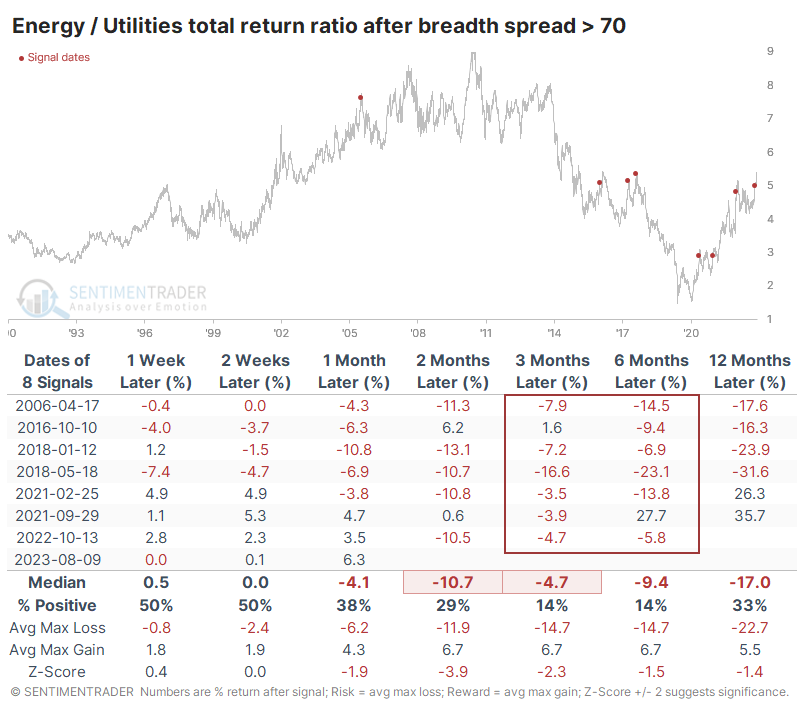
We can generate a larger sample size by relaxing the parameters. The spread continued to widen in the short term, as it did this time. But over the medium- to long-term, those gains tended to evaporate. Only two out of the thirteen signals showed a positive bias either three or six months later, and one of those gave all the gains back and then some.
What the research tells us...
Momentum and some breadth indicators in the Energy sector have been impressive, and there is modest evidence it could continue. But optimism on crude oil is entering extreme territory, and it comes at the expense of investments in other sectors to some extent. One of those is Utilities, which have suffered some of the worst bouts of selling pressure ever in recent weeks. When the spread in internal trends between the two sectors has been as wide as it is now, Energy had quite a bit of difficulty holding onto its positive momentum versus Utilities.