
Energy and utilities at opposite ends of breadth panic

Key points:
- Energy stocks are seeing selling pressure heavy enough to be considered at semi-panic levels
- Utility stocks are at the opposite end of the spectrum, with enough buying pressure to be "anti-panic"
- Wide spreads in selling pressure between those two sectors typically preceded mean-reversion
Panic and anti-panic
Earlier this week, we saw how much upside momentum utility stocks and indices had gathered as investors rushed to defensive sectors. That money has to come from somewhere, and in part, it came from more cyclical sectors like energy.
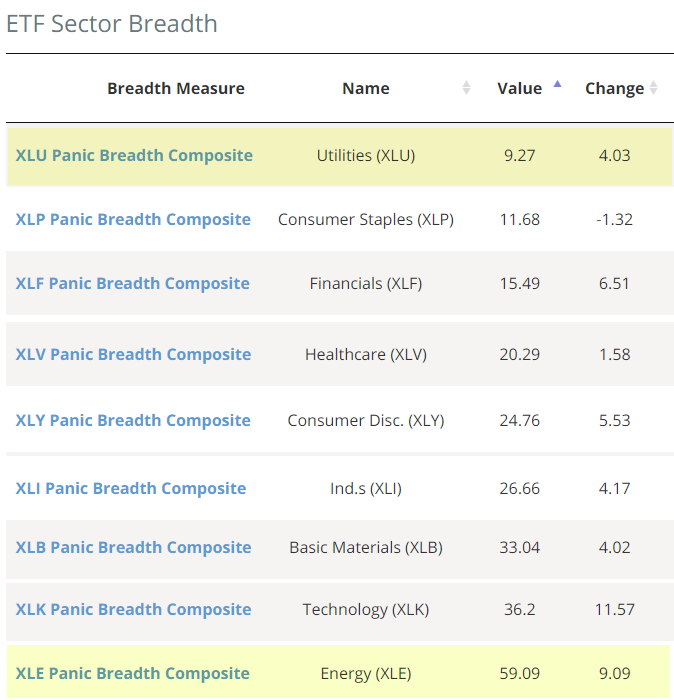
The Sector Breadth page shows that utilities and energy are at opposite ends of the spectrum among the major U.S. sectors. The Panic Breadth Composite aggregates a handful of measures into one convenient measure that monitors the level of internal selling pressure. There is very little in utilities and quite a lot in energy.
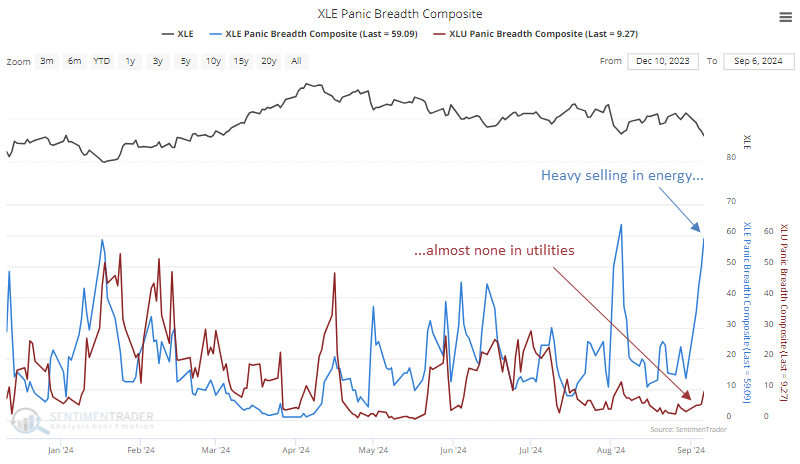
A chart shows how divergent the internal selling has been between the two sectors, with energy nearing 60 and utilities below 10. Energy isn't quite at all-out panic levels - it would need to approach 80 for that - but it's historically high.
Wide spreads in panic tended to lead to rebounds
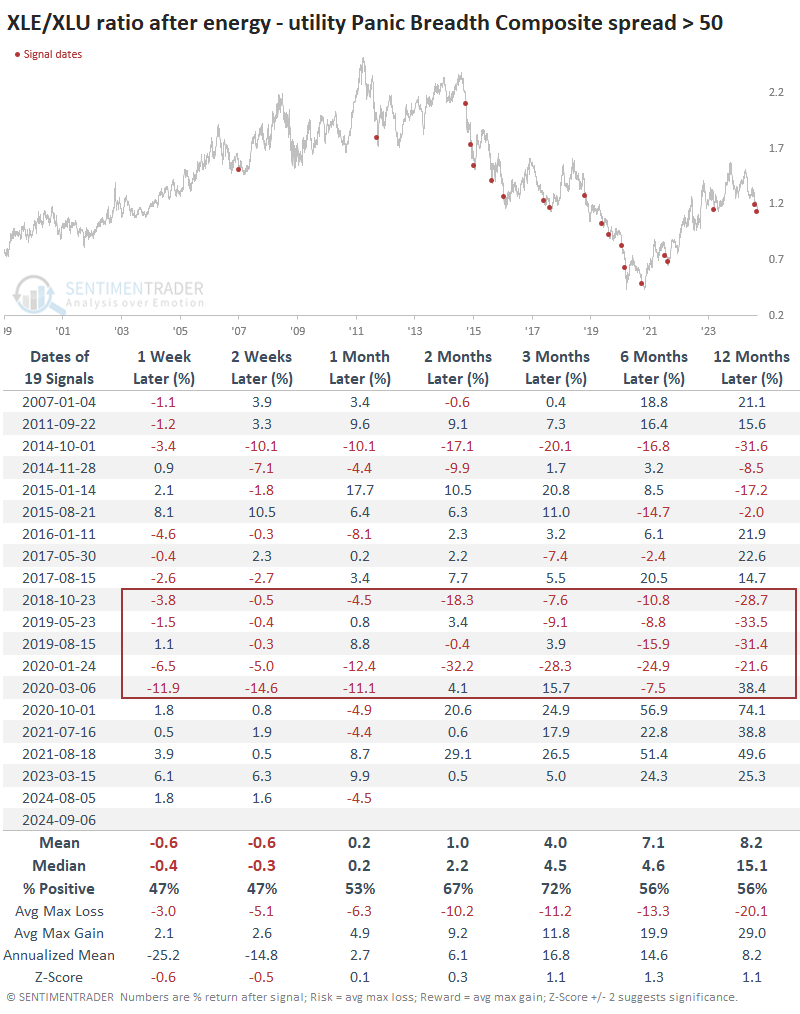
Before the past decade, it was rare to see a spread this wide between energy and utility stocks. It only happened twice between 1998 and 2014, preceding a nearly immediate turnaround in the sectors' fortunes. The ratio of the XLE fund (energy) to XLU (utilities) quickly turned up and headed significantly higher in the months ahead.
Since then, it has been much more hit-or-miss, especially the tumultuous period before and after the pandemic. Since 2021, the relationship has been more mean-reverting after extremely wide spreads in the Panic Breadth Composites. The prior signal from August shows a negative return, but that has not been an effective gauge of a longer-term mean-reverting probability.
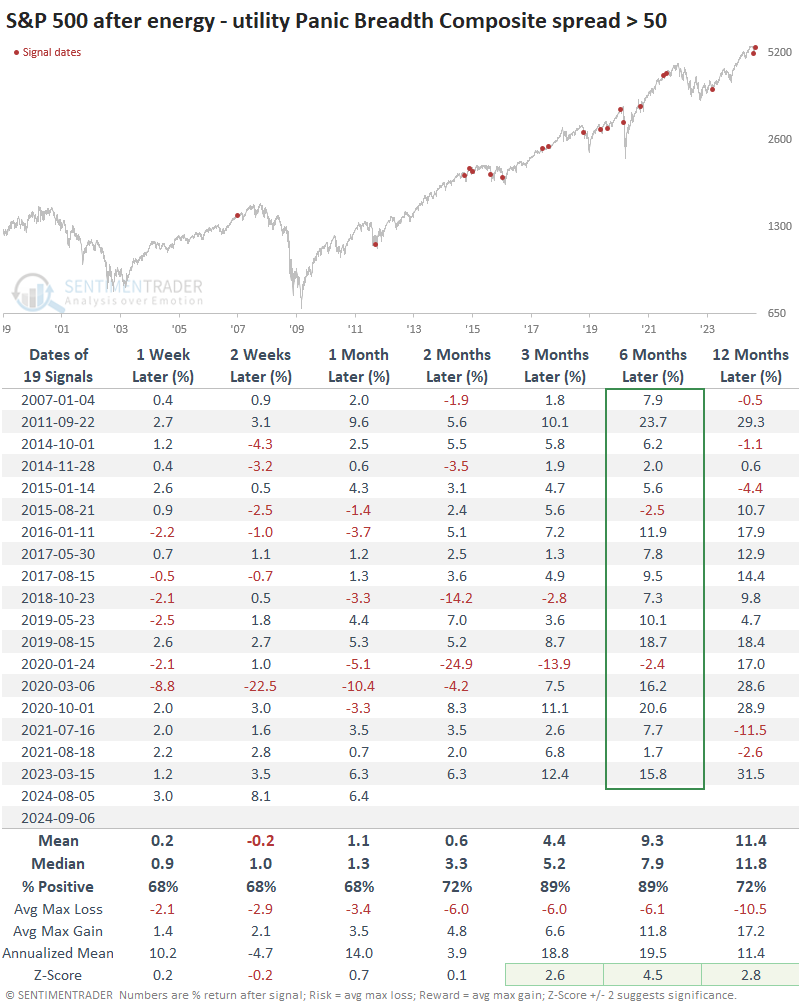
Because these spreads tended to happen when investors were concerned about economic growth, among other worries, it's not surprising that the broader market had often been weak when these signals were triggered. The S&P 500's returns following them were quite good, with only two small losses over the next six months.
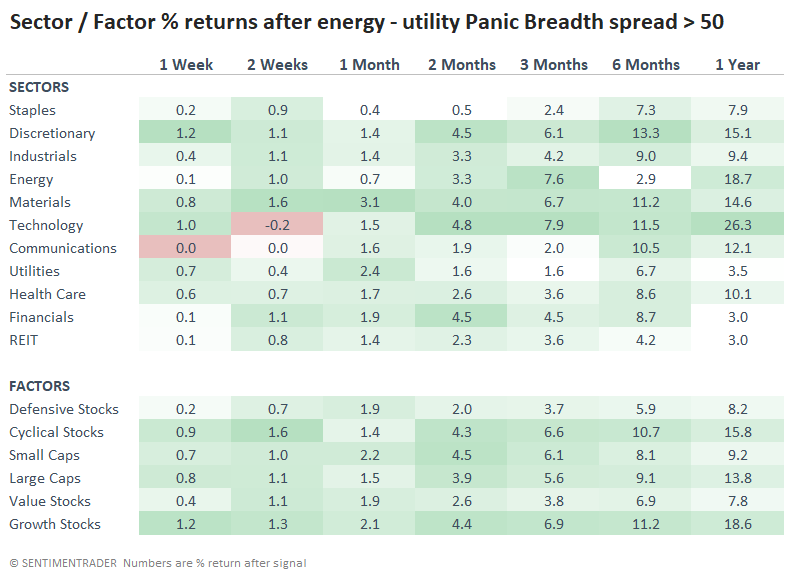
Because the past 25 years have generally favored growth stocks, especially technology, it's not a shock that discretionary and tech stocks showed among the best returns following wide spreads in the energy-utility stock Panic Breadth Composites. Both discretionary and technology were higher 100% of the time over the next six months.
What the research tells us...
There has been a rush of money into defensive sectors, including utilities. That group has had a particularly difficult time holding upside momentum. Energy stocks have borne the brunt of the selling pressure among sectors, but their tendency to rebound from those conditions isn't as reliable.
When we take them in combination, it's a sign of high worry among investors. That has typically been a good sign for the broader stock market, with a relatively consistent tendency to see a swing back toward energy over utilities.