
Energy and The McClellan Oscillator Thrust Signal Concept

As a research analyst, I'm constantly assessing the market landscape for new information to share with subscribers. On Monday, the energy sector reached one of the most oversold conditions in history as measured by the ratio-adjusted McClellan oscillator. When an opportunity like the current one unfolds, a trader or investor has to make a choice. Do we immediately buy the oversold condition, or do we wait for momentum to turn back up before initiating a position? A third choice could be purchasing half of our position on the oversold condition and the other half once a momentum signal occurs. In my opinion, each method has a time and place depending on the market environment and one's risk tolerance.
In today's note, I plan to review how I use the ratio-adjusted McClellan oscillator to identify a momentum thrust from an oversold condition. i.e., option 2 in our decision tree. And, because the energy sector has presented us with a highly oversold condition, we will use that sector for our example.
COMPONENTS
- Advancing Issues
- Declining issues
THE CONCEPT
The McClellan oscillator thrust signal identifies when an N-day net change in the ratio-adjusted McClellan oscillator crosses above a user-defined threshold after an oversold condition. By limiting the number of days in the net change calculation, one can identify a burst in participation that often leads to further price appreciation in the underlying index. The model will issue an alert based upon the following conditions.
SIGNAL CRITERIA FOR ENERGY
- The ratio-adjusted McClellan oscillator crosses below -110. i.e., the oversold reset condition
- If the reset condition is true and the 4-day net change in the ratio-adjusted McClellan oscillator crosses above +125, and the 5-day rate of change for the sector is positive, then buy.
HISTORICAL CHART
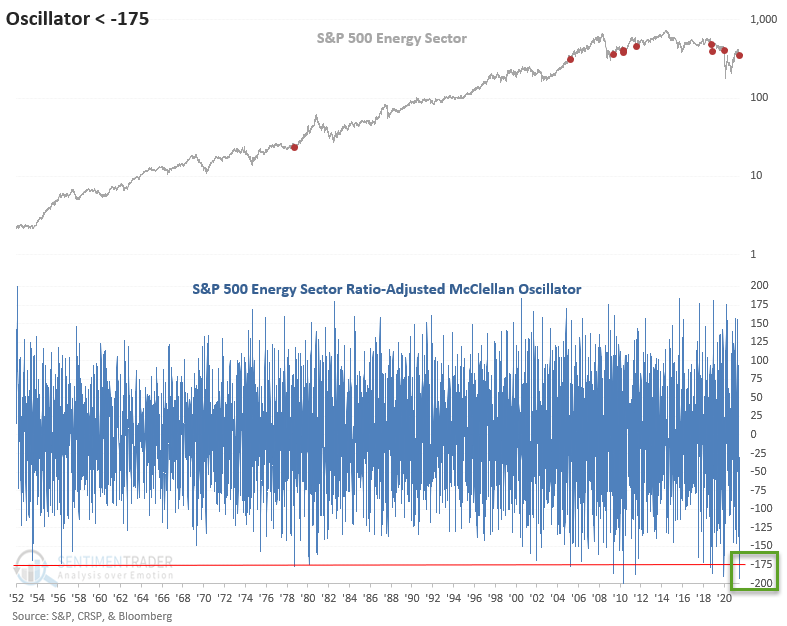
If you missed my intraday update on the oversold condition in the energy sector, here's a copy of the chart I shared. It shows that the ratio-adjusted McClellan oscillator fell to the second-lowest level in history on Monday.
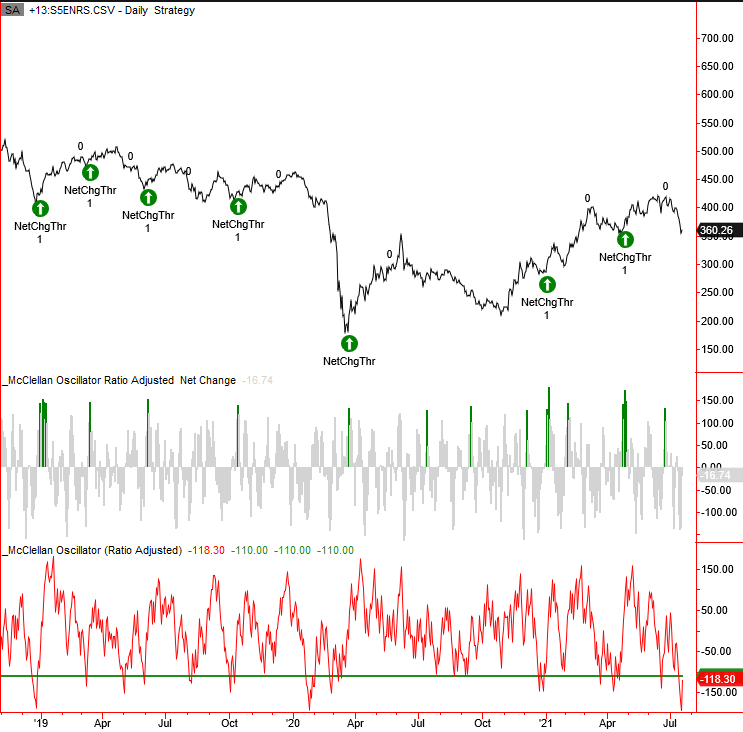
CURRENT DAY CHART
The oversold reset condition for energy is now confirmed as the ratio-adjusted McClellan oscillator crossed below -110. I will be monitoring the sector for a thrust signal.
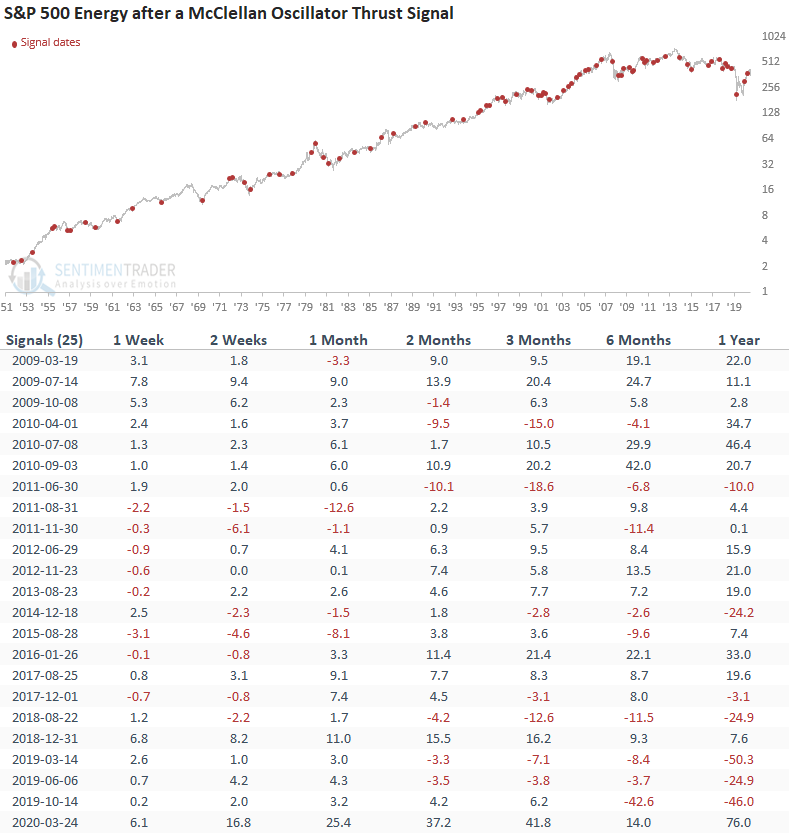
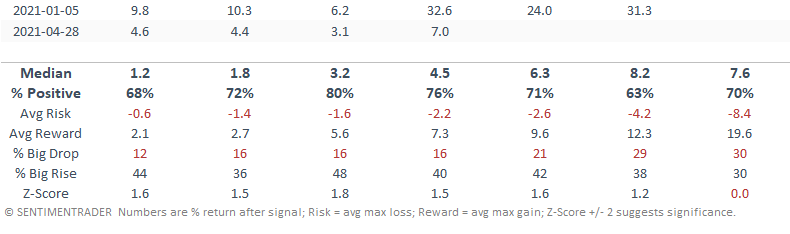
TRADING STATISTICS
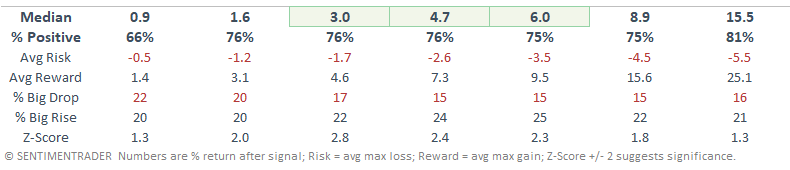
The trading statistics in the table below reflect the optimal days-in-trade holding period of 41 days. When I run optimizations for trading signals, I cap the max number of days at 42.
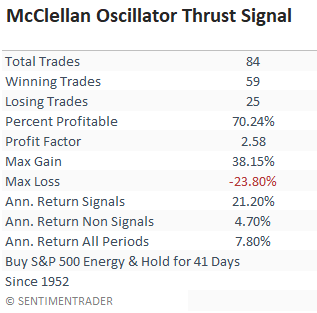
HOW THE SIGNALS PERFORMED
I would classify the win rate as good but not great, and the z-scores are consistently high across all timeframes. I like the risk/reward profile for what is a notoriously tricky sector to trade.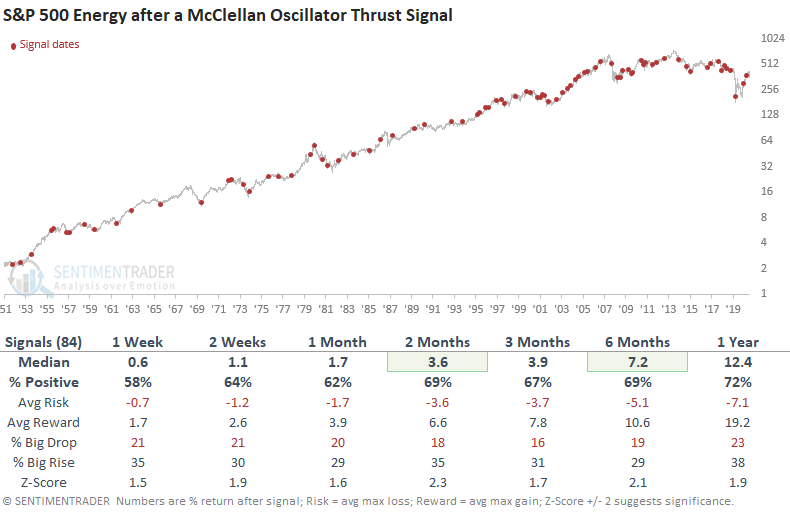
HOW THE SIGNALS PERFORMED SINCE 2009
If we look at the results since the low in 2009, we see slightly better results in the short to intermediate-term. And, I would note that the trading signal has closed out 11 consecutive winning trades in the 1-month timeframe.
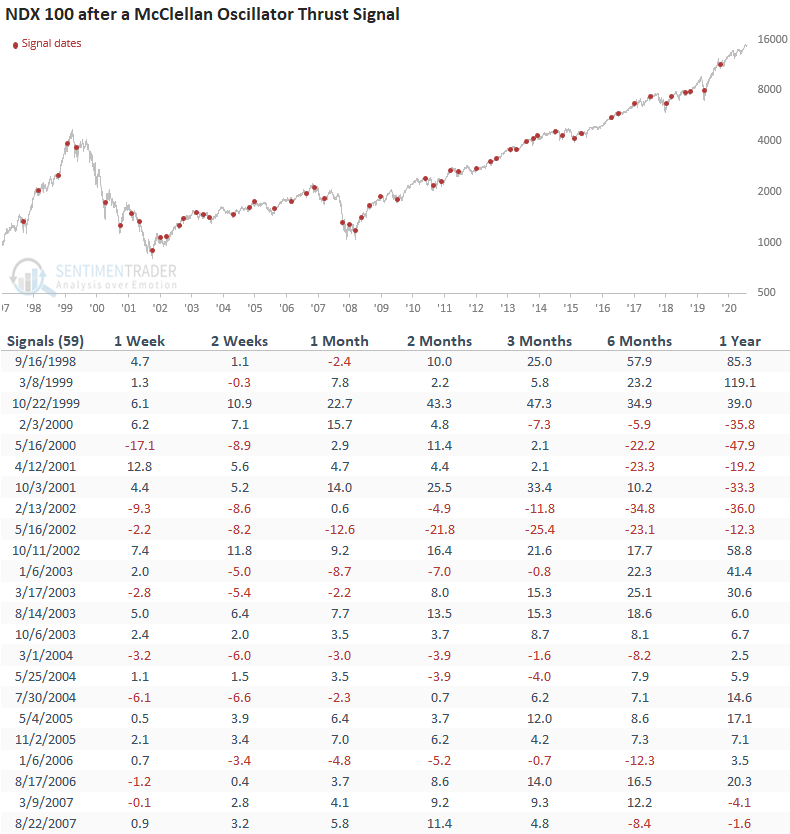
The Nasdaq 100 or QQQ ETF is a very popular trading vehicle and it often ranks as one of the top searches on the SentimenTrader website.
Let's take a look at the McClellan thrust signals for the Nasdaq 100 index.
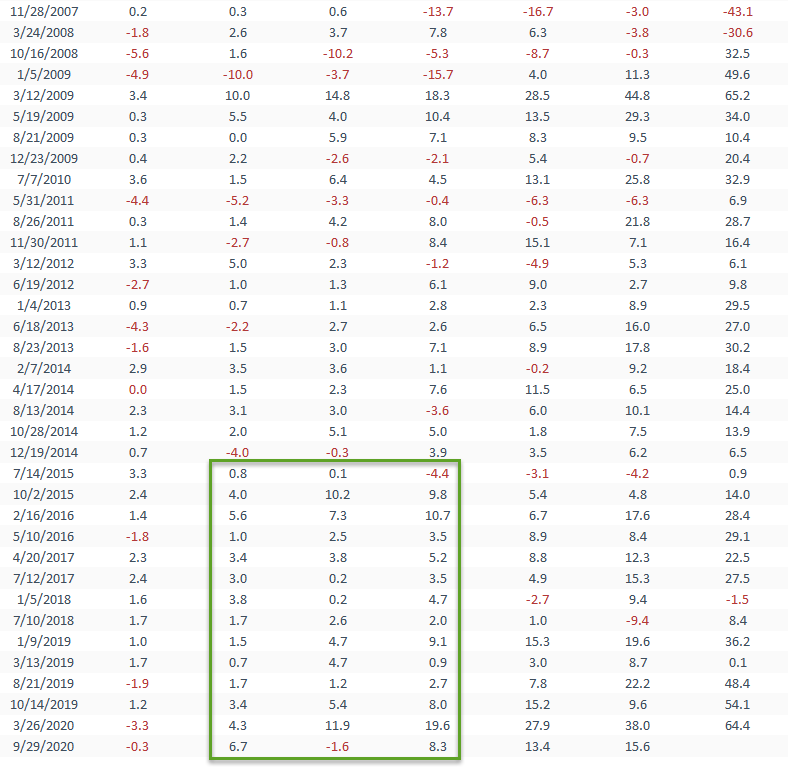
NASDAQ 100 SIGNALS
The Nasdaq 100 results look really solid with several notable z-scores. And, I would note that the trading signal has closed out 14 consecutive winning trades in the 2-week timeframe.
Suppose you were wondering why my ratio-adjusted McClellan oscillator values look different from the website values. In that case, it's because they use slightly different parameters. However, the conclusion is the same.
If you're interested in learning more about the ratio-adjusted McClellan oscillator, a google search should provide plenty of material.