
Employment Trends Index as an economic indicator

Key Points
- In Part I, we created a simple model to use the Conference Board Employment Trends Index to identify favorable and unfavorable periods for the stock market
- In Part II, we will assess the usefulness of the same model in forecasting economic activity
- When the model is favorable, the risk of recession has historically been very low
A quick review
In Part I, we highlighted that the Conference Board Employment Trends Index (ETI) is an aggregate of eight labor-market indicators intended to measure underlying trends in employment conditions. We also introduced a simple model that compares the latest reading for ETI to its own 14-month exponential moving average. We then assessed S&P 500 performance based on whether the index was above or below its 14-month exponential moving average. The results were compelling, as 95% of the total price gain for the S&P 500 in the last 50 years occurred when the index was in an uptrend, as objectively defined below.
The latest reading for the Employment Trends Index is evaluated once a month after the close of trading on the last day of the month. The measurements are:
A = Most recent available Employment Trends Index value as of the last day of the month
B = 14-month exponential moving average of A
C = A - B (latest monthly reading minus 14-month EMA)
Variable C is simply the difference between the latest monthly ETI reading and its 14-month EMA.
NOTE: The ETI for one month is reported in the following month. So, the December 2023 ETI value would be evaluated after the last trading day of January 2024.
The chart below displays Variable C, i.e., the difference between the latest ETI value and its 14-month EMA.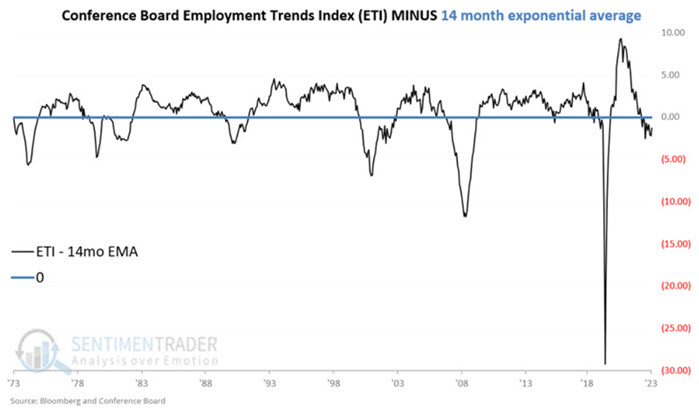
Let's evaluate how the economy performed based on positive or negative readings for Variable C, as shown in the chart above.
ETI versus the economy
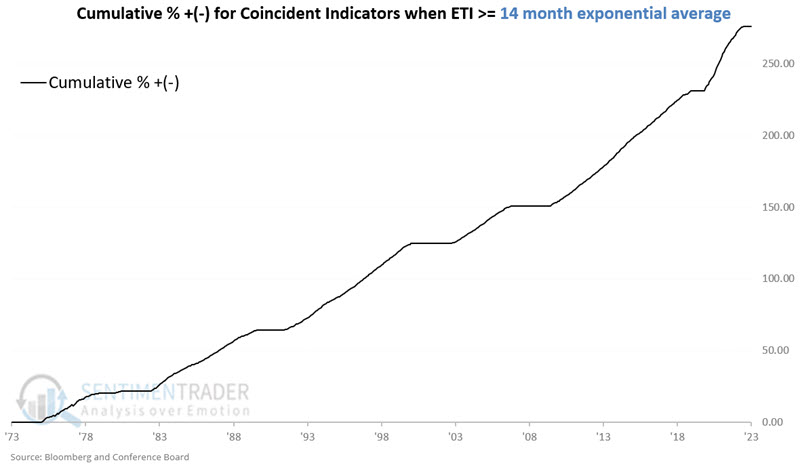
We will use the monthly change for the Coincident Economic Indicators (CEI) to measure economic performance from 1973-12-31 through 2023-12-31. The chart below displays the cumulative % growth for the Coincident Economic Indicators only during those months when the ETI closed the previous month above its 14-month EMA. The cumulative increase in the Coincident index during these months is +276.5%.
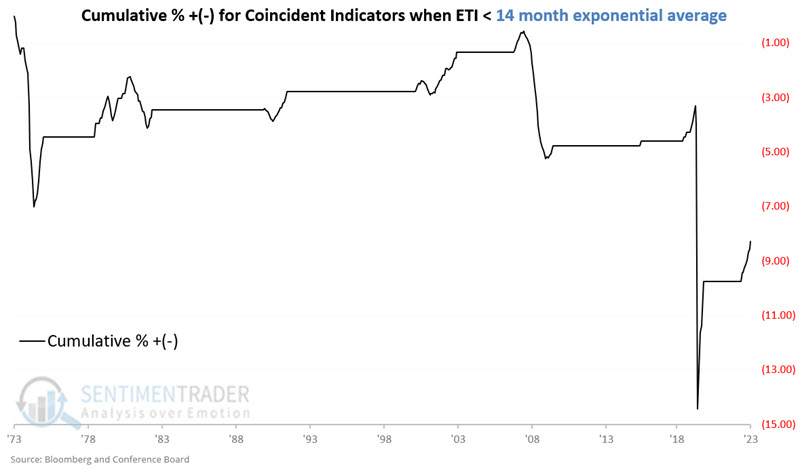
The chart below displays the cumulative % growth for the Coincident Economic Indicators only during those months when the ETI closed the previous month below its 14-month EMA. The cumulative return decline in the Coincident index during these months is -8.3%.
The table below summarizes the Coincident Economic Index performance for:
- All Months
- Favorable months (ETI>14mo EMA)
- Unfavorable months (ETI<14mo EMA)
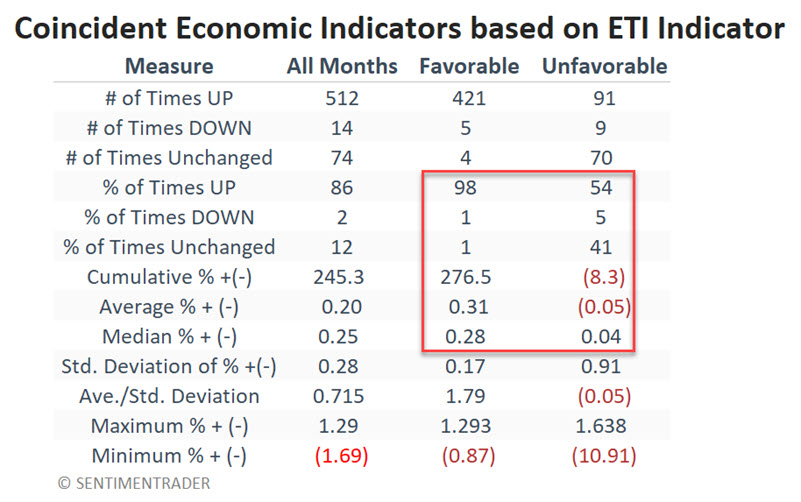
The difference in economic performance between favorable and unfavorable months is stark.
Key metrics to note:
- % of Months UP: Favorable mos. 98%, Unfavorable mos. 54%
- Cumulative % +(-): Favorable mos. +276.5%, Unfavorable mos. (-8.3%)
As always, past performance does not guarantee future results. With that caveat in mind, we can broadly generalize hypothetical historical results.
- The economy is highly unlikely to contract when ETI > 14mo. EMA (98% of all such months saw CEI show a gain)
- The economy is not necessarily expected to contract when ETI < 14mo. EMA BUT the likelihood of a recession is much higher (54% up months, 5% unchanged, 41% down months)
- All recessions in the past 50 years have occurred when ETI < 14mo. EMA
What the research tells us…
Over the past 50 years, the economy has shown a solid tendency to perform better when the Conference Board Economic Trends Index is above its 14-month EMA than below. As such, this model may have value as a weight of the evidence tool. Meanwhile, the unfavorable periods showed a net decline in economic activity as measured by the Coincident Economic Indicators index. The primary time to be alert to the potential for an economic slowdown is when Variable C, detailed above, is below zero and also below the reading the prior month. As of the end of January 2024, Variable C will be negative but above its level of the previous month.
While the long-term track record is compelling, it should be noted that the model has been negative (i.e., ETI < 14mo. EMA) since the end of June 2023. Since then, the S&P 500 and the Coincident Economic Index have trended higher. The model detailed above should be viewed as "weight of the evidence" and food for thought and not as a standalone trading model generating automatic buy and sell signals.